Machine Learning Based Comparison of Pearson’s and
Partial Correlation Measures to Quantify Functional
Connectivity in the Human Brain
Chaitra N.
*, P. A. Vijaya
Department of ECE, BNM Institute of Technology, Bangalore, Karnataka, India
Copyright©2018 by authors, all rights reserved. Authors agree that this article remains permanently open access under the terms of the Creative Commons Attribution License 4.0 International License
Abstract
Functional connectivity gives the statistical association or dependence between two or more distinct time series. Quantification of functional connectivity is normally done using Pearson’s correlation coefficient, which measures the degree of co-activation of two different brain regions. But the brain does not function merely on pairwise relations. Brain functioning is based on interrelationships between several functional units simultaneously. Partial correlation is one such measure which considers these interrelationships. It quantifies the correlation between two distinct time series, but also removes the confound of the other correlations. This paper compares these two measures using functional magnetic resonance images in a machine-learning framework. Connectivity analysis and classification of autistic individuals from control population was done using these two measures. Classification accuracies were compared, with the conclusion that the measure which results in statistically significant accuracy has better predictive ability, and is better suited for fMRI functional connectivity modelling. It was experimentally found that Pearson’s correlation coefficient gave better classification accuracy of around 2% than partial correlation measure.Keywords
Functional Magnetic Resonance Imaging, Functional Connectivity, Pearson’s Correlation Coefficient, Partial Correlation, Machine Learning1. Introduction
Brain connectivity refers to how functionally specialized units of the brain interact with one another. Its analysis can be carried out with three different forms of connectivity, anatomical, functional and effective [1]. Anatomical connectivity which is also called as structural connectivity, forms the connectome through synaptic
connections between neurons or fiber tracks connecting neuron pools at distant brain regions. Functional connectivity (FC) refers to statistical dependencies between distinct and distant brain regions. This can be quantified with measures such as coherence, correlation or transfer entropy. Effective connectivity on the other hand refers to influence that one neural system exerts on the other. Of these functional connectivity finds important application in classifying subjects.
The understanding and analysis of brain connectivity is made possible by specialized imaging methods. Brain imaging techniques allows observation of brain activities. With functional brain imaging techniques combined with advanced experimental designs and analysis, functions of different brain regions and their mutual interactions can be observed. Several tools for brain imaging are available for researchers. Functional magnetic resonance imaging (fMRI) is one such brain imaging tool which has found wide acceptability as it is non-invasive, lacks any form of exposure to radiation and for its relatively wider availability [2]. It measures correlations in neural activity between brain regions, by measuring spontaneous low-frequency fluctuations in blood oxygen level dependent (BOLD) signal.
Quantification of functional connectivity is often performed using Pearson’s correlation coefficient (PCC) [3]. PCC measures the degree of co-activation of two brain regions, that is, how well the time series from the two brain regions are correlated. However, the brain does not function solely on pairwise relationships between regions; rather it is a highly complex system functioning based on interrelationships between multiple of functional units simultaneously. Hence, the bivariate measure of PCC might not be the most suitable measure to quantify functional connectivity. Efforts have been made to use other measures that consider this, with one among them being the partial correlation (PC) measure [4].
conditional to the correlation between each of those time series and the rest of the time series in the framework. In other words, PC removes the confound of the other correlations while quantifying a particular connectivity. As a simple example, if A, B and C were three time series, the PC between A and B would regress out the confound of the correlation between A and C as well as the correlation between B and C.
Pearson’s correlation coefficient is often used to evaluate if the variables are related to each other or not. It measures how the variables vary together at a given time. It helps in measurement of linear relationship between the two variables. Partial correlation is useful in detecting hidden relationships and finding false relationships. PCC is still the most widely used measure to quantify FC given its simple interpretability and wide acceptability [3]. Studies directly comparing PCC and PC have been few, among which the most notable one is from Xia Liang et. al. [5]. In this paper authors have examined the influences of PCC and PC on the topological properties of brain networks. For evaluation of the influence of given correlation measures, statistical comparisons have been made between PCC based and PC based networks. Authors have found that, global and regional topological properties depend very much on correlation method used. Further analysis showed PCC based brain networks having global signals conserved and had the most reliable topological properties. Their results suggested that PCC is more valid and reliable than PC. With this background, it is evident that there are arguments supporting as well as opposing the use of both these measures and there is a lack of standardization regarding which measure to use. Thus, a direct comparison between PCC and PC is warranted.
This study aims to compare PCC and PC as brain functional connectivity measures using functional magnetic resonance images in a machine-learning framework. Here we present the classification of autistic individuals from healthy controls using functional connectivity analysis. Resting state fMRI data of 432 individuals having ASD and 556 healthy controls, from ABIDE database was used for this analysis. Here functional connectivity is calculated with Pearson’s correlation coefficient as well as partial correlation measures, and compared. Machine learning classification is employed to quantify the predictive abilities of PCC and PC measures. Classification accuracies obtained with PCC and PC measures are assessed and compared with the conclusion that the correlation measure which results in higher statistically significant accuracy has better predictive ability. In turn it also implies it carries much more information on brain states indicating the corresponding mental conditions. With this it can be
concluded the correlation measure which performs superior is better suited for fMRI functional connectivity modeling, as it carries information regarding the underlying brain states. The current study is a step in the direction of standardization of protocols and methods in fMRI data analysis.
Machine learning classification was done using recursive cluster elimination based support vector machine (RCE-SVM) classifier [6]. Support vector machine classifies data using supervised learning model. Combining recursive cluster elimination with support vector machine improves performance accuracy and accelerates statistical learning ability. This work is important for the research community because there have been an exponentially increasing number of fMRI functional connectivity studies, yet direct comparisons of PCC and PC are few, and a consensus on this issue has not emerged so far. The following sections discusse the methodology employed, results and discussions.
2. Materials and Methods
2.1. Data Acquisition and Pre-Processing
The Autism Brain Imaging Data Exchange (ABIDE) is a collaboration of 17 different international imaging sites that have come together to share neuroimaging data from 539 individuals diagnosed as ASD and 573 controls [7]. These datasets are composed of resting state functional MRI and structural data along with phenotypic information. Data is preprocessed, and multiple spatial and temporal quality control measures are provided. 432 individuals with autism spectrum disorder and 556 healthy controls shared by 15 different international organizations were considered for our study, as these had acceptable quality for our analysis.
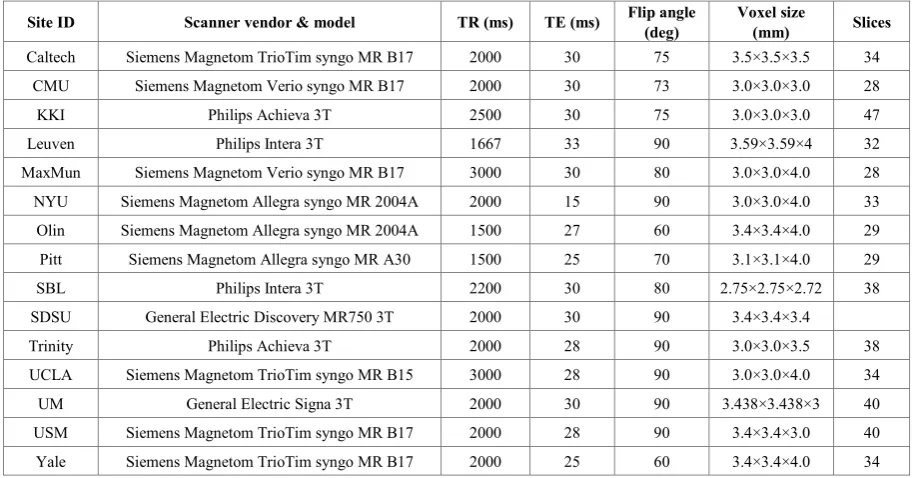
fMRI data was obtained in the resting-state condition, wherein subjects were asked to keep their eyes open, look at a white crosshair on a dark background displayed on a projection system, and not think about anything specific. fMRI acquisition parameters varied with acquisition site; Table 1 provides acquisition parameters for all sites.
Table 1. fMRI Acquisition parameters of various sites of ABIDE database
Site ID Scanner vendor & model TR (ms) TE (ms) Flip angle (deg) Voxel size (mm) Slices
Caltech Siemens Magnetom TrioTim syngo MR B17 2000 30 75 3.5×3.5×3.5 34
CMU Siemens Magnetom Verio syngo MR B17 2000 30 73 3.0×3.0×3.0 28
KKI Philips Achieva 3T 2500 30 75 3.0×3.0×3.0 47
Leuven Philips Intera 3T 1667 33 90 3.59×3.59×4 32
MaxMun Siemens Magnetom Verio syngo MR B17 3000 30 80 3.0×3.0×4.0 28
NYU Siemens Magnetom Allegra syngo MR 2004A 2000 15 90 3.0×3.0×4.0 33
Olin Siemens Magnetom Allegra syngo MR 2004A 1500 27 60 3.4×3.4×4.0 29
Pitt Siemens Magnetom Allegra syngo MR A30 1500 25 70 3.1×3.1×4.0 29
SBL Philips Intera 3T 2200 30 80 2.75×2.75×2.72 38
SDSU General Electric Discovery MR750 3T 2000 30 90 3.4×3.4×3.4
Trinity Philips Achieva 3T 2000 28 90 3.0×3.0×3.5 38
UCLA Siemens Magnetom TrioTim syngo MR B15 3000 28 90 3.0×3.0×4.0 34
UM General Electric Signa 3T 2000 30 90 3.438×3.438×3 40
USM Siemens Magnetom TrioTim syngo MR B17 2000 28 90 3.4×3.4×3.0 40
Yale Siemens Magnetom TrioTim syngo MR B17 2000 25 60 3.4×3.4×4.0 34
To bring time series to zero mean and unit variance the data was normalized. Blind convolution was carried out to reduce non-neural variability because of hemodynamic response function (HRF) [8]. This also helps in estimation of latent neuronal time series. Since hemodynamic response function and latent neural time series are estimated only from recorded data, deconvolution is blind. Deconvolution was performed with the method suggested by Wu et. al.[8]. To reduce the high dimensionality of the fMRI dataset, spectral clustering (cc200 template) was used to identify 200 functionally homogeneous brain regions. These 200 brain regions encompassed every voxel in the whole brain (cerebral cortex, subcortex, midbrain and cerebellum), and were non-overlapping. Each ROI comprised of about 1000 voxels, which were homogenous in their resting-state connectivity properties, as described in Craddock et. al. [9]. With these 200 brain regions, mean deconvolved time series was determined. The steps to follow, employed only these time series from 200 regions from every subject.
Pearson’s correlation coefficient which is also referred to as Pearson’s correlation is a measure of normalized covariance between two continuous variables. It can be calculated by dividing covariance of two variables from the product of their standard deviations.
𝜌𝜌𝑋𝑋,𝑌𝑌=𝑐𝑐𝑐𝑐𝑐𝑐(𝑋𝑋,𝑌𝑌)𝜎𝜎𝑋𝑋𝜎𝜎𝑌𝑌 (1)
Equation (1) gives Pearson’s correlation coefficient between time series X and Y, where, cov is the covariance and
𝜎𝜎
𝑋𝑋 &𝜎𝜎
𝑌𝑌 are the standard deviations of X and Yrespectively. If 𝜇𝜇𝑋𝑋 is mean of X, 𝜇𝜇𝑌𝑌 is mean of Y and E is
the expectation, then,
𝑐𝑐𝑐𝑐𝑐𝑐(𝑋𝑋, 𝑌𝑌) = E[(X − 𝜇𝜇𝑋𝑋)(𝑌𝑌 − 𝜇𝜇𝑌𝑌)] (2)
The equation (1) can be written as,
𝜌𝜌𝑋𝑋,𝑌𝑌=E[(X−𝜇𝜇𝜎𝜎𝑋𝑋𝑋𝑋)(𝑌𝑌−𝜇𝜇𝜎𝜎𝑌𝑌 𝑌𝑌)] (3)
Partial correlation on the other hand is a measure of strength of relationship between two variables, while controlling the influence of other variables. If our interest is to find the extent of relationship between two variables, then PCC might not be the best one as there could be one more variable that is related to both the variables. Computation of PC instead of PCC, helps in controlling the confounding variable.
2.2. Recursive Cluster Elimination Based Support Vector Machine (RCE-SVM)
Machine learning technique, recursive cluster elimination based support vector machine (RCE-SVM) was used in this study to classify ASD population from controls [6]. Support vector machines have found wide applicability for classification of datasets. Studies have also shown that SVM classification can be improved by using discriminatory features. Filtering and wrapper techniques were hence added for feature selection to improve upon performance of the classifier. Filtering step uses those features which are statistically different across classes. Statistical methods like t-tests were used to get the significant features. Wrapper techniques like recursive cluster elimination iteratively eliminate features so as to minimize prediction error. It removes those clusters that do not contribute much to classification performance.
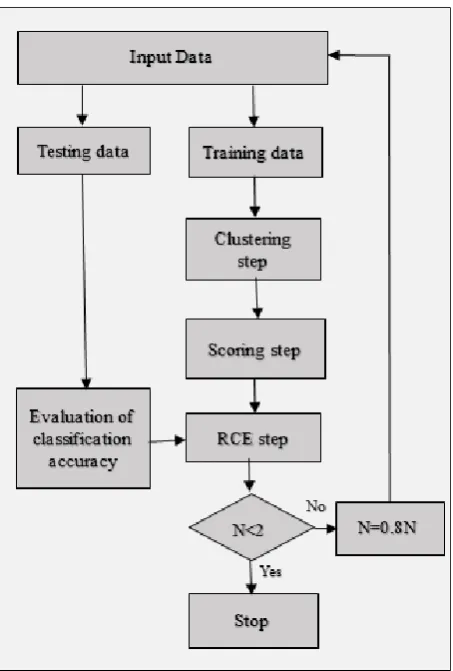
the data into N clusters, k-means clustering algorithm was used. In the beginning the total number of clusters was considered to be equal to number of features. This was gradually reduced by 20% at each iteration by removing low scoring clusters, till the number of clusters that remained was equal to two. N derived from each iteration became the initial value for RCE-SVM looping.
Figure 1. Flowchart depicting the RCE-SVM classification method
Clusters were ranked based on their ability to differentiate two classes in the scoring step. To rate the clusters, training data was randomly divided into six subsets (without overlap) of equal sizes (six folds). SVM was trained using five out of six. With the remaining subset, performance was evaluated. Many different partitions were made by repeating hundred times the clustering and cross validation steps. For all the repetitions, classification accuracy was found out with the test dataset.
Considering the repetitions and the folds, average value of the calculated accuracy was assigned as the score of the cluster. Low scoring clusters (lowest 20%) were eliminated from the RCE step. Features those remained after this elimination were combined and value of N was reduced by a factor of 20%. Clustering, scoring and RCE steps were repeated iteratively. With every iteration performance was evaluated. All the mentioned steps were repeated till total number of clusters became equal to 2. Complete separation of training and testing data removes any bias in
performance accuracy [10]. Mean value of accuracy tabulated over hundred repetitions of each iteration, each training and testing data split, gave the accuracy of every RCE-SVM round.
RCE-SVM classification [6] was performed independently using the PCC and the PC measures obtained from the ABIDE dataset. The top-predictors and classification accuracies obtained with PCC and PC measures were compared to assess which measure has the higher predictive ability, thus giving us the measure which has higher discriminative evidence regarding the neurobiology of autism and also being a superior choice for modeling functional connectivity in the brain.
3. Results & Discussions
Classification was performed using two different functional connectivity measures, PCC and PC. We found that (Figure 2) classification based on PCC provides better classification accuracy than PC (by over 2%, p=1.6×10-49).
[image:4.595.309.536.457.644.2]This finding confirms that the PCC measure is superior to the PC measure, and that it is more suitable for fMRI FC analysis. One possible reason for this could be that PC is a considerably more conservative measure than PCC [5], given that the confounding effects of hundreds of other connections would be regressed out in its evaluation. Hence, those connections that are discriminative with PCC might seize to be discriminative with PC, in effect, when combining from all connections across the brain, could reduce the overall discriminative ability of the features.
Figure 2. Average classification accuracies obtained with RCE-SVM classification; independently performed with Pearson’s correlation coefficient (PCC) as well as partial correlation (PC). We observed higher accuracy with PCC, with about 2% better performance in the final iteration (statistically significant, p=1.6×10-49).
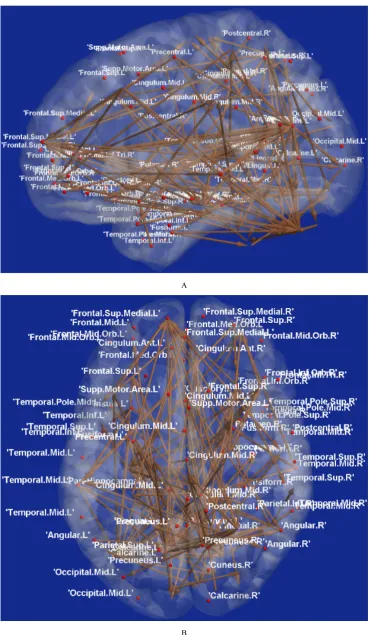
classification, were those that were instrumental in resulting the highest classification accuracy reported earlier. With PCC, most of the connections were associated to inferior parietal regions (angular gyrus) along with their connections to medial prefrontal regions. Angular gyrus is known to be involved in number of processes related to attention, language, memory retrieval and theory of mind [11]. Theory of mind involves understanding and decoding of another person’s thoughts. This is impaired in autistic individuals leading to impairment in social functioning. Medial prefrontal cortex gets activated during thinking and analysing attributes of another individual. Impaired connectivity between angular gyrus and medial prefrontal regions (as seen from PCC), explains abnormal social functioning and increased self-referential thought processes which are often observed in autistic individuals.
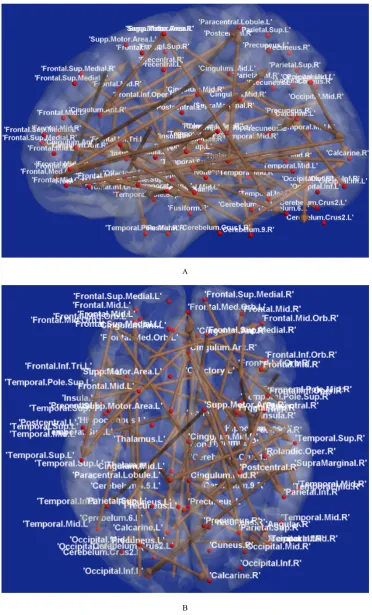
In the network obtained from PC (Figure 4), we do not observe such connectivity; instead, the network exhibits nearly a random structure, with no predominant connections arising from any lobe of the brain, or any other brain region commonly implicated in ASD. Findings from Pearson’s correlation and partial correlation indicates PCC network being neurobiologically plausible and confirms with the reports from earlier works [11]. Whereas the network derived using PC is not in agreement with prior works, which leads to a conclusion that it is not much suitable as a reliable biomarker for brain functional connectivity of autistic individuals.
There are strong arguments for the use of PC in fMRI functional connectivity modeling. It provides a bivariate characterization of functional connectivity that considers the relationships between the two brain regions under consideration with the rest of the regions in the brain, which seems to be more accurate modeling of functional connectivity in the brain. However, our results suggest that the validity of the findings, degree of information and thus the discriminative ability of the connectivity features would have to be compromised if one were to choose PC over PCC. In circumstances when a fewer number of
regions are being considered in the analysis framework, and a specific hypothesis is being tested, wherein it is known beforehand as to which connections might influence the other connections, only then would it be strongly justified to use PC over PCC. This is because, in those circumstances, the effect of other confounding connections on a given connection would have to be minimized to decipher the true nature of a connection. We thus suggest the research community to utilize the PCC measure during conventional fMRI functional connectivity analysis.
4. Conclusions
A
[image:6.595.113.483.74.710.2]B
A
[image:7.595.112.485.76.692.2]B
REFERENCES
[1] E. W. Lang, A. M. Tomé, I. R. Keck, J. M. Górriz-Sáez,C. G. Puntonet, Brain Connectivity Analysis: A Short Survey, Computational Intelligence and Neuroscience, 2012 [2] Karl J. Friston, Functional and Effective Connectivity: A
Review, Brain Connectivity, Vol. 1, No.1, 2011
[3] Power JD, Cohen AL, Nelson SM, Wig GS, Barnes KA, Church JA, Vogel AC, Laumann TO, Miezin FM, Schlaggar BL, Petersen SE, Functional network organization of the human brain, Neuron, Vol. 72, Issue 4, 665-678, 17 November 2011
[4] Marrelec G, Krainik A, Duffau H, Pélégrini-Issac M, Lehéricy S, Doyon J, Benali H, Partial correlation for functional brain interactivity investigation in functional MRI. NeuroImage, Vol. 32, Issue 1, 228-237, 1 August 2006 [5] Liang X, Wang J, Yan C, Shu N, Xu K, Gong G, He Y.
Effects of different correlation metrics and preprocessing factors on small-world brain functional networks: a resting-state functional MRI study, PLoS One, Vol. 7, Issue 3, 1-16, March 2012
[6] G. Deshpande, Z. Li, P. Santhanam, C. L. M. Coles, S. Hamann, X. Hu, Recursive cluster elimination based support vector machine for disease state prediction using
resting state functional and effective brain connectivity. PLoS One, Vol. 5, No. 12, 2010.
[7] http://fcon_1000.projects.nitrc.org/indi/abide/
[8] G. Wu, W. Liao, S. Stramaglia, J. Ding, H. Chen and D. Marinazzo, A blind deconvolution approach to recover effective connectivity brain networks from resting state fMRI data. Med Image Anal., Vol. 17, No. 3, 365-374, 2013.
[9] R. C. Craddock, G. A. James, P. E. I. Holtzheimer, X. P. Hu and H. S. Mayberg, A whole brain fMRI atlas generated via spatially constrained spectral clustering. Human Brain Mapping, Vol. 33, 1914–1928, 2012.
[10]Nikolaus Kriegeskorte, W Kyle Simmons, Patrick SF Bellgowan, Chris I Baker, Circular analysis in systems neuroscience-the dangers of double dipping. Nature Neuroscience, Vol. 12,No. 5, 535–540, 2009
[11]Hull J V, Jacokes Z J, Torgerson C M, Irimia A, Van Horn J D, Resting-State Functional Connectivity in Autism Spectrum Disorders: A Review. Frontiers in Psychiatry, Vol. 7, Article 205, Jan 2017