Big Data Analytics for Professionals,
Data-milling for Laypeople
Ulla Gain
1,*, Virpi Hotti
21Foster Wheeler Energia Oy, 78201 Varkaus, Finland
2Department of Computer Science, University of Eastern Finland, 70211, Kuopio, Finland
*Corresponding Author: [email protected]
Copyright © 2013 Horizon Research Publishing All rights reserved.
Abstract
There exist large amounts of heterogeneous digital data. This phenomenon is called Big Data which will be examined. The examination of Big Data has been launched as Big Data analytics. In this paper, we present the literature review of definitions for Big Data analytics. The objective of this review is to describe current reported knowledge in terms of what kind of Big Data analytics is defined in the articles that can be found in ACM and IEEE Xplore databases in June 2013. We found 19 defining parts of the articles for Big Data analytics. Our review shows that Big Data analytics is verbosely explained, and the explanations have been meant for professionals. Furthermore, the findings show that the concept of Big Data analytics is unestablished. Big Data analytics is ambiguous to the professionals - how would we explain it to laypeople (e.g. leaders)? Therefore, we launch the term data-milling to illustrate an effort to uncover the information nuggets. Data-milling can be seen as an examination of heterogeneous data or as part of competitive advantage. Our example concerns investments of coal power plants in Europe.Keywords
Big Data Analytics, Literature Review, Data-milling, Information Nugget1. Introduction
Big Data has as a term appeared literally first times towards the end of the 1990's [1]. In the year 2012, Chaudhuri[2] crystallizes the term as follows: “Big Data symbolizes the aspiration to build platforms and tools to ingest, store and analyze data that can be voluminous, diverse, and possibly fast changing”.
It is not clear who are professionals and who are laypeople in Big Data era. For example, computer scientists, statisticians, mathematicians, and informatics have Big Data capabilities [3]. Usually, laypeople are not interested in platforms and tools – they are interested in results of analyzed data. Furthermore, laypeople might be worry about growing data masses (“90% of the data in the world today
has been created in the last two years alone” [4]) and their analysis (“3% of the potentially useful data is tagged, and even less analyzed” [5]).
There are many challenges in examining heterogeneous (i.e. diverse) data. We want to use the term data-milling to illustrate examining heterogeneous data. Before we launch the term data-milling (Section 3), we have to research how the term Big Data analytics is defined (Section 2). Therefore, we make literature review. Furthermore, we research an example from energy industry and discuss through the example (Section 4). The example is connected to the decision-making from the coal power plants investments in Europe.
Our research strategy is partly descriptive and partly improving. Our literature review of Big Data analytics describes current status of the phenomenon Big Data. Through launching the term data-milling we try to improve understanding of the phenomenon Big Data, as well as, possibilities of data analytics.
2. Literature Review of Big Data
Analytics
Reviews of research literature are conducted to provide "a theoretical background for subsequent research", to learn “the breadth of research on a topic of interest” and to answer “practical questions by understanding what existing research has to say on the matter” [6]. We do not make systematic literature review as “a form of secondary study that uses a well-defined methodology to identify, analyze and interpret all available evidence related to a specific research question in a way that is unbiased and (to a degree) repeatable” [7]. However, we will explicitly explain the procedure of our literature review. Therefore, we have partly adapted two review guidelines: Okoli and Schabram[6], Kitchenham and Charters[7].
refer to concepts”. Our review process has the following steps:
1. Specifying the search terms 2. Selecting the databases 3. Searching for the papers
4. Appraising the hits and selecting the papers 5. Citing the definitions from the papers
[image:2.595.73.281.260.371.2]We made three delimitations: the articles are fetched in databases according to Science and mathematical sciences, and the terms are searched only from the titles of the papers. We have specified our search terms when we planned our research strategies. However, we made three experimental searches. In the first experimental search, three articles were found when the search data-milling (Table 1).
Table 1. Hits for data-milling
Database Hits
IEEE Xplore 0
ACM 0
ScienceDirect (Elsevier) 0
SpringerLink 0
Web of Science – WoS (ISI) 3
When the articles were examined more closely, it was noticed that the titles of articles had been wrongly written into the Web of Science – WoS (ISI) database, the word mining should have been used instead of the word milling.
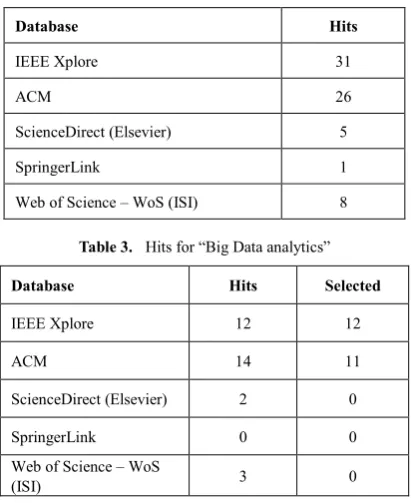
In the second experimental search, we tried to find out definitions for advanced data analytics. However, we did not find any. In the third experimental search, we used the search term Big Data analytics without quotation marks. We got 71 hits (Table 2).
Table 2. Hits for Big Data analytics
Database Hits
IEEE Xplore 31
ACM 26
ScienceDirect (Elsevier) 5
SpringerLink 1
[image:2.595.75.281.507.759.2]Web of Science – WoS (ISI) 8
Table 3. Hits for “Big Data analytics”
Database Hits Selected
IEEE Xplore 12 12
ACM 14 11
ScienceDirect (Elsevier) 2 0
SpringerLink 0 0
Web of Science – WoS
(ISI) 3 0
When we searched “big data analytics” we found 29 articles (Table 3). We appraised the hits and we the desired to select papers only from two databases, ACM and IEEE Xplore ones.
We went through all IEEE Xplore hits [10,11,12,13,14,15,16,17,18,19,20,21]. Two ACM hits referred to the same IEEE article [17]. Contents of two ACM hits are similar, and therefore, we used only one reference [23]. Finally, we went through only 11 ACM hits [22,23,24,25,26,27,28,29,30,31,32]. Main content of one ACM hit [28] is similar to the content of the IEEE article [13]. First, we cited the papers to find out the statements expressing big data analytics. We marked the excluded parts on three dots (. . .) and we commented on direct quotations as an additional clarification in the brackets ({}). We found the following statements (excluding [18,20,31]): 1. “In order to promptly derive insight from big-data, enterprises have to deploy big-data analytics into an extraordinarily scalable delivery platform . . . Our MOBB approach has been designed for data-intensive tasks (e.g., big-data analytics) that typically require special platforms such as MapReduce cluster and especially, can run in parallel” [10]
2. “A big data analytics ecosystem built around MapReduce is emerging alongside the traditional one built around RDBMS” [11]
3. “Across disciplines, big data has been attracting significant attention globally from government funding agencies, academia, and industry. The field of AI is no exception, with its particular emphasis on developing specialized data mining methods to explore big data, among other closely related research topics that can be broadly labeled as analytics“ [12]
4. “Parallel database systems and MapReduce systems (most notably Hadoop) are essential components of today’s infrastructure for Big Data analytics” [13,28]
complex datasets . . . {the second SaaS definition:} provides a well-defined data mining algorithm or ready-to-use knowledge discovery tool as an Internet service to end users, who can access it directly through a Web browser . . . {the third SaaS definition:} A single and complete data mining application or task (including data sources) offered as a service” [14]
6. “Cloud computing makes data analytics an attractive preposition for small and medium organisations that need to process large datasets and perform fast queries” [15]
7. “Big Data analytics is a fast growing and influential practice” [16]
8. “we consider click stream processing (most widely used case of Big Data analytics). In future, predictive models and feature sets can be identified for other Big Data analytics workloads/data sets” [17]
9. “A key part of big data analytics is the need to collect, maintain and analyze enormous amounts of data efficiently. To address these needs, frameworks based on MapReduce are used for processing large data-sets using a cluster of machines” [19]
10. “The need to process and analyze such massive datasets has introduced a new form of data analytics called Big Data Analytics. Big Data analytics involves analyzing large amounts of data of a variety of types to uncover hidden patterns, unknown correlations and other useful information. Many organizations are increasingly using Big Data analytics to get better insights into their businesses, increase their revenue and profitability and gain competitive advantages over rival organizations . . . Big Data analytics platform in today’s world often refers to the Map-Reduce framework . . . Map-Reduce framework provides a programming model using “map” and “reduce” functions over key-value pairs that can be executed in parallel on a large cluster of compute nodes . . . The other key aspect of Big Data analytics is to push the computation near the data. Generally, in a Map-Reduce environment, the compute and storage nodes are the same, i.e. the computational tasks run on the same set of nodes that hold the data required for the computations” [21]
11. “In the age of big data, businesses compete in extracting the most information out of the immense amount of data they acquire. Since more information translates almost directly into better decisions that provide a much sought-after competitive edge, big data analytics tools promising to deliver this additional bit of information are highly-valued. There are two major issues that have to be addressed by any such tool. First, they have to cope with massive amounts of data . . . Second, the tools have to be general and extensible. They have to provide a large spectrum of data analysis methods ranging from simple descriptive statistics to complex predictive models. Moreover, the tools should be easily extensible with new methods without major code development” [22]
12. Many state-of-the-art approaches to both of these challenges {more and more data comes in diverse forms, the proliferation of ever-evolving algorithms to gain
insights from data} are largely statistical and combine rich databases with software driven by statistical analysis and machine learning. Examples include Google’s Knowledge Graph, Apple’s Siri, IBM’s Jeopardy-winning Watson system, and the recommendation systems of Amazon and Netflix. The success of these big-data analytics–driven systems, also known as trained systems, has captured the public imagination, and there is excitement about bringing such capabilities to other applications in enterprises, health care, science, and government” [23]
13. “Big data analytics has become critical for industries and organizations to extract useful information from huge and chaotic data sets to support their core operations in many business and scientific applications. Meanwhile, the computing speed of commodity computers and the capacity of storage systems continue to improve while their unit prices continue to decrease. Nowadays, it is a common practice to deploy a large scale cluster with commodity computers as nodes for big data analytics” [24]
14. “Decision makers of all kinds, from company executives to government agencies to researchers and scientists, would like to base their decisions and actions on this data. In response, a new discipline of big data analytics is forming. Fundamentally, big data analytics is a workflow that distills terabytes of low-value data (e.g., every tweet) down to, in some cases, a single bit of high-value data (Should Company X acquire Company Y? Can we reject the null hypothesis?). The goal is to see the big picture from the minutia of our digital lives . . . The term analytics (including its big data form) is often used broadly to cover any data-driven decision making. Here, we use the term for two groups: corporate analytics teams and academic research scientists. In the corporate world, an analytics team uses their expertise in statistics, data mining, machine learning, and visualization to answer questions that corporate leaders pose. They draw on data from corporate sources (e.g., customer, sales, or product-usage data) called business information, sometimes in combination with data from public sources interactions (e.g. tweets or demographics) . . . In the academic world, research scientists analyze data to test hypotheses and form theories. Though there are undeniable differences with corporate analytics (e.g., scientists typically choose their own research questions, exercise more control over the source data, and report results to knowledgeable peers), the overall analysis workflow is often similar . . . today’s big data analytics is a throwback to an earlier age of mainframe computing . . . as an emerging type of knowledge work” [25]
15. “In order to extract value out of the data, the analysts need to apply a variety of methods {advanced analytical methods} ranging from statistics to machine learning and beyond” [26]
characterized by high volume and speed” [27] 17. “the important aspects of “big data” analytics:
Big: the vast volumes and fast growth of datasets, requiring cost-effective storage (e.g., HDDs) and scalable solutions (e.g., scale-out architetures);
Fast: the need for low-latency data analytics that can keep pace with business decisions;
Total: the trend toward integration and correlation of multiple, potentially heterogeneous, data sources;
Deep: the use of sophisticated analytics algorithms (e.g., machine learning and statistical analysis);
Fresh: the need for near real-time integration as well as analytics on recently generated data.” [29]
18. “Big data analytics is the process of examining large amounts of data (big data) in an effort to uncover hidden patterns or unknown correlations. Big Data Analytics Applications (BDA Apps) are a new type of software applications, which analyze big data using massive parallel processing frameworks (e.g., Hadoop)” [30]
19. “Today’s data explosion, fueled by emerging applications, such as social networking, micro blogs, and the “crowd intelligence” capabilities of many sites, has led to the “big data” phenomenon. It is characterized by increasing volumes of data of disparate types (i.e., structured, semi-structured and unstructured) from sources that generate new data at a high rate (e.g., click streams captured in web server logs). This wealth of data provides numerous new analytic and business intelligence opportunities like fraud detection, customer profiling, and churn and customer loyalty analysis. Consequently, there is tremendous interest in academia and industry to address the challenges in storing, accessing and analyzing this data. Several commercial and open source providers already unleashed a variety of products to support big data storage and processing” [32]
The statements illustrate that big data analytics is ambiguous. However, the following statements can be taken to crystallize it:
– “Big Data analytics involves analyzing large amounts of data of a variety of types to uncover hidden patterns, unknown correlations and other useful information” [21] –“Big data analytics has become critical for industries and organizations to extract useful information from huge and chaotic data sets to support their core operations in many business and scientific applications” [24]
–“big data analytics is a workflow that distills terabytes of low-value data . . . down to, in some cases, a single bit of high-value data . . . The goal is to see the big picture from the minutia of our digital lives” [25]
–“Big data analytics is the process of examining large amounts of data (big data) in an effort to uncover hidden patterns or unknown correlations” [30]
3. Data-milling
The computing world goes towards to the ongoing cycle of data-milling (Figure 1). We get information nuggets, even without will, and our reactions depends on us.
Figure 1. Data-milling.
[image:4.595.344.519.116.331.2]Information nuggets reveal different meanings for laypeople. Even one nugget can make deeper understanding and lead reactions (e.g. does something by her or give assignment) or it is just "nice to know" and does not lead any reaction. It is already fact that not hidden data enables innovations. All depends on what the laypeople invent to do with the information nuggets from heterogeneous data. Furthermore, when the information nuggets are available, it will be more difficult to present the throws and claims without grounds.
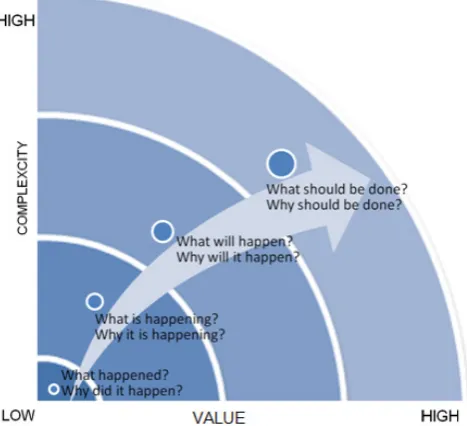
[image:4.595.317.551.478.691.2]However, it is important even for laypeople to understand complexity and possible value of data-milling (Figure 2). The key-questions are derived partly descriptive and inferential analytics and partly from the simple taxonomy of business analytics which is divided into three categories [33]: descriptive analytics uses the data to answer the questions the questions concerning the past and the present, predictive analytics answers the questions concerning the future, and prescriptive analytics answers the questions, what should be done and why.
[image:5.595.314.551.239.414.2]It is important for laypeople to understand that they do not have to understand even complex statistical things (Figure 3). First, we can use descriptive statistics to present some facts based on information nuggets which are categorical or numerical. If it seems to be worth for laypeople to use professionals for inferential statistics, they both have some kind of common sense about "what may be calculated" and "what is worth calculating". There will be no mind in data analytics for laypeople if they do not have basic know-how from the interpretations of the results of the data analyses (i.e. what have be calculated and why). Laypeople may need professionals to do descriptive statistics. However, professionals are used for inferential statistics, as well as, to do data-milling (i.e. assignments are made).
Figure 3. Key-questions for inferential statistics
Nowadays, there are professionals that have deep analytic skills [35]. When they examine Big Data, they have to have, first of all, know-how from algorithms, because data mining is needed and it “is about applying algorithms to data, rather than using data to “train” a machine-learning engine of some sort” [36]. The need for data mining can be crystallized within Hiltunen’s[37] clause “it is possible to analyze all the qualitative data in quantitative form by using text and data mining tools”.
4. Discussion through Coal Power
When we tried to find information nuggets for indicators for investments in the coal power plants in Europe until the year 2020, we realized that we need a lot of data, for example, from social media, TV, news, and politics. First of
all, there are a lot of potential indicators [38,39], not to mention, there is a vast amount of data that is not used in analytics or as a data source for indicators. Such data could contain vital information about organizations (e.g. products, processes, customers, competitors, and partners), and market trends. We started to talk about data-milling for providing information nuggets for indicators instead of unfamiliar big data analytics.
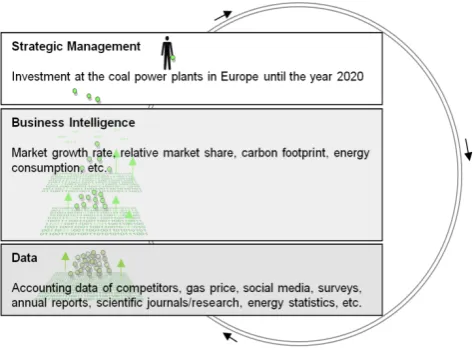
We illustrated data-milling implicitly by business intelligence and strategic management for better competitive advantage (Figure 4). Actually, the business intelligence layer contains, for example, both descriptive statistics and inferential statistics.
Figure 4. Data-milling is a part of competitive advantage
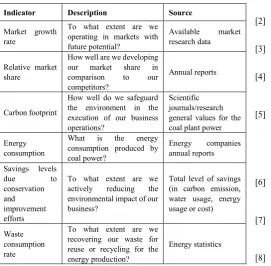
There are miscellaneous data sources in Figure 4. Furthermore, there are even miscellaneous indicators (Table 4) adapted from Marr[40] and those are selected especially for our example case. The indicator called market growth rate shows if the market is growing or shrinking. This is a good indicator for predicting the future. The indicator called relative market share shows how well we are developing our market share compared with our competitors. The indicator called carbon footprint is used to sum the direct emission of the greenhouse gases from the burning of fossil fuels for energy consumption and transportation. Furthermore, this indicator effects directly to the politics and the politics has effects against or favor investment decision for coal power plants. The indicator called energy consumption explains coal power’s market share of the energy market. The indicator called savings levels due to conservation and improvement efforts is one of the important technological challenges for the coal power plants and indirectly for the investment decisions. The indicator called waste consumption rate is a favorite indicator for the investment decision. It measures the coal power plant.
[image:5.595.69.291.378.521.2]patterns, unknown correlations and other useful information. Table 4. Indicators for investments in the coal power plan
Indicator Description Source
Market growth rate
To what extent are we operating in markets with future potential?
Available market research data
Relative market share
How well are we developing our market share in comparison to our competitors?
Annual reports
Carbon footprint
How well do we safeguard the environment in the execution of our business operations?
Scientific journals/research general values for the coal plant power Energy
consumption
What is the energy consumption produced by coal power?
Energy companies annual reports
Savings levels due to conservation
and improvement efforts
To what extent are we actively reducing the environmental impact of our business?
Total level of savings (in carbon emission, water usage, energy usage or cost)
Waste consumption rate
To what extent are we recovering our waste for reuse or recycling for the energy production?
Energy statistics
5. Conclusion
There are a lot of heterogeneous data and it might be openly available. For example, public sector, mainly at the governmental level (e.g. the United States and Britain), has been made data available for free for anyone to use – the “openness of data means in practice that data has been made as easy as possible for anyone to use” [41].
In this article, we launched the term data-milling to represent the searching of the information nuggets from the heterogeneous data. To justify the launched term data-milling, we made the literature review in which we searched the definitions of Big Data analytics. Our review showed that Big Data analytics is verbosely explained. We used only four statements from 19 to crystallize Big Data analytics.
Our research strategy was partly descriptive and partly improving. Our literature review of Big Data analytics gave the description of current status of the phenomenon Big Data. The launched term data-milling improves the understanding of the phenomenon Big Data, as well as, possibilities of data analytics. However, explanatory research strategy and exploratory research strategy illustrate the reason for data-milling appositely, i.e. seek an explanation for a situation or a problem, try to find out what is happening, seeks new insights and generates new ideas and hypotheses for future research [42].
REFERENCES
[1] D.E. O’Leary. Artificial Intelligence and Big Data. IEEE Computer Society, 96-99, 2013.
[2] S. Chaudhuri.How Different id Big Data? IEEE 28th
International Conference on Data Engineering, 5, 2012.
[3] H. Topi. Where is Big Data in Your Information Systems
Curriculum? acmInroads, Vol. 4. No.1, 12-13, 2013. [4] IBM, Big Data at the Speed of Business, What is big data,
Online available from http://www-01.ibm.com/software/data /bigdata/
[5] S. Alsubaiee, Y. Altowim, H. Altwaijry, A. Behm, V. Borkar, Y. Bu, M. Carey, R. Grover, Z. Heilbron, Y.-S. Kim, C. Li, N. Onose, P. Pirzadeh, R. Vernica, J. Wen. ASTERIX: An Open Source System for “Big Data” Management and Analysis (Demo). Proceedings of the VLDB Endowment, Vol 5, No. 12, 1898-1901, 2012.
[6] C. Okoli, K. Schabram. A Guide to Conducting a Systematic Literature Review of Information Systems Research. Sprouts: Working Papers on Information Systems, 2010.
[7] B. Kitchenham, S. Charters. Guidelines for performing
Systematic Literature Reviews in Software Engineering. EBSE Technical Report EBSE-2007-01, 2007.
[8] Merriam-Webster. Online available from http://www.merria mwebster.com/dictionary/definition
[9] H. Suonuuti. Guide to Terminology, 2nd edition ed.
Tekniikan sanastokeskus ry, Helsinki, 2001.
[10] G. Jung, N. Gnanasambandam, T. Mukherjee. Synchronous
Parallel Processing of Big-Data analytics Services to Optimize Performance in Federated Clouds. IEEE 5th International Conference on Cloud Computing (CLOUD), 811-818, 2012.
[11] X. Qin, H. Wang, F. Li, B. Zhou, Y. Cao, C. Li, H. Chen, X. Zhou, X. Du,, S. Wang. Beyond Simple Integration of RDBMS and MapReduce -- Paving the Way toward a Unified System for Big Data analytics: Vision and Progress. Second International Conference on Cloud and Green Computing (CGC), 716-725, 2012.
[12] D. Zeng, R. Lusch. Big Data Analytics: Perspective Shifting from Transactions to Ecosystems. Intelligent Systems, IEEE, Volume 28, Issue 2, 2-5, 2013.
[13] A. Aboulnaga, S. Babu. Workload management for Big Data analytics. IEEE 29th International Conference on Data Engineering (ICDE), 1249, 2013.
[14] D. Talia. Clouds for Scalable Big Data Analytics. Computer, Volume 46, Issue 5, 98-101, 2013.
[15] A. Nazir, Y.M. Yassin, C.P. Kit, E.K. Karuppiah. Evaluation of virtual machine scalability on distributed multi/many-core processors for big data analytics. IEEE Conference on Open Systems (ICOS), 1-6, 2012.
[16] S. Singh, N. Singh. Big Data analytics. International
Conference on Communication, Information & Computing Technology (ICCICT), 1-4, 2012.
International Conference for High Performance Computing, Networking, Storage and Analysis (SC), 11 pages, 2012. [18] Y. Simmhan, V. Prasanna, S. Aman, A. Kumbhare, R. Liu, S.
Stevens, Q. Zhao. Cloud-Based Software Platform For Big Data Analytics In Smart Grids. Accepted for publication in Computing in Science & Engineering, IEEE, 2013.
[19] N. Laptev, K. Zeng, C. Zaniolo. Very fast estimation for result and accuracy of big data analytics: The EARL system. IEEE 29th International Conference on Data Engineering (ICDE), 1296-1299, 2013.
[20] G. Sijie, X. Jin, W. Weiping, L. Rubao. Mastiff: A
MapReduce-based System for Time-Based Big Data Analytics. IEEE International Conference on Cluster Computing (CLUSTER), 72-80, 2012.
[21] A. Mukherjee, J. Datta, R. Jorapur, R. Singhvi, S. Haloi, W. Akram. Shared disk big data analytics with Apache Hadoop. 19th International Conference on High Performance Computing (HiPC), 2012.
[22] C. Qin, F. Rusu. Scalable I/O-bound parallel incremental gradient descent for big data analytics in GLADE. DanaC '13: Proceedings of the Second Workshop on Data Analytics in the Cloud, 16-20, 2013.
[23] A. Kumar, F. Niu, C. Ré. Hazy: Making It Easier to Build and Maintain Big-Data Analytics. acmqueue-magazine - Web Development, Volume 11, Issue 1, 1-17, January 2013. Communications of the ACM , Volume 56, Issue 3, 40-49, 2013.
[24] Y. Huai, R. Lee, S. Zhang, C.H. Xia, X. Zhang. DOT: A
Matrix Model for Analyzing, Optimizing and Deploying Software for Big Data Analytics in Distributed Systems. SOCC '11: Proceedings of the 2nd ACM Symposium on Cloud Computing, 14 pages, 2011.
[25] D. Fisher, R. DeLine, M. Czerwinski, S. Drucker. Interactions with big data analytics. interactions, Volume 19 Issue 3, 2012. [26] Y. Cheng, C. Qin, F. Rusu. GLADE: big data analytics made easy. SIGMOD '12: Proceedings of the 2012 ACM SIGMOD International Conference on Management of Data, 697-700, 2012.
[27] R. Bhatti, R. LaSalle, R. Bird, T. Grance, E. Bertino. Emerging trends around big data analytics and security: panel. SACMAT '12: Proceedings of the 17th ACM symposium on Access Control Models and Technologie, 67-68, 2012. [28] A. Aboulnaga, S. Babu. Workload management for Big Data
analytics. SIGMOD '13: Proceedings of the 2013 international conference on Management of data, 929-931, 2013.
[29] J. Chang, K.T. Lim, J. Byrne, L. Ramirez, P. Ranganathan. Workload diversity and dynamics in big data analytics: implications to system designers. ASBD '12: Proceedings of the 2nd Workshop on Architectures and Systems for Big Data, 21-26, 2012.
[30] W. Shang, Z.M. Jiang, H. Hemmati, B. Adams, A.E. Hassan, P. Martin. Assisting developers of big data analytics applications when deploying on hadoop clouds. ICSE '13: Proceedings of the 2013 International Conference on Software Engineering, 402-411, 2013.
[31] A. Bhambhri. Six tips for students interested in big data analytics. XRDS: Crossroads, The ACM Magazine for Students, Volume 19, Issue 1, 9, 2012. (19.)
[32] A. Ghazal, T. Rabl, M. Hu, F. Raab, M. Poess, A. Crolotte, H.-A. Jacobsen. BigBench: towards an industry standard benchmark for big data analytics. SIGMOD '13: Proceedings of the 2013 international conference on Management of data, 1197-1208, 2013.
[33] D. Delen, H. Demirkan. Data, information and analytics as services. Decision Support Systems, 55, 359-363, 2013. [34] W. Eckerson. Predictive Analytics Extending the Value of
Your Data Warehousing Investment, First quarter 2007 TDWI best practices report, 2007.
[35] McKinsey & Company. Big data: The next frontier for competition. Online available from http://www.mckinsey.co m/features/big_data
[36] A. Rajaraman, J. Leskovec, J. D. Ullman. Mining of Massive Datasets. 2013. Online available from http://i.stanford.edu/~ ullman/mmds/book.pdf
[37] E. Hiltunen. Weak Signals in Organizational Futures. Aalto University, 2012.
[38] R. Baroudi, KPI Mega Library: 17,000 Key Performance
Indicators. 2010.
[39] European Commission, Europe 2020 indicators, Headline
indicators Online available from http://epp.eurostat.ec.europ a.eu/portal/page/portal/europe_2020_indicators/headline_ind icators
[40] B. Marr, Key Performance Indicators, The 75 measures every manager needs to know. Pearson education limited, 2012 [41] Helsinki region infoshare, Open data. Online available from
http://www.hri.fi/en/about/open-data/