Factors Affecting the Relationship between Research
and Development (R&D) and Economic
Development in EU
Lyroni Athina, Anastasiou Athanasios*, Liargovas Panagiotis, Dermatis Zacharias, Komninos Dimitrios
Department of Economic Studies, University of Peloponnese, Greece
Copyright©2018 by authors, all rights reserved. Authors agree that this article remains permanently open access under the terms of the Creative Commons Attribution License 4.0 International License
Abstract
This paper explores the relation between R&D and economic growth using data from the EU-28 countries for the period 2001-2014. We consider panel data econometric techniques and control variables commonly used in the literature are analyzed together with a number of other variables to which existing studies often give little attention. Our results suggest that R&D expenditure and the patents (European Patent Office – EPO) have a positive and significant effect on economic growth for all countries.Keywords
R&D Expenditure, Economic Growth, EU, Innovation, Patents1. Introduction
Investing in research and innovation is very important for economic progress and prosperity, especially for modern developed societies, where technology plays a key role in people's everyday lives. It has been documented by numerous studies that technological progress and innovation have a major impact on productivity and growth. According to the study by Grossman & Helpman [1], improvements in technology are the best option to overcome the limits of growth.
Over the last few decades, the global economy has gradually become a knowledge-intensive economy. Larger economies invest a significant and growing proportion of their annual Gross Domestic Product (GDP) in Research and Development (R&D), innovation and education. In today's globalized economy, Research & Development is a key component behind technological and economic growth.
The economic crisis experienced by the world economy has prompted the European Union to shift its development policy and, in particular, recognize the pressing need for
investing in research and innovation. Europe has recognized the high importance of the aforementioned factors in promoting the competitiveness of the European economy and achieving long-term sustainable growth and has set ambitious targets in terms of R & D spending and education. However, there are big differences between the European Union's Member States in terms of technology and the effort made to advance it. European countries that are investing more in R & D and technology over the years seem to have significant economic benefits and higher competitiveness. Greece belongs to the countries of Europe that innovate with moderate performance. R & D spending has increased over time but remains low as a% of GDP relative to other European countries.
A prerequisite is not only for maintaining a competitive market position in a business, but also for gaining a competitive advantage in a fast and evolving environment. For this reason, the European Union has set a key objective within the overall framework of the Europe 2020 strategy, to increase R & D expenditure to 3% of GDP. R & D spending as a factor in the growth of an economy expresses the effort of a country to generate knowledge, to disseminate it and, of course, to exploit it economically.
Research and innovation contribute to improving living and working conditions in Europe. They boost growth and create new jobs. At the same time, research and innovation make life for European citizens better by improving healthcare, transport and digital services and creating innumerable new products and services.
R & D plays a significant role in business innovation results, and R & D investment is therefore one of the most powerful mechanisms for determining the level of innovation in a single country or sector.
capita GDP of each of the EU countries. For our econometric analysis, panel data for the period 2001 - 2014 was used. The source of the data is Eurostat and data are available for all 28 EU countries.
2. Literature Review
2.1. Research and Development
According to the Organization for Economic Co-operation and Development [2], research and development refers to "creative work done on a systematic basis to increase the knowledge pool, including the knowledge referred to in people, culture and society, and the use of this knowledge pool to devise new applications."
According to the OECD definition [2], Research and Development covers three activities: basic research, applied research and experimental development.
Basic research is experimental or theoretical work done with the main purpose of acquiring new knowledge about the fundamental characteristics of phenomena and observable events without aiming at specific application or use.
Applied research is a process leading to new products, new technologies, and patents. It has a specific practical purpose or goal.
Experimental research is the systematic work that is based on existing knowledge in the direction of the production of new materials and products, as well as in the improvement of existing production processes, systems and services.
According to the European Council (Lisbon Summit, 2000), "... the strategic objective is to make Europe the most competitive and dynamic economy in the world based on knowledge, the ability to maintain high growth rates with more and better jobs and greater social cohesion…". It is generally accepted that research, high technology and innovation are the determinants of gradual economic growth, with an increase in productivity, competitiveness and outward-looking economy. To do all this, investing in research and development must be a long-term strategy. According to the conclusions of the Voutsinas & Tsamadias [3] study, the productivity of the Greek economy can increase significantly if R & D expenditure is increased and at the same time institutional restructuring is carried out in order to improve the effectiveness of research and diffusion faster innovation.
Technology and innovation clearly contribute to economic progress and, for this reason; the adoption of technological innovation affects the development of the economy to a large extent. According to P. Drucker [4], "technological research leads to innovation, which is a
planned effort of the man who, with the use of technology, aims to change his life and his environment, that is, the economy and society. An equally important study by OECD [5] concluded that a systemic approach to targeting political practices is always necessary in relation to entrepreneurship and innovation, as government policy practices.
2.2. Linking Research and Development, Innovation and Economic Growth
Many are trying to shed light on the role played by R & D by various actors, the creation of production and the impact that it naturally has on economic development. Romer [6] highlighted the relationship between investment in technology, R & D spending and productivity gains. Investing in Research and Development increases the likelihood of a high level of technology from both businesses and regions, resulting in higher income and greater growth.
C. Geffen et al. [7] emphasize the effectiveness of the "transfer" of innovations from the laboratories to the market, i.e. the collaboration between the R & D and marketing departments. Success, that is, innovation, depends on linking the idea to a new product with the potential market objective.
An important research by OECD showed that knowledge is a cornerstone of economic processes. Essentially in the knowledge-intensive economy, innovation holds a prominent position, and it is confirmed that at a macro level it is a dominant factor for national economic development, while at micro level it increases the ability of enterprises to absorb and exploit all kinds of new knowledge.
A number of investigations have been carried out investigating the relationship between R & D expenditure and the extent to which it contributes to the economic development of the countries. One of these is Santos & Cataloe-Lopes [8], who are investigating this relationship in a sample of EU countries with particular emphasis on Portugal. The paradox with Portugal lies in the fact that while R & D spending grew, there was no corresponding increase in its economic growth rate (which was not the case for the rest of the sample countries). To investigate this relationship, therefore, annual data on expenditure on R & D and GDP (22 observations) was received from OECD for the period 1987-2008.
investment (in this survey there was no segmentation of spending). A typical example is the case of Portugal, as already mentioned. In addition, rising economic growth does not seem to lead to an increase in R & D spending, which is positive for low-GDP countries.
In their research, Rodriguez-Pose & Bilbao-Osorio [9] examines whether spending on R & D (private, governmental and tertiary) produces different effects on innovation and economic growth in peripheral and non-peripheral regions of the EU by the linear regression method. In non-peripheral areas, spending through the private sector is substantial and leads to growth and innovation, while in the outermost regions, apart from the private sector, spending in the higher education sector also plays an important role.
The main purpose of the research by Yasar Akcali and Sismanoglu [10] is to investigate the relationship between R & D and economic development in developed and developing countries. They examined R & D expenditure (expressed in euro per capita) for 19 countries (developed and developing) for the period 1990 - 2013, with data recovered by Eurostat. The sample of these countries was selected on the basis of the availability of satisfactory data for these countries. The countries they chose were: Austria, Belgium, Bulgaria, Czech Republic, Denmark, Finland, France, Germany, Hungary, Iceland, Italy, Japan, Netherlands, Poland, Portugal, Spain, Turkey, England, USA.
In order to verify their proposals, they used a panel data analysis, where per capita expenditures were the independent variable and per capita GNP dependent (GDP per capita). After analyzing the data clearly, there was a positive relationship between R & D expenditure and the rate of economic growth in each country. It has been observed that an increase of 1% in R & D spending in developed countries such as England, France and the Netherlands leads to a rise of 1% in economic growth. In contrast, in developing countries such as Portugal, Iceland, Austria, an increase of 1% of R & D expenditure has been observed to rise only between 0.3-0.4 percent.
In the same direction, the Gumus & Celikay [11] article discusses the relationship between R & D expenditure and economic growth, and whether this relationship varies according to the degree of development in each country. Based on this survey, they will assess the short-term and long-term effects of R & D on economic growth. For this study data from 52 countries were used, of which 32 were considered to be developed and the other 20 developed for
the period 1996-2010. Data were recovered from World Bank, World Development (WDI), UNICEF and EUROSTAT. The panel data analysis was used to draw conclusions.
Gene et al. [12] investigated 34 countries, analyzing the annual data from 1997 to 2008, analyzing the relationship between R & D expenditure and economic growth, and concluded that there was a clear causal link. In the same direction, the research by Ozcan et al. [11], which examined 15 OECD countries, through panel analysis for the period 1990-2011, and found that R & D expenditure positively affects the economic development of these countries. In contrast, Lucas [13] examines through multiple regressions 20 OECD countries and found that there was a real relationship between spending on R & D and economic growth only for the G-7 countries. The rest of the countries have not found a real relationship.
Ozcan et.al [14] felt that investing in R & D is one of the most important tools for a country to grow. To this end, 34 OECD countries studied (different in population) for the period 1981-2010 in order to find out whether there is a correlation between GDP and a number of scientific publications as well as patents. Concluding, they concluded that there was clearly a positive correlation between them and countries like Sweden, Finland and Germany showed a great picture over the rest.
3. Analysis of Data
3.1. Quantitative Data on R & D Expenses in EU Countries
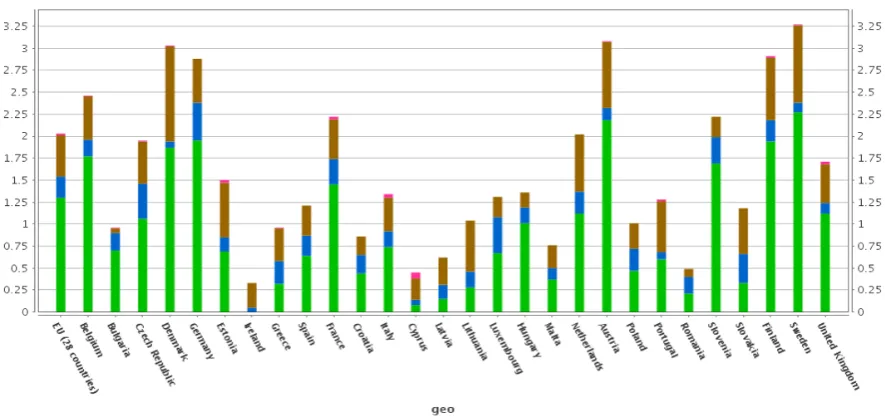
Figure 1. R & D expenditure, 2015. Source Eurostat
In the diagram above, based on the most recent Eurostat data, we can see for each EU country. (EU 28) total expenditure for R & D (as a% of GDP) for the year 2015:
Specifically, Sweden is in the top position with 3.25% and Austria in the second place with 3.07% respectively. Denmark ranks third with 3.03%. Unlike the following countries, Greece is in the last positions with 0.96%. The countries of northern Europe have high R & D investment rates, while many Southeast European countries have the lowest rates. Performance in our country is low. We find that the rate of investment in R & D is consistent with the country's economic growth. Based on available Eurostat data, few countries have achieved the 3% R & D investment target. This may also be due to the ongoing economic crisis that discourages many countries from investing in R & D.
3.2. R & D expenditure by Business, Public Sector, Higher Education, and Private Non-Profit Businesses sector in the countries of the European Union
[image:4.595.93.508.77.305.2]Based on the most recent Eurostat data, the chart below shows for each EU country (EU 28) spending on R & D (as% of GDP) by funding area for 2015:
[image:4.595.76.519.505.713.2]In the above diagram, we see that in the European Union, the business sector was the largest in terms of spending on research and development in 2015. This is followed by the higher education sector, the government sector, and the private non-profit institutions sector.
According to Eurostat, Greece is in a very low position compared to other European countries. For 2015, R & D spending on Greece was 0.96% (Figure 3). Our country spends far less money than most of its partners and is ranked in the last EU countries, namely 23rd among the member countries.
Figure 3. R & D expenditure on % of GDP, 2015. Source Eurostat.
4. Presentation of Data
This paper is designed to examine whether public expenditure on R & D (GO2), private R & D expenditure (BUS2), R & D expenditure in higher education (EDUC2), the number of patents filed with the European Patent Office (PATENTS) and the crisis (DCRISIS) affect the per capita GDP of each of the EU countries. (EU28).
We report that the time period for which we have received data (panel data) is from 2001 to 2014. The source of the data is Eurostat and the data refer to the 28 EU countries. Therefore, our model is as follows:
Yit = bο+ b1X1it + b2X2it + ……+ b5X5it + Uit , Where,
Yit is the natural GDP per capita algorithm in country i for year t,
X1it are the expenses of the private sector of R & D in country i for year t (BUS2),
X2it are public R & D expenditure in country i for year t (GO2),
X3it are the costs of higher education in R & D in country i for year t (EDUC2),
X4it is the number of patents (the European Patent Office) in country i for year t (EDUC2),
X5it is the mismatch of the crisis and
Uit = mt + ei + ci, with μt being equal to the fixed term that changes over time in order to take into account the
[image:5.595.73.525.155.402.2]fixed diachronic effects, those factors that affect the dependent variable and change over time but not stratified, is a random term that varies across-layer in order to take account of the random transversal effects, ie factors that affect the dependent variable and vary across but not over time and γi is the non-observed variable / hetero remains not varied over time for i = 1,2, ... .N.
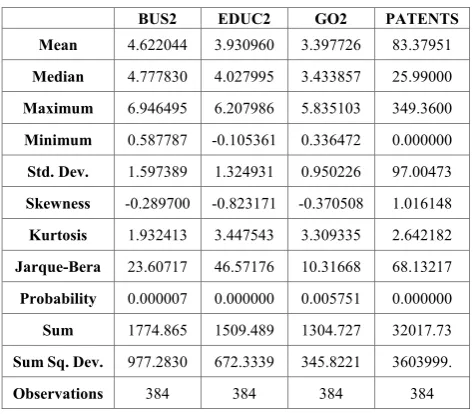
Table 1. Descriptive Statistics of Variables X, (author's editing)
BUS2 EDUC2 GO2 PATENTS
Mean 4.622044 3.930960 3.397726 83.37951
Median 4.777830 4.027995 3.433857 25.99000
Maximum 6.946495 6.207986 5.835103 349.3600
Minimum 0.587787 -0.105361 0.336472 0.000000
Std. Dev. 1.597389 1.324931 0.950226 97.00473
Skewness -0.289700 -0.823171 -0.370508 1.016148
Kurtosis 1.932413 3.447543 3.309335 2.642182
Jarque-Bera 23.60717 46.57176 10.31668 68.13217
Probability 0.000007 0.000000 0.005751 0.000000
Sum 1774.865 1509.489 1304.727 32017.73
Sum Sq. Dev. 977.2830 672.3339 345.8221 3603999.
[image:5.595.303.540.536.743.2]4.1. Data Description
The following table lists the most significant descriptive statistics of the independent variables used. Table 1 shows the number of observations, the average, the standard deviation, and the minimum and maximum values.
Observing the table below, we conclude that there is a linear correlation quite significant between the pair.
At this point, let us not forget that the remnants are homogeneous; they follow the normal distribution and do not show autocorrelation.
Table 2. Correlation of the independent variables BUS2, EDUC2, GO2,
PATENTS, (author's editing) Correlation Matrix
BUS2 EDUC2 GO2 PATENTS
BUS2 1 0.864650 0.813603 0.818348
EDU2 1 0.713888 0.703718
GO2 1 0.693100
PATENTS 1
5. Methodology
In the present study, eight (8) Reinstates - Linear Models with the Minimum Quadratic Method were performed. This method is used as a means of finding the estimators of the coefficients of the model. According to this method, we look for a line that minimizes the sum of squares of residues. Through the E VIEWS econometric program 7, all Dependent Variable GDP and Independent Variables Private R & D Expenditure (BUS2), Public Expenditure on
R & D (GO2), Higher Expenditure Expenditures (GO2), Higher Education Expenditures R & D (EDUC2) and the Number of Patents filed with the European Patent Office (EPO) (PATENTS). Also, the Fault Vulnerability (DCRISIS) was also used.
First of all, the results are estimated using the OLS, ignoring the dimensions of time and space. Subsequently, the corresponding regression according to the Fixed Effect Model and to the Random Effect Model is evaluated. Checks are carried out, such as the Hausman test, and the conclusion is drawn to apply the most appropriate model.
At each stage, the natural GDP per capita algorithm represents the dependent variable while the other variables are used as independent regression variables. In each regression estimate performed using the Least Squares method, some basic assumptions are necessary. The credibility of the results derived from the assessment of a model depends to a large extent on how well the original assumptions of the model are met. We believe that these assumptions are fully respected in our regressions.
Then, after the assessment of each regression with the Least Squares, we evaluate the model using the Fixed Effect method and then the Random Effect method. To decide which model to use, we will control Hausman. The assumptions made are as follows:
Ηο ( zero hypothesis): considers that the preferred model is that of random effects, while
Η1 (alternative hypothesis): considers that the preferred model is that of fixed effects.
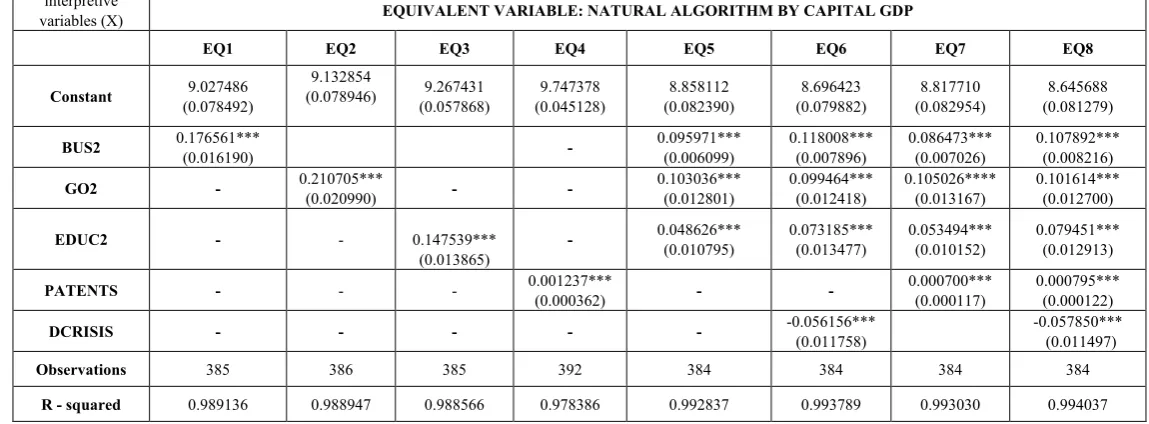
Table 3. Linear Regressions 1-8), (author's editing) interpretive
variables (Χ) EQUIVALENT VARIABLE: NATURAL ALGORITHM BY CAPITAL GDP
EQ1 EQ2 EQ3 EQ4 EQ5 EQ6 EQ7 EQ8
Constant (0.078492) 9.027486 (0.078946) 9.132854 (0.057868)9.267431 (0.045128) 9.747378 (0.082390) 8.858112 (0.079882) 8.696423 (0.082954) 8.817710 (0.081279) 8.645688
BUS2 0.176561*** (0.016190) - 0.095971*** (0.006099) 0.118008*** (0.007896) 0.086473*** (0.007026) 0.107892*** (0.008216)
GO2 - 0.210705*** (0.020990) - - 0.103036*** (0.012801) 0.099464*** (0.012418) 0.105026**** (0.013167) 0.101614*** (0.012700)
EDUC2 - - 0.147539***
(0.013865) -
0.048626***
(0.010795) 0.073185*** (0.013477) 0.053494*** (0.010152) 0.079451*** (0.012913)
PATENTS - - - 0.001237*** (0.000362) - - 0.000700*** (0.000117) 0.000795*** (0.000122)
DCRISIS - - - - - -0.056156*** (0.011758) -0.057850*** (0.011497)
Observations 385 386 385 392 384 384 384 384
R -squared 0.989136 0.988947 0.988566 0.978386 0.992837 0.993789 0.993030 0.994037
EQ1
In this regression, our dependent variable is the natural algorithm of GDP per capita and the independent variable is the R & D private expenditure of countries. After the Hausman test, Fixed Effects was selected as an appropriate model.
It is noted that estimates have signs that are consistent with economic theory. The rate of private expenditure is positive, which is clearly confirmed by our bibliographic review. It is then observed that the p-value of the independent variable is statistically significant because p-value = 0.000, which is less than 0.05. The R2 (R-squared) determinant is 0.989136, which implies that the model interprets a very good percentage, about 98.91% of the variability of our data. Therefore, the regression function of the model derived from the Fixed Effects model is as follows: GDP = 9.027486 + 0.176561 BU2+ Uit
EQ2
In this regression, our dependent variable is the natural algorithm of per capita GDP and the independent variable is the R & D public expenditure of countries. After the Hausman test, Fixed Effects was selected as an appropriate model.
It is noted that estimates have signs that are consistent with economic theory. The coefficient of the public expenditure price is positive and this means that it has a positive impact on GDP per capita. It is then observed that the p value of the independent variable is statistically significant because p-value = 0.000 (level of statistical significance 99%), which is less than 0.05. The R2 (R-squared) determinant is 0.988947, which implies that the model interprets a very good percentage, about 98.89% of the variability of our data. Therefore, the regression function of the model derived from the Fixed Effects model is as follows: GDP = 9.132854 + 0.210705 GO2 + Uit
EQ3
Here our dependent variable is the natural GDP per capita algorithm and the independent variable is the R & D spending of countries in higher education. After the Hausman test, Fixed Effects was selected as an appropriate model.
It is noted that estimates have signs that are consistent with economic theory. The coefficient of the cost of higher education spending also has a positive sign and this means that it has a positive impact on GDP per capita. It is then observed that the p-value of the independent variable is statistically significant because p-value = 0.000 (99% statistical significance level), which is less than 0.05. The R2 (R-squared) determinant is 0.988566, which implies that the model interprets a very good percentage, about 98.85% of the variability of our data. Therefore, the regression function of the model resulting from the Stable
Effects Method (Fixed Effects) is formed as follows: GDP = 9.267431 + 0.147539 EDUC2 + Uit
EQ4
In this regression, our dependent variable is the natural algorithm of per capita GDP and the independent variable the number of patents of each country deposited with the European Patent Office. After the Hausman test, the Fixed Effects model was selected as an appropriate model (Fixed Effects).
It is noted that estimates have signs that are consistent with economic theory. The coefficient of the patent price has a positive sign, which is clearly confirmed by our bibliographic review. It is then observed that the p value of the independent variable is statistically significant because p-value = 0.000 (level of statistical significance 99%), which is less than 0.05. The R2 (R-squared) determinant is 0.978386, which implies that the model interprets a very good percentage, about 97.83% of the variability of our data. Therefore, the regression function of the model resulting from the Fixed Effects Method is formed as follows: GDP = 9.747378 + 0.001237 PATENTS+ Uit
EQ5
In this regression, our dependent variable is the natural GDP per capita algorithm and the independent variables, private R & D expenditure, R & D public spending and higher R & D expenditure. After the Hausman test, the Fixed Effects model was selected as an appropriate model (Fixed Effects).
It is noted that estimates have signs that are consistent with economic theory. The coefficients of the values of the respective variables show a positive sign and this means that they have a positive influence on the per capita GDP. It is then observed that in each case the independent variables are statistically significant, since p-value = 0.000 (level of statistical significance 99%), which is less than 0.05. The R2 (R-squared) determinant is 0.992837, which implies that the model interprets a very good percentage, about 99.28% of the variability of our data. Therefore, the regression function of the model resulting from the Fixed Effects Method is formed as follows: GDP = 8.858112+ 0.095971 BUS2 + 0.103036 GO2+ 0.048626 EDUC2+ Uit
EQ6
Here our dependent variable is the natural GDP per capita algorithm and the independent variables, private R & D expenditure, R & D public spending and higher R & D expenditure. Crisis mismatch (DCRISIS) has also been used. After the Hausman test, the Fixed Effects model was selected as an appropriate model (Fixed Effects).
respective independent variables show a positive sign and this means that they have a positive influence on the per capita GDP. The coefficient of the dummy variable shows a negative value, which shows us the negative impact of the crisis on the per capita GDP. It is then observed that in each case the independent variables are statistically significant, since p-value = 0.000 (level of statistical significance 99%), which is less than 0.05. The R2 (R-squared) determinant is 0.993789, which implies that the model interprets a very good percentage, about 99.37% of the variability of our data. Therefore, the regression function of the model resulting from the Fixed Effects Method is formed as follows: GDP = 8.696423 + 0.118008 BUS2 + 0.099464 GO2+ 0.073185 EDUC2-0.056156 DCRISIS+ Uit
EQ7
In this regression, our dependent variable is the natural algorithm of GDP per capita and the independent variables, private R & D expenditure, R & D public spending, R & D expenditure and the number of its patents of each country deposited with the European Patent Office. After the Hausman test, the Fixed Effects model was selected as an appropriate model (Fixed Effects).
It is noted that estimates have signs that are consistent with economic theory. The coefficients of the values of the respective variables show a positive sign and this means that they have a positive influence on the per capita GDP. It is then observed that in each case the independent variables are statistically significant, since p-value = 0.000 (level of statistical significance 99%), which is less than 0.05. The R2 (R-squared) determinant is 0.993030, which implies that the model interprets a very good percentage, about 99.30% of the variability of our data. Therefore, the regression function of the model resulting from the Fixed Effects Method is formed as follows:
GDP = 8.817710+ 0.086473 BUS2 + 0.105026 GO2+ 0.053494 EDUC2+0.000700 PATENTS + Uit
EQ8
Here our dependent variable is the natural algorithm of per capita GDP and the independent variables, private R & D expenditure, R & D public spending, R & D spending, and the number of patents in each country filed with the European Patent Office. The Crisis Judgment (DCRISIS) has also been used. After the Hausman test, the Fixed Effects model was selected as an appropriate model (Fixed Effects).
It is noted that estimates have signs that are consistent with economic theory. The coefficients of the values of the respective independent variables show a positive sign and this means that they have a positive influence on the per capita GDP. The coefficient of the dummy variable shows a negative value, which shows us the negative impact of the crisis on the per capita GDP. It is then observed that in each
case the independent variables are statistically significant, since p-value = 0.000 (level of statistical significance 99%), which is less than 0.05. The R2 (R-squared) determinant is 0.994037, which implies that the model interprets a very good percentage, about 99.40% of the variability of our data. Therefore, the regression function of the model resulting from the Fixed Effects Method is formed as follows: GDP = 8.645688 + 0.107892 BUS2 + 0.101614 GO2 + 0.079451 EDUC2+ 0.000795 PATENTS -0.057850 DCRISIS+ Uit
6. Conclusions
In all the regressions we ran our independent variables were statistically significant (at a statistical significance level of 99%). This means that private R & D spending, public R & D expenditure, R & D spending and number of patents positively affect the per capita GDP of the countries. It should be noted that the application of the dummy variable (DCRISIS) to all the regressions that took place in this study was deemed necessary in order to have some insight into the situation of the EU Member States before and after the financial crisis. Its values were statistically significant and its negative (99% significance).
Research and development departments are important pieces of a business strategy and usually the amounts invested in them are very important. The expected contribution of R & D expenditure to productivity growth and then to Gross National Product has been documented on the basis of international bibliography and recent empirical studies on the Greek economy.
We have concluded that the most appropriate model, to explain the above relationship, is that of Fixed Effects. All independent variables appeared to be statistically significant at a 99% confidence interval. This means that private R & D spending, public R & D expenditure, R & D spending and number of patents positively affect the per capita GDP of the countries. The implementation of the dummy variable (DCRISIS) in all the regressions that took place in this study was deemed necessary to have some insight into the situation of the EU Member States before and after the financial crisis. Its values were statistically significant and the effect of the negative (at a statistical significance level of 99%).
Taking into account the benefits a country can derive from R & D investment, the European Union has set itself the objective of increasing R & D expenditure to around 3% of GDP for each member country. This increase in expenditure concerns both the public and the private sector. The state of research and innovation in Greece in the context of the operation and development of innovation has many weaknesses and needs many improvements.
and the Netherlands leads to a rise of 1% in economic growth. In contrast, in developing countries such as Portugal, Iceland, Austria, an increase of 1% of R & D expenditure has been observed to rise only between 0.3-0.4%.
To conclude, the relationship between R & D expenditure and economic growth needs to be built in the long run in order to have a positive correlation. Survey results have shown that increasing the amount spent on R & D does not necessarily lead to economic growth. Clearly, there is a very important role on the way this money is invested, and on the other hand, whether it is private or government expenditure/ investment (in this survey there was no segmentation of spending). A typical example is the case of Portugal, as already mentioned. In addition, rising economic growth does not seem to lead to an increase in R & D spending, which is positive for low-GDP countries.
REFERENCES
[1] Grossman, G.M., Helpman, E. (1994), Endogenous Innovation in the theory of growth, Journal of Economic
Perspectives, 8, 23-44
[2] OECD, Proposed Standard Practice for Surveys of Research and Experimental Development: Frascati Manual 2002, Paris.
[3] Voutsinas, I. & Tsamadias, C. (2014) Does Research and Development Capital Affect Total Factor Productivity? Evidence from Greece. Economics of Innovation and New Technology. 23(7), 631–51.
[4] Drucker, P. (1996). The shape of things to come.
[5] OECD (1996), The OECD Jobs Strategy - Technology,
Productivity and Job Creation, Volume 1,2 Paris
[6] Romer P. (1990), Endogenous Technological Change, Journal of Political Economy, 98(5), October, 1002-37 [7] C. Geffen, Kathleen Judd, “Innovation through initiatives –
framework for building new capacities in public sector research organizations”, Journal of Engineering and Technology Management, 2004, Volume 21, pp. 281-306. [8] Santos, J. F. & Catalao – Lopes, M. (2014). Does R&D
matter for economic growth or vice-versa? An application to Portugal and other European Countries. Archives of Business Research, 2(3), 1-17.
[9] Bilbao-Osorio B. & Rodríguez-Pose, A., 2004. From R&D to Innovation and Economic Growth in the EU. Growth and Change vol. 35, issue 4, pages 434-455
[10] Burcay Yasar Akcali & Elcin Sismanoglu (2015). Innovation and the Effect of Research and Development (R&D) Expenditure on Growth in Some Developing and Developed Countries. Procedia – Social and Behavioral
Sciences, 195, 768 – 775.
[11] Erdal Gumus & Ferdi Celikay (2015), R&D Expenditure and Economic Growth: New Empirical Evidence. Margin –
The Journal of Applied Economic Research 9:3: 205 – 217.
[12] Gene M Grossman, M. G. & Helpman, E., 1994.
Technology and trade, s.l.: National Bureau of Economic
Research.
[13] Lucas, R.E. 1988. On mechanisms of economic development. Journal of monetary Economics 22.1: 3-42 [14] Ozcan, Burcu, & Ari, Ayse. (2014). The relationship