http://dx.doi.org/10.4236/ajac.2015.63018
How to cite this paper: Wu, G.M., et al. (2015) Further Study of Electric Dust Removal with Transparent Fork Electrodes. American Journal of Analytical Chemistry, 6, 196-201. http://dx.doi.org/10.4236/ajac.2015.63018
Further Study of Electric Dust Removal with
Transparent Fork Electrodes
Guangming Wu
1*, Dan Li
2, Jianxiang Yu
1, Tianlan Yin
2, Dongdong Feng
11Beijing Institute of Petrochemical Technology, Beijing, China 2Beijing University of Chemical Technology, Beijing, China
Email: *[email protected]
Received 26 December 2014; accepted 28 January 2015; published 30 January 2015
Copyright © 2015 by authors and Scientific Research Publishing Inc.
This work is licensed under the Creative Commons Attribution International License (CC BY). http://creativecommons.org/licenses/by/4.0/
Abstract
This study is a continuation of our previous work. In this experiment, transparent tdoped in-dium oxide (ITO) fork electrodes with different width and spacing were coated on the glass sub-strates. The used dust particle size was smaller than 180 mesh. The effects of the electrode width, the electrode spacing, voltage, frequency, waveform, and the duty ratio on the dust removal effi-ciency were studied. The obtained optimum conditions of dust removal were as follows: voltage was 1500 V, frequency was 15 Hz, square wave, 10% duty ratio, the electrode width was 0.5 mm, electrodes spacing was 1.3 mm. Our previous experimental results show that the dust removal ef-ficiency would be up to 95%. But in this experiment, under the optimum conditions, the dust re-moval efficiency could be up to 99%.
Keywords
Transparent Fork Electrode, Dust Removal Efficiency, ITO
1. Introduction
With the more and more explorations of the moon, Mars and other planets and the growing popularity of solar energy in the social production, dust removal technology on solar panels has attracted considerable attention and investigation. Among all kinds of known dust removal technologies, growing interest has been focused on elec- tric dust removal technology, because of its high efficiency, clean, no contact and no damage to solar panels, and other advantages. So it has become a hot spot of dust removal research area [1] [2]. Fork electrodes are composed of a series of plus and minus alternate, staggered parallel electrodes, some articles called electric
197
tain. Electric curtain are divided into two kinds, one is the standing wave electric curtain, which is1 connected to single-phase AC power supply, and the other is the traveling wave electric curtain, which is connected to poly-phase AC power supply [3] [4].
Electric dusting was put forward for the first time by Tatom et al. in 1967. Masuda et al. studied the move-ment of dust particles in fork electrode electric field. Schmidin and Melcher et al. explored a great diversity of application of electric dust removal with fork electrodes [5]-[7]. Mazumder et al. put forward the concept of flexible electrodynamic screen (EDS) based on the traveling wave electric curtain technology, studied the dust removal efficiency in Martian environmental, and proposed the feasibility of EDS applied to photovoltaic sys- tem in dusting removal on solar panels [8].
This study is a further exploration of our previous study [9]. Transparent ITO fork electrodes with the same thickness, different width, different spacing were coated on glass substrates and connected to single-phase AC power. The alternating electric field was produced and then the landed dielectric dusts were polarized. The elec-tric force formed by the transient changes of elecelec-tric field will overcome gravity and dust adhesion strength be-tween the substrate, so the dusts can be removed. The influences of the spacing and width of the fork electrode, voltage, frequency, waveform and duty ratio on dust removal efficiency were investigated in the experiment.
2. Experiment
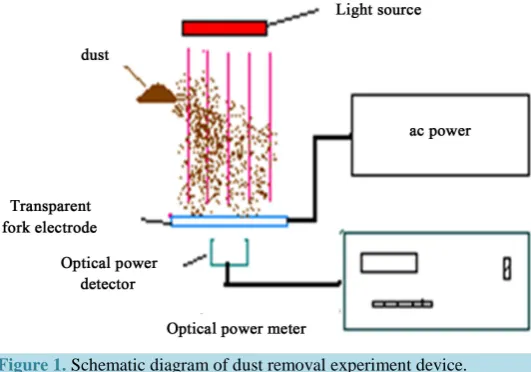
Dust removal experiment device was shown in Figure 1. The light source is a common used fluorescent lamp. The dust removal efficiency can be measured by detecting the light power intensity of substrate under different condition with power detector. Setting the initial light power intensity of ITO fork electrode is A, after placed dust is B, after dust removal is C, so the dust removal efficiency is defined as: (C − B)/(A − B) * 100%. The dust used in this experiment is the outdoor natural dust in Beijing Daxing district and the particle size is less than 180 meshes. The selected wavelength of power detector is 514 nm.
3. Results and Discussion
3.1. Orthogonal Table
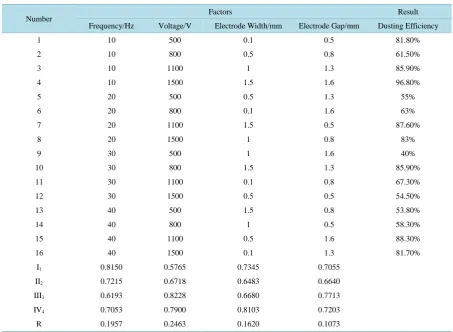
[image:2.595.165.431.513.699.2]Table 1 is orthogonal table of fork electrode dust removal experiment, it can be seen that the dust removal effi-ciency under the experimental conditions of group 4 (10 Hz frequency, voltage 1500 V, electrode width is 1.5 mm, electrode spacing of 1.6 mm) is highest, up to 96.8%. Through range analysis, the effect of voltage on the dust removal efficiency is the largest, the next is the frequency, last is electrode width, and the electrode spacing has minimal impact on dust removal efficiency. This is mainly because the voltage is one of the main influenc- ing factors of electric field intensity, whereas the frequency determines the speed of direction change of electric field intensity.
Figure 1. Schematic diagram of dust removal experiment device.
198
Table 1. Orthogonal table of fork electrode dust removal experiment.
Number Factors Result
Frequency/Hz Voltage/V Electrode Width/mm Electrode Gap/mm Dusting Efficiency
1 10 500 0.1 0.5 81.80%
2 10 800 0.5 0.8 61.50%
3 10 1100 1 1.3 85.90%
4 10 1500 1.5 1.6 96.80%
5 20 500 0.5 1.3 55%
6 20 800 0.1 1.6 63%
7 20 1100 1.5 0.5 87.60%
8 20 1500 1 0.8 83%
9 30 500 1 1.6 40%
10 30 800 1.5 1.3 85.90%
11 30 1100 0.1 0.8 67.30%
12 30 1500 0.5 0.5 54.50%
13 40 500 1.5 0.8 53.80%
14 40 800 1 0.5 58.30%
15 40 1100 0.5 1.6 88.30%
16 40 1500 0.1 1.3 81.70%
I1 0.8150 0.5765 0.7345 0.7055
II2 0.7215 0.6718 0.6483 0.6640
III3 0.6193 0.8228 0.6680 0.7713
IV4 0.7053 0.7900 0.8103 0.7203
R 0.1957 0.2463 0.1620 0.1073
3.2. Relations between Frequency, Voltage and Dust Removal Efficiency
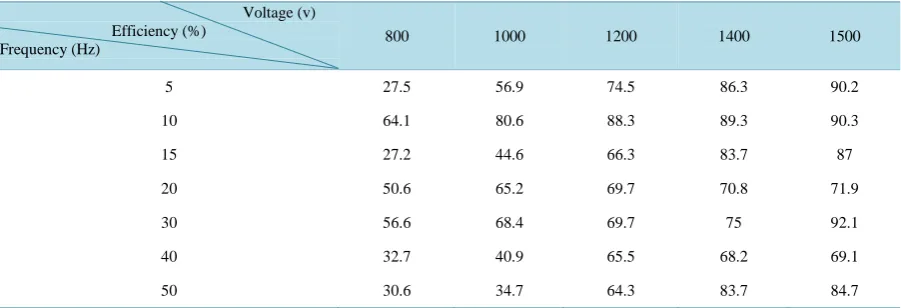
According to the results of the above orthogonal table and anti-breakdown scope of electrodes, the electrodes of the 4th, 5th, 9th and 15th groups were selected in the experiment, and the electrode width and spacing of which are as follows: 1.5 mm and 1.6 mm, 0.5 mm and 1.3 mm, 1 mm and 1.6 mm and 0.5 mm and 1.6 mm, respec-tively. The dust removal experiments were carried out under the different voltage and frequency, in order to find the optimal electrode width and spacing, frequency and voltage. The results were shown in Tables 2-5.
The experimental results show that low frequency is more advantageous to remove dust. The higher the vol-tage, the higher dust removal efficiency is. Considering the whole results, the 5th electrode is the best one. When electrode width is 0.5 mm, spacing is 1.3 mm, the voltage is 1500 V, and the frequency is 15 Hz, the largest dust removal efficiency can reach up to 99%.
3.3. Analysis between Waveform and Dust Removal Efficiency
The impact of waveform on dust removal efficiency has been examined as well. Square wave, sine wave, trian-gular wave and sawtooth wave were applied respectively to the 5th electrode (0.5 mm and 1.3 mm), under 1500 V voltage and 15 Hz frequency. The dust removal effects were shown in Figure 2. From the results we know that the square wave has the best effect for dust removal, and the sine wave has the worst.
3.4. Analysis between Duty Ratio and the Dust Removal Efficiency
Figure 2. Impact of waveform on dust removal efficiency.
[image:4.595.87.541.400.543.2]Figure 3. The influence of duty ratio on dust removal efficiency.
Table 2. The result of group 4 electrode (1.5 mm, 1.6 mm).
Voltage (v) Efficiency (%)
Frequency (Hz) 800 1000 1200 1400 1500
5 22 43.9 75.6 76.8 81.7
10 45.2 76.7 82.2 93.2 95.9
15 15.5 22.3 44.7 89.3 93.2
20 39.1 63.2 78.2 89.7 95.4
30 32.5 67.5 77.5 91.3 92.5
40 15.7 25.6 48.8 57 67.8
[image:4.595.86.538.567.722.2]50 46.3 62.5 66.3 80 85
Table 3. The result of group 5 electrode (0.5 mm, 1.3 mm).
Voltage (v) Efficiency (%)
Frequency (Hz) 800 1000 1200 1400 1500
5 49 72.1 91.3 94.2 95.2
10 38.9 77.9 89.5 94.7 97.9
15 30.5 59 87.6 97.1 99
20 45.9 73.8 91 95.1 95.9
30 43.8 75 88.5 93.8 97.9
40 39.1 66.3 80.4 88 91.3
200
Table 4. The result of group 9 electrode (1 mm, 1.6 mm).
Voltage (v) Efficiency (%)
Frequency (Hz) 800 1000 1200 1400 1500
5 25.7 28.7 41.6 45.5 55.4
10 65.2 69.7 78.7 86.5 95.5
15 17 20.5 28.6 29.5 30.4
20 55 59 60 61 65
30 42.3 43.3 47.4 48.5 49.5
40 32.6 60.5 61.6 62.8 64
[image:5.595.88.539.282.436.2]50 43.9 76.8 82.9 87.8 93.9
Table 5. The result of group 15 electrode (0.5 mm, 1.6 mm).
Voltage (v) Efficiency (%)
Frequency (Hz) 800 1000 1200 1400 1500
5 27.5 56.9 74.5 86.3 90.2
10 64.1 80.6 88.3 89.3 90.3
15 27.2 44.6 66.3 83.7 87
20 50.6 65.2 69.7 70.8 71.9
30 56.6 68.4 69.7 75 92.1
40 32.7 40.9 65.5 68.2 69.1
50 30.6 34.7 64.3 83.7 84.7
4. Conclusion
A series of ITO transparent fork electrodes with different width and spacing were designed, through the ortho-gonal experiment we know that the key factors influencing the efficiency of dust removal are the voltage and frequency. The 4th (1.5 mm and 1.6 mm), 5th (0.5 mm and 1.3 mm), 9th (1 mm and 1.6 mm) and 15th (0.5 mm and 1.6 mm) electrodes were selected to carry on in-depth analysis of influence of the voltage and frequency on the dust removal efficiency. Furthermore, the influences of waveform and duty ratio on dust removal efficiency were analyzed as well, and the best conditions of dust removal are obtained, as follows: the voltage is 1500 V, at a frequency of 15 Hz, square wave, the duty ratio is 10%, the electrode width is 0.5 mm, and the electrode spac-ing is 1.3 mm. Under the optimal conditions, dust removal efficiency can be as high as 99%.
References
[1] Yuan, Y.F., Liu, M. and Bai, X.C. (2010) Research of Electrode Screen as Mitigation Technology. Spacecraft Engi-neering, 19, 89-94.
[2] Kawamoto, H. (2009) Electrostatic and Electromagnetic Cleaning of Lunar Dust Adhered to Spacesuits. Annual Meet-ing of LEAG, Lunar and Planetary Institute, Houston.
[3] Liu, G.Q., Li, S.Q., Liu, G.Q., et al. (2011) Characteristics of the Motion of Martian Dust Simulant on the Travelling- Wave Electric Curtain. Journal of Engineering Thermal Physics, 32, 2073-2075.
[4] Liu, G. and Marshall, J.S. (2010) Particle Transport by Standing Waves on an Electric Curtain. Journal of Electrostatics, 68, 289-298. http://dx.doi.org/10.1016/j.elstat.2010.02.004
[5] Qian, D., Marshall, J.S. and Frolik, J. (2012) Control Analysis for Solar Panel Dust Mitigation Using an Electric Cur-tain. Renewable Energy, 41, 134-144. http://dx.doi.org/10.1016/j.renene.2011.10.014
Wave Electric Curtain. Spacecraft Engineering, 21, 72-79.
[7] Liu, G.Q. and Marshall, J.S. (2010) Effect of Particle Adhesion and Interactions on Motion by Traveling Waves on an Electric Curtain. Journal of Electrostatics, 68, 179-189. http://dx.doi.org/10.1016/j.elstat.2009.12.007
[8] Zhou, C.D., He, G.F., Zhang, J., et al. (2013) Research on the Motion Pattern of Dust Particles and Self-Cleaning Me-chanism of Solar Cells under Traveling-Wave Electric Curtain. Journal of Hebei University of Science and Tech- nology, 34, 27-32.