© 2016, IRJET | Impact Factor value: 4.45 | ISO 9001:2008 Certified Journal
| Page 1403
Renewable Energy Potential, Policy and Forecasting- A Review
Vijay Kumar
1, Varun Kumar Singhal
2, Mayank Agarwal
31
Assistant Professor IMSEC Ghaziabad
2
Assistant Professor IMSEC Ghaziabad
3
Assistant Professor
IMSEC Ghaziabad
---***---Abstract -
Renewable energy is one of the cleanest sourcesof energy with minimum possible, pollution or harmful emissions and has the potential to minimize dependency conventional energy sources such as coal, oil, gas and other fuels. By increasing the utilization of renewable energy sources, we can improve air quality, reduce global warming, harmful emissions, create new industrial jobs opportunity, and can move towards a clean, secure, and economical energy future. The quest for energy autonomy, remunerative growth, and environmental sustainability continuously indicates the importance of renewable energy sources (RES) across the world. Renewable energy sources are seen not only as sources of energy, but also as tools to address some other important requirements, such as improving energy security access, minimizing the health, environmental impacts due to emission of harmful gases from fossil fuels, nuclear energy plants, and mitigating greenhouse gas emissions. India’s considerable and prolong growth has placed enormous demand on the country’s natural resources. Today, India imports considerable quantities of gas, oil and coal in order to meet its continuous growing energy demand. The increasing dependency on imported fuels may create a serious threat to the future energy security of the country. In addition, the India’s 272 GW of power generation capacity which is mainly based on conventional energy sources has further strained the natural resources. Around 65% of India’s current power generation capacity is based on coal. However, the coal sector and its quality is limited and facing many challenges, still India is increasingly entrust on coal & oil imports to meet its requirements of energy, thereby exhibiting a lot of pressure from environmental, health and remunerative growth point of view from these high import factors.
Key Words
: Renewable Energy Potential, Policy, Physical Growth, Forecasting.1.INTRODUCTION
We ask that authors follow some Today energy demand and
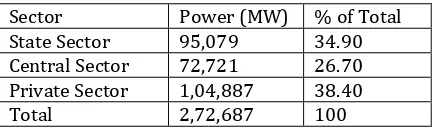
supply has become the main parameter for the socio-economic and technological development of any country. As the conventional energy sources like fossil fuels have adverse effect on the surrounding environment and are limited in the nature, so to meet the demand of energy of the future, we have to move towards Renewable energy sources [1]. The share of various Energy sectors / sources according to Central Electricity Authority (CEA) as on30.04.2015 is listed in table below [2].
Table 1: Total Installed Capacity Sector wise
Sector Power (MW) % of Total State Sector 95,079 34.90 Central Sector 72,721 26.70 Private Sector 1,04,887 38.40
Total 2,72,687 100
Table 2: Total Installed Capacity Source wise
Source Power (
MW) % of Total
Coal 165,236 60.6
Gas 23,062 8.5
Oil 1,200 0.4
Hydro 41,632 15.3
Nuclear 5,780 2.1
Renewable
Energy 35,777 13.1
Total 2,72,687 100
2. RES POTENTIAL, SHARE, GROWTH IN INDIA
[image:1.595.314.533.238.303.2]© 2016, IRJET | Impact Factor value: 4.45 | ISO 9001:2008 Certified Journal
| Page 1404
Interactive / Off Grid- Interactive Renewable Energy Sourcescapacity and its Physical progress for Financial Year 2014-15 in India are shown in the table below [3].
Table 3: Share of Off Grid-interactive RES.
Sector Capacity ( MW) Waste to Energy 154.47
Biomass(non-bagasse) 591.87
Biomass
Rural, Industrial 170 Aero-Genrators
/Hybrid s 2.53
SPV Systems 234.35
Table 4: Share of Grid-Interactive RES.
Sector Capacity (MW)
Wind Power 23444.00
Small Hydro Power 4055.36
Biomass 1410.20
Bagasse Cogeneration 3008.35
Waste to Power 115.08
Solar Power 3743.97
Total 35776.96
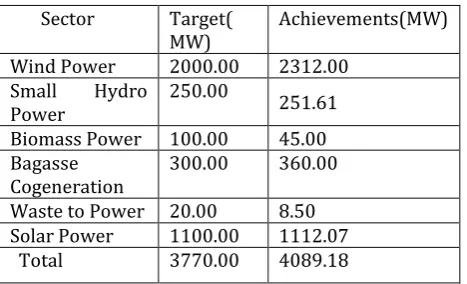
Table 5: Physical Progress of Grid-interactive RES.
Sector Target(
MW) Achievements(MW) Wind Power 2000.00 2312.00
Small Hydro
Power 250.00 251.61
Biomass Power 100.00 45.00 Bagasse
Cogeneration 300.00 360.00 Waste to Power 20.00 8.50 Solar Power 1100.00 1112.07 Total 3770.00 4089.18
Table 6: Physical Progress Off Grid-interactive RES
Sector Target
(MW) Achievements MW) Waste to Energy 10.00 21.78
Biomass(Non-Bagasse) 80.00 60.05
Biomass
Rural, Industrial 8.80 6.66 Aero-Genrators
/Hybrid 0.50 0.27
SPV Systems 60.00 60.00 Water mills/micro 4.00 4.00
hydel
Bio-gas based energy 0.00 0.30 Total 163.30 93.16
Table 7: Region wise Installed RES Capacity.
Region Capacity (MW)
Northern 6489.77
Western 12975.07
Southern 14884.77
Eastern 862.76
North- East 567.67
Islands 11.06
Total 35791.04
3. DIFFERENT RE POLICIES IN INDIA
(i) National Action Plan of Climate Change (NAPCC-2008) (ii) Renewable Purchase Obligation (RPO)
(iii) Solar park scheme
(iv) National offshore wind policy (v) Green energy transmission corridor (vi) JNNSM
(vii) Solar Scale up Vision
(viii) National Wind Energy Mission
These policies are made time to time by the Indian Government for better development of RE sources to meet the demand of power requirement. Main feature and detailed of few of the above policies are describes below
[image:2.595.30.265.167.280.2]JNNSM (Jawaharlal Nehru National Solar Mission) [3]: The JNNSM was launched in January 2010 by the Government of India under the National Action Plan of Climate Change (NAPCC). It is envisaged that as a result of rapid scale up as well as technological developments, the price of solar power will attain parity with grid power by the end of the Mission period, enabling accelerated and large-scale expansion thereafter. The mission includes a major initiative for promoting solar photovoltaic (PV) applications. It had three phases out of which the first phase finished in 2013, and subsequent phases are under way which target a capacity addition of 20,000 MW in India via grid connected solar power plants. Apart from grid connected targets, JNNSM also set up targets for off grid applications and Solar Thermal in India which are shown below in table 8.
Table 8: Solar Target Phase wise under JNNSM
Segment Phase – I (2010- 13)
Phase – II
(2013- 17) Phase – III ( 2017- 22)
Grid solar
power 1,100 MW 10,000 MW 20,000 MW
Off-grid
[image:2.595.31.265.450.592.2]© 2016, IRJET | Impact Factor value: 4.45 | ISO 9001:2008 Certified Journal
| Page 1405
applications MW MW
Solar Thermal Collectors
7 million
sq. meters 15 million sq. meters 20 million sq meters
National Wind Energy Mission [3]:
[image:3.595.31.264.99.163.2]In order to exploit the available wind potential in the country expeditiously, there is a need to address the issues and barriers in a focused manner. The Government therefore proposes to launch the National Wind Energy Mission which aims to achieve 60,000 MW of utility scale wind installations in the country by the end of 13th five year plan (end of 2022).
Table 9: Estimated Wind Power Category wise (Up to 2022)
Category Power ( MW) On- shore wind 58,000
Off-shore wind 1500 Distributed Power 500 Total 60,000
Table 10: State wise Wind Target for FY 2014-15
State Target( MW)
Rajasthan 600
Madhya Pradesh 700
Gujarat 400
Maharashtra 800
Andhra Pradesh 500
Karnataka 400
Tamil Nadu 400
Telangana 200
Total 4000
According to Ministry of Statistics and Programme Implementation Government of India report Energy Statistics 2015. The total potential for renewable power generation in the country as on 31.03.14 is estimated at 147615 MW. This includes wind power potential of 102772 MW (69.6%), SHP (small-hydro power) potential of 19749 MW (13.38%), Biomass power potential of 17,538 MW (11.88%) and 5000 MW (3.39%) from bagasse-based cogeneration in sugar mills. Solar Park [14]:
Ministry of New and renewable Energy (MNRE) has drawn a scheme to set up number of solar parks across various states in the country, each with a capacity of Solar Projects generally above 500 MW. The Scheme proposes to provide financial support by Government of India to establish solar parks with an aim to facilitate creation of infrastructure necessary for setting up new solar power projects in terms of allocation of land, transmission and evacuation lines, access roads, availability of water and others, in a focused manner. Solar Energy Corporation of India (SECI), a central public sector enterprises under MNRE , has been implementing various schemes to develop solar sector in the country. As per the
policy, these solar parks will be developed in collaboration with the State Governments. The implementation agency would be Solar Energy Corporation of India (SECI) on behalf of Government of India (GOI). SECI will handle funds to be made available under the scheme on behalf of GOI. The states shall designate a nodal agency for implementation of the solar park.
Table 11: Solar Park details
State Park Name Location Capacity (MW)
Madhya
Pradesh Ultra solar park mega Rewa 750 Andhra
Pradesh Kurnool solar park Pinnapuram 1000
Rajasthan Bhadla solar
park Bhadla 700
Gujarat Banaskantta
Solar Park Banaskantta 700
4
. FORECASTING METHODS OF RES
(a) Weibull probability density function [5]:
Weibull function has been applied widely by researchers in field of wind speed analysis for several decades. The Weibull probability density function (Weibull PDF) for demonstrating the Weibull distribution will be indicated as in equation (1).
………(1)
where ƒ(v) is the probability of apperceive wind speed, v represents wind speed that is a stochastic.
The Weibull shape and scale parameter are denoted by k and c, respectively. k is dimensionless and it represents how peak the object is, while c has a unit of wind speed (m/s) and it shows how windy the case study is. The weibull probability densities function and the characteristics of the wind speed for c=1 and k= 0.5, 1, 1.5 & 5 are shown in figure 1.
Figure 1: The Weibull PDF for wind speed
[image:3.595.314.553.613.743.2]© 2016, IRJET | Impact Factor value: 4.45 | ISO 9001:2008 Certified Journal
| Page 1406
In developing a NWP-based wind power prediction model theselection of the particular NWP model is a critical step [6]. Important selection criteria include the geographical area, the resolution (both spatial and temporal) and the forecast horizon, as well as the accuracy required and the computational time and number of runs. NWP models usually have three main components, the dynamic center, which represents the adiabatic non-viscous flow, the physical equations describing variability of the meteorological processes (e.g. turbulence and radiation) and the information gathering software code.
(c) Physical methods [7]:
Several physical models based on the use of weather data have been developed for wind speed forecasting and wind power predictions. The physical models generally make use of global databases of meteorological measurements or atmospheric mesoscale models, but they require large computational systems in order to achieve accurate results [7]. In the physical approach a detailed description of the lower atmosphere is used to estimate the wind power output.
(d) Statistical and learning approach method [8]:
In the statistical approach a vast amount of data is analyzed and meteorological processes are not explicitly represented. The link between historical power production and weather is determined and then used to forecast the future power output. Unlike physical methods, statistical methods involve only one-step to convert the input variables into power output. Hence, the methods used are described as ‘black box’. Generally a statistical relationship is developed between the weather forecast or prediction and the potential power output from the wind farm.
(e) Benchmarking & uncertainty analysis [9]:
As wind power forecasting has intrinsic uncertainty, the results of any model must be tested. The verification of wind power prediction models is complicated. As wind power prediction model outputs are generally either a vast array of single value point forecasts for each look-ahead time or more recently multiple ensembles from a multi-scheme ensemble prediction (MSEP), it is difficult to establish a standard metric of accuracy. Therefore, a number of accuracy tests are used to benchmark or validate a model and to determine the percentage of uncertainty of the results. The input data and the time horizon usually determine the most appropriate accuracy test. In Madsen three criteria were identified to establish the ‘fitness for purpose’ of a weather forecast. These criteria are consistency, quality and value. Consistency refers to the expectations of the model performance based on the skill and experience of the modeler. Quality is defined as the correspondence between the observed and forecasted observations. Value is related to the ‘fit for purpose’ or relevance of the forecast to its actual function and application.
(f) Probabilistic Forecasting [10]:
Probabilistic forecasting consists in providing the future probability of one or more events. In this sense, probabilistic forecasting is generally opposed to deterministic forecasting where a single predicted value is provided for each considered horizon. Probabilistic forecasts can be provided under different forms depending on the nature of the variable being forecast. For discrete variables (i.e. for a finite number of possible events) probabilistic forecasts are called probability forecasts. Various types of forecasts exist when forecasting continuous variables. A quantile forecast is the value such that the observation has a predefined probability to be inferior or equal to this value. Predictive intervals provide a lower and upper bound between which the observed event is expected to fall within a predefined probability.
(g) Neural Network [11]:
Now days it is the most powerful tool for optimization as well as forecasting. In the beginning it was mainly used for the load forecasting. Now it is widely used in the PV generation power forecasting. The artificial neural network (ANN) is rapidly used by the most of the researchers in the field of PV power forecasting because of non-linearity in the weather data. ANN is a great tool and easily understands the complicated and non-linear bonding between the data without any prior assumption. ANNs were implemented to develop models using different input vectors. In the first model it uses historical data of measured PV power as an input data vector, in the second model time series of measured PV power with irradiance and in the third model author uses time series of model, ambient temperature, solar irradiance data and time series data of the PV power [11]. In all above model third model give more appropriate and desired results. So, we see that as we add more weather variables as an input data vector the prediction of the forecasting is going to be more accurate and satisfactory. It uses time series analysis model NARX, feed forward neural network with tapped delay lines. During training process model uses solar radiation as an input data, the hour as exogenous input and PV production data as an endogenous input. Model forecast the PV power generation with less than 5% error [12].
(h) ARMA model [13]:
© 2016, IRJET | Impact Factor value: 4.45 | ISO 9001:2008 Certified Journal
| Page 1407
5. CONCLUSION
Today energy demand and supply has become the main parameter for the socio-economic and technological development of any country. As the conventional energy source have adverse effect on the surrounding environment and limited in the nature. To meet the demand of energy of the future, we have to focus on Renewable energy sources. With fast increase in Renewable power penetration into the power grid, renewable power forecasting is becoming very important for operators, participants in power market. As uncertainty is always associated with the Renewable power (Wind, Solar) output. Accurate forecasting reduces the need for additional balancing energy and reserve power to integrate. Although there are many policies made by Government to increase the Renewable Energy production to reduce the dependency on conventional energy sources, but we are still straggle to achieve up to marks. Private participants should be motivated by providing subsidies, loan facility, encouragement, training facility, land availability and markets to participant.
REFERENCES
[
1]. R.Majumder, I.Mukherjee, B.Tudu, and D.paul, “Review on Feasibility of Wind Energy Potential for India,” Proceeding of 1st International Conference on Non- Conventional Energy(ICONCE 2014), January 16-17, 2014, WB, India. [2]. “Executive Summary of power sector- Month wise,”
Internet:http://www.cea.nic.in, Oct.2014.
[3]. “Summary of power sector- Month wise,” MNRE Internet:http://www.mnre.ac.in, March.2015.
[4]. “Energy Statistics 2015”Ministry of Statistics and Programme Implementation Government of India. www. mospi.gov.in.
[5]. Rasool Heydari and Somayeh Hasanpour, “Wind Power Trading in Power Energy Market,” Proceeding of 1st International Conference on Non- Conventional Energy (ICONCE 2014).
[6] Niya chen, Zheng Qian, Ian T. Nabney and Xiaofeng Meng, “Wind Forecasts Using Gaussian Processes and Numerical Weather Prediction,” IEEE Trans. Power Syst. Vol.29, No.2, pp. 656-665, March 2014.
[7] Aoife M. Foley, Paul G. Leahy, Antonino Marvuglia,and Eamon J. McKeogh, “Current methods and advances in forecasting of wind power generation,” Renewable Energy 37, pp. 1-8, 2012.
[8] El-Fouly THM, El-Saadany EF, Salama MMA. “Grey predictor for wind energy conversion systems output power prediction”, IEEE Transactions on Power System 2006. [9] Smith JC, Thresher R, Zavadil R, DeMeo E, Piwko R, Ernst B, et al. Mighty “ integrating wind energy into the electric power system”, IEEE Power & Energy Magazine 2009.
[10] Jeremie Juban, Nils Siebert and George N. Kariniotakis, Member, IEEE “Probabilistic Short-term Wind Power Forecasting for the Optimal Management of Wind Generation”, IEEE Conference 2014.
[11] M. G. De Giorgi, P. M. Congedo and M. Malvoni, “Photovoltaic power forecasting using statistical method: impact of weather data,” IET Sci. Meas. Technol., Vol. 8, Iss. 3, pp. 90–97, 2014.
[12] M. Diagne, M. David, P. Lauret, J. Boland and N. Schmutz, “Review of solar irradiance forecasting methods and a proposition for small-scale insular grids,” Renewable and Sustainable Energy Reviews, Elsevier, pp.65 – 76, 2013.
[13] Richard Perez, Sergey Kivalov, James Schlemmer, Karl Hemker Jr., David Renn and Thomas E. Hoff , “Validation of short and medium term operational solar radiation forecasts in the us,” Solar Energy, pp.2161-2172, 2010.
[14]. Solar energy corporation of India, http:// seci.gov.in.