Familial distal renal tubular acidosis is
associated with mutations in the red cell anion
exchanger (Band 3, AE1) gene.
L J Bruce, … , O Wrong, M J Tanner
J Clin Invest.
1997;
100(7)
:1693-1707.
https://doi.org/10.1172/JCI119694
.
All affected patients in four families with autosomal dominant familial renal tubular acidosis
(dRTA) were heterozygous for mutations in their red cell HCO3-/Cl- exchanger, band 3
(AE1, SLC4A1) genes, and these mutations were not found in any of the nine normal family
members studied. The mutation Arg589--> His was present in two families, while Arg589-->
Cys and Ser613--> Phe changes were found in the other families. Linkage studies
confirmed the co-segregation of the disease with a genetic marker close to AE1. The
affected individuals with the Arg589 mutations had reduced red cell sulfate transport and
altered glycosylation of the red cell band 3 N-glycan chain. The red cells of individuals with
the Ser613--> Phe mutation had markedly increased red cell sulfate transport but almost
normal red cell iodide transport. The erythroid and kidney isoforms of the mutant band 3
proteins were expressed in Xenopus oocytes and all showed significant chloride transport
activity. We conclude that dominantly inherited dRTA is associated with mutations in band
3; but both the disease and its autosomal dominant inheritance are not related simply to the
anion transport activity of the mutant proteins.
Research Article
Find the latest version:
http://jci.me/119694/pdf
J. Clin. Invest.
© The American Society for Clinical Investigation, Inc. 0021-9738/97/10/1693/15 $2.00
Volume 100, Number 7, October 1997, 1693–1707 http://www.jci.org
Familial Distal Renal Tubular Acidosis Is Associated with Mutations in the Red Cell
Anion Exchanger (Band 3,
AE1
) Gene
Lesley J. Bruce,* Diane L. Cope,* Graham K. Jones,* Ann E. Schofield,* Mariwyn Burley,‡ Susan Povey,‡ Robert J. Unwin,§ Oliver Wrong,§ and Michael J.A. Tanner*
*Department of Biochemistry, School of Medical Sciences, University of Bristol; ‡MRC Human Biochemical Genetics Unit, University
College London; and§Centre for Nephrology, University College London Medical School, United Kingdom
Abstract
All affected patients in four families with autosomal domi-nant familial renal tubular acidosis (dRTA) were heterozy-gous for mutations in their red cell HCO32/Cl2 exchanger,
band 3 (AE1, SLC4A1) genes, and these mutations were not found in any of the nine normal family members studied. The mutation Arg589→His was present in two families,
while Arg589→Cys and Ser613→Phe changes were found in
the other families. Linkage studies confirmed the co-segre-gation of the disease with a genetic marker close to AE1. The affected individuals with the Arg589 mutations had
re-duced red cell sulfate transport and altered glycosylation of the red cell band 3 N-glycan chain. The red cells of individ-uals with the Ser613→Phe mutation had markedly increased
red cell sulfate transport but almost normal red cell iodide transport. The erythroid and kidney isoforms of the mutant band 3 proteins were expressed in Xenopus oocytes and all showed significant chloride transport activity. We conclude that dominantly inherited dRTA is associated with muta-tions in band 3; but both the disease and its autosomal dom-inant inheritance are not related simply to the anion trans-port activity of the mutant proteins. (J. Clin. Invest. 1997. 100:1693–1707.) Key words: erythrocyte • kidney • acidosis • membrane • nephrocalcinosis
Introduction
In distal renal tubular acidosis (dRTA)1 the tubular secretion
of hydrogen-ion in the distal nepron is impaired, leading to the development of metabolic acidosis, frequently accompanied
by hypokalemia, nephrocalcinosis, and metabolic bone disease (1). The condition can be familial, when it is usually inherited as an autosomal dominant, though there is a rarer autosomal recessive form associated with nerve deafness.
The molecular basis of familial dRTA is not known. Sug-gestions (1–3) include defects in either the H1-ATPase or the
H1/K1-ATPase on the apical membrane of the H1-secreting
a-intercalated cells in the collecting duct, or an increased per-meability of this membrane causing excess back-diffusion of secreted H1, resulting in a failure to establish or maintain a
cell-to-lumen hydrogen ion gradient. A further possibility, which has received little attention, is a defect in the HCO32/Cl2
anion exchanger (AE1, band 3) on the basolateral membrane of this cell type (3).
The members of the anion exchanger (AE) gene family (4, 5) are widely distributed in tissues, where they are involved in the regulation of intracellular pH, cell volume and the trans-cellular transport of acid and base across epithelial cells. There are at least three members of the AE gene family, and the very abundant form present in red cells (AE1 or band 3) has been studied in some detail (6). Red cell band 3 is a protein of z 95 kD with two distinct functions: the 40-kD NH2-terminal
do-main extends into the red cell cytoplasm and acts as a mem-brane anchorage site for the red cell skeleton, while the COOH-terminal 55-kD domain carries out anion transport.
The AE1 gene (also known as SLC4A1 and EPB3) has a relatively restricted expression in tissues. As well as being present in erythroid cells, an AE1 gene product is also found in the basolateral membrane of the a-intercalated cells of kidney collecting ducts which are involved in acid secretion (7–9). Studies of the major AE1 transcripts, carried out first in mouse and rat kidney (10, 11), and more recently in human kidney (12) suggest that the kidney form of AE1 is truncated at the NH2 terminus because it lacks exons 1–3 of the erythroid form
(10, 11). A promoter which gives rise to these kidney tran-scripts is present in erythroid intron 3 of the human AE1 gene (12, 13). Studies on human kidney have shown that while the protein in the basolateral membrane of a-intercalated cells is reactive towards monoclonal antibodies to the membrane transport domain of AE1 (7, 14), several antibodies to the
cy-A preliminary account of part of this work has been presented in a re-port of a meeting of Physicians and Scientists at University College London Medical School.
Address correspondence to Michael J.A. Tanner, Department of Biochemistry, School of Medical Sciences, University of Bristol, Uni-versity Walk, Bristol BS8 1TD, United Kingdom. Phone: (1 44)-117-9288271; FAX: (144)-117-9288274; E-mail: m.tanner@bristol.ac.uk. D.L. Cope’s present address is Department of Biochemistry, Univer-sity of Glasgow, United Kingdom. A.E. Schofield’s present address is Department of Biochemistry, University of Otago, Dunedin, New Zealand.
Received for publication 25 April 1996 and accepted in revised form 14 August 1997.
1. Abbreviations used in this paper: AE1, (AE2, AE3), anion ex-changer 1 (2, 3); DIDS, 4,49-di-isothiocyanato-stilbene-2,29 -disul-fonate; DNDS, 4,49-dinitro-2,29-stilbene disulfonate; dRTA,distal re-nal tubular acidosis;GPA, glycophorin A; nt, nucleotide; PNGase F, peptide N-glycosidase F; R589C, Arg589→Cys mutation; R589H,
Arg589→His mutation; S613F, Ser613→Phe mutation; SAO,Southeast
toplasmic domain of AE1 are unreactive (7), also consistent with renal AE1 being truncated at the NH2 terminus.
We have examined the possibility that patients with auto-somal dominant familial dRTA might have altered HCO32/
Cl2exchange, resulting from changes in AE1, which lead to
re-duced H1 secretion and urinary acidification. This might be
re-vealed by analysis of the properties of AE1 in red cells, which are much more readily available and amenable to biochemical analysis than renal tissue. In this report we describe different mutations in the AE1 gene which are associated with the pres-ence of dominant familial dRTA and also result in altered red cell anion exchanger structure and function.
Methods
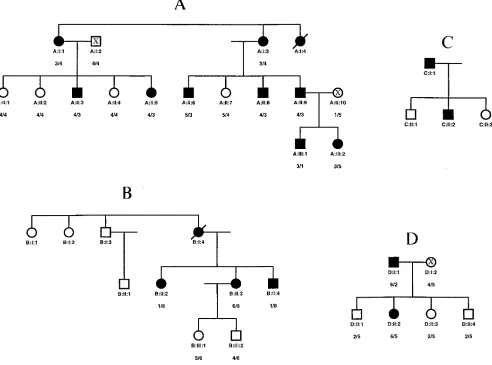
The 18 patients with dRTA reported here were members of four fam-ilies from Southeast England, all with at least two generations af-fected (see Fig. 1). Table I shows the data from which this diagnosis was made. Families A and B have already been reported in part (15, 16). Studies were performed on the 16 affected and 9 unaffected sur-vivors of these four families. Most patients presented clinically with renal stones, and the majority had nephrocalcinosis. B:1:4 had rickets when initially seen aged 10, and developed osteomalacia aged 31 after she stopped taking alkali therapy, but no other patient had bone dis-ease. Eight patients were not acidotic when first seen, and were diag-nosed as “incomplete” dRTA (17, 18) because they were unable to excrete a urine more acid than pH 5.3 after oral acute ammonium chloride challenge (17). Compared with acidotic cases, these patients tended to be younger, with lower plasma creatinines, better preserva-tion of urinary concentrating ability, and less (or no) nephrocalcino-sis; over the subsequent 10 years two of them (A:II:3 and A:II:8)
spontaneously developed acidosis. Acidotic patients were treated with oral alkalis, usually six grams of sodium bicarbonate daily, and had normal acid-base status at the time of the present study; nonaci-dotic patients were not treated.
Urine acidification was assessed by urine pH during spontaneous acidosis, or in nonacidotic patients after acute ammonium chloride challenge (17); renal concentrating ability was tested as previously described (15). Blood films from all patients were carefully examined by experienced clinical hematologists, and none showed abnormal morphological features. However, red cell indices showed that A:II:3, A:II:6, A:II:8, B:II:4 and C:I:1, all with gross nephrocalcinosis, had erythrocytosis with raised hemoglobin and hematocrit values (17.0– 18.2 g/dl and 51.9–55%, respectively), as has previously been de-scribed as a complication of gross nephrocalcinosis from various causes (19, 20).
Linkage analysis
Linkage studies were carried out with the microsatellite marker D17S759, previously shown (21) in the consensus map of chromo-some 17 to map close to the AE1 gene (also known as SLC4A1 or EPB3). The sequence of primers required for this marker was ob-tained from the Genome Database. The marker was typed manually by incorporating trace amounts of 32P-labeled dCTP in the PCR
reac-tion before separating the products on acrylamide gels and subse-quent fluorography. The haplotypes were assigned arbitrary numbers as given in Fig. 1.
Analysis of the AE1 gene by single-strand conformation polymorphisms and DNA sequencing
[image:3.612.59.558.431.739.2]Genomic DNA was isolated from frozen buffy coats prepared from blood samples (22). The coding regions of each of exons 2 to 20 (13) of the human AE1 gene were analyzed for single-strand conformation
Table I. Clinical Details of dRTA Patients
Case number
At diagnosis
Plasma
Urine Current status
Sex/age (yr) Creatinine HCO32 K1
Minimum pH
Maximum
mOsm/kg Age (yr)
Nephro-calcinosis Kidney stones
mmol/liter mmol/liter mmol/liter
A:I:1 F/60 74 24 4.1 6.26 635 74 2 1
A:I:2 F/40 86 18 3.4 6.35 572 71 1 1
A:I:3 F/44 177 14 4.0 6.60 n.t. died 60 1 2
A:II:3 M/27 115 23 3.1 6.45 525 47 1 1
A:II:5 F/35 88 25 3.7 6.09 855 35 2 2
A:II:6 M/36 104 19 3.0 6.59 354 50 1 2
A:II:8 M/34 127 24 3.9 6.71 342 47 1 1
A:II:9 M/31 92 23 3.8 6.35 626 41 2 1
A:III:1 M/9 63 22 4.2 6.00 1100 16 2 2
A:III:2 F/6 52 21 4.2 5.95 943 13 2 2
B:I:4 F/10 97 17 2.1 6.60 252 died 51 1 1
B:II:2 F/11 95 21 4.0 6.23 360 43 1 1
B:II:3 F/8 62 19 4.1 6.80 303 40 1 1
B:II:4 M/6 54 18 3.5 6.23 712 38 1 1
C:I:1 M/22 115 21 3.3 6.42 290 47 1 1
C:II:2 M/2 67 15 3.0 n.t. n.t. 2 1 2
D:I:1 M/27 100 21 3.6 6.30 n.t. 64 1 2
D:II:2 F/19 70 23 3.7 6.27 749 35 1 2
Normal
polymorphisms (SSCP, 23) after polymerase chain reaction (PCR) am-plification of genomic DNA in the presence of 32P-labeled dATP or
dCTP (3000 Ci/mmol), using primers based on the sequences at the intron–exon junctions (12, gift of Dr. S. Lux). The protein coding re-gion of exon 20 was amplified using the antisense primer AS44 (CCATGAGGTGCCCATGAACT) and a sense primer based on the DNA sequence at the 39 end of intron 19 (13). SSCP was done us-ing mutation detection enhancement (MDE) nondenaturus-ing gels (AT Biochem, Malvern, PA) following the protocols provided by the man-ufacturer. DNA sequencing was carried out directly on both strands of PCR products using a Cycle sequencing kit (U.S. Biochemical Corp., Cleveland, OH), the Ampicycle (Perkin-Elmer Corp., Nor-walk, CT) PCR sequencing kit and Sequagel XR sequencing solution (National Diagnostics, GA) or the Thermo Sequenase [33P]
radiola-beled terminator cycle sequencing kit (Amersham International, Bucks, England).
PCR amplification and DNA sequencing of the putative kidney promoter and kidney translation initiator codons, in both dRTA and control samples, used primers designed to span the relevant areas in intron 3 and exon 4 of the AE1 gene, as follows: KproS1: (sense; nu-cleotides [nts] 78 to 97 from the 59 end of intron 3); GASAnn 18: (an-tisense; nts 294 to 315 from the 59 end of intron 3); KProS4: (sense; nts 294 to 315 from the 59 end of intron 3); KproAS1: (antisense; nts 589 to 609 from the 59 end of intron 3); GS10 (sense; nts 466 to 485 from the 59 end of intron 3); AS19 (antisense; nts 13 to 31 of exon 4).
Analysis of the GPA gene by DNA sequencing
The coding regions of each of exons 2 to 5 of the human GPA gene were amplified by PCR, using primers based on the intron–exon junc-tions (24) and sequences from the GenBank database (accession numbers M60707, M60708, M24132, L31856, L31358). DNA sequenc-ing was carried out directly on both strands of PCR products as de-scribed above.
Anion transport studies
Sulfate transport assay. The [35S]sulfate influx into red blood cells
was measured using equal numbers of dRTA and control cells (deter-mined using a cell counter) at 10% hematocrit, and the number of 4,49-di-isothiocyanato-stilbene-2,29-disulfonic acid (DIDS) binding sites was determined by titration of sulfate transport as described pre-viously (25). The Vmax and apparent Km for [35S]sulfate influx were
calculated from sulfate influx measurements in the absence of DIDS, at sulfate concentrations between 0.4 and 40 mM.
Iodide transport assay. The [125I]iodide influx into red blood cells
was determined as above but in a N-[2-hydroxyethy]piperazine-N9 -[2-ethanesulfonic acid] (Hepes) buffered citrate buffer (50 mM Hepes, 2 mM EGTA, 0.4–60 mM NaI, Na-citrate to 310 mosM, pH 7.4). Influx was measured over a 2-min period at 08C.
Analysis of red blood cell membrane proteins and endoglycosidase treatment.Membranes were prepared from untreated or chymo-trypsin-treated red cells (26). The membrane proteins were separated by SDS-PAGE using the method of Laemmli (27). Membranes from untreated or chymotrypsin-treated dRTA and control red cells were treated with peptide N-glycosidase F (PNGase F) according to the manufacturer’s instructions (New England Biolabs, Beverly, MA). The membranes were incubated for 10 min at 1008C in 0.5% SDS, 1% b-mercaptoethanol, 0.2 mM PMSF, and then for one hour at 378C in 0.1 M sodium phosphate, pH 7.5, 2% N P-40, 1000 U PNGase F. Sam-ples were separated by SDS-PAGE as described above. Immunoblot-ting was performed as described by Wainwright et al. (14), using mu-rine monoclonal antibody BRIC 155, which is directed against the COOH-terminal cytoplasmic tail of band 3, or the monoclonal anti-GPA antibodies described in the text.
Preparation of mutant constructs
BSXG1.B3, which contains the coding region of human erythrocyte AE1 cDNA between the 59 and 39 noncoding regions of the Xenopus b-globin cDNA (28), was used as a template for the construction of
Arg589→His (R589H), Arg589→Cys (R589C), and Ser613→Phe (S613F)
mutants. BSXG1.B3(R589H) was made using the Sculptor in vitro mutagenesis kit (Amersham Life Science, Arlington Heights, IL) ac-cording to the manufacturer’s instructions using the mutagenic oli-gonucleotide CATGATGCTGCACAAGTTCAAGAAC. BSXG1.-B3(R589C) was also made using Sculptor in vitro mutagenesis kit using the mutagenic oligonucleotide CCATGATGCTGTGCAAGT-TCAAGAAC. BSXG1.B3(S613F) was constructed using the Seam-less Cloning Kit (Stratagene USA, La Jolla, CA) according to the manufacturer’s instructions. The oligonucleotides CCACCTCTTCA-TTCATCCTGATCATGGTCCTG and CCACCTCTTCAGAAGAT-GGGGACCCCGAAGT were used in the protocol to PCR amplify the whole of BSXG1.B3 and introduce the S613F mutation as de-scribed (29). BSXG1.KB3 encodes the kidney isoform of AE1 which lacks the first 65 codons of erythroid AE1, so that the transla-tion product contains Met66 to the COOH terminus of erythroid
AE1. BSXG1.KB3(R589H), BSXG1.KB3(R589C), and BSXG1.KB3-(S613F), the kidney analogues of the erythroid AE1 mutants, were prepared by purifying the BstXI–XbaI fragments of the BSXG1.B3 mutants and substituting them for the corresponding fragments in BSXG1.KB3 (derived from a KB3 cDNA constructed by R. Beck-mann, University of Bristol). The sequences of the entire protein cod-ing regions of the constructs were confirmed to be correct uscod-ing an ABI 377 DNA sequencer or using the Sequenase 2.0 DNA sequenc-ing kit (USB) accordsequenc-ing to manufacturer’s instructions.
Expression of AE1 in Xenopus oocytes
The methods used for the preparation of AE1 cRNA and its expres-sion in Xenopus oocytes and the assay of chloride uptake into the oo-cytes have been described in detail previously (28, 30, 31). In sum-mary, capped cRNA was transcribed in vitro from the plasmids encoding the normal and mutant AE1s and kidney AE1s. Oocytes were injected with cRNA and allowed to express the protein for 24 h. at 188C. Anion transport induced in the oocytes was measured by comparing the uptake of 36Cl2 over a 20-min period by parallel
groups of 8–15 oocytes incubated in the presence and absence of 4,49 -dinitro-2,29-stilbene disulfonate (DNDS). The band 3-specific anion transport was estimated from the DNDS-sensitive chloride uptake into the oocytes.
Results
We examined the possibility that the erythroid AE1 gene was altered in autosomal dominant familial dRTA by studying the genomic DNA and red cells of four families affected with the condition (Fig. 1, A–D). Family A had three generations af-fected with dRTA. Nine afaf-fected members of the family were studied, together with four unaffected family members in the second generation, two unaffected family members related by marriage (A:I:2 and A:II:10) and several unrelated normal in-dividuals. Family B has been previously reported (16) to have dRTA in two generations (I and II in Fig. 1). We examined three affected siblings in generation II and two unaffected sib-lings in generation III. Only small samples of blood were avail-able from the two affected members in family C (Fig. 1), and they declined to give further blood samples which limited the red cell studies that could be done; the two other family mem-bers (C:II:1 and C:II:3) were unwilling to give samples for study. Two affected individuals in two generations of Family D were studied, together with four unaffected family members.
hap-lotype 6 in family D. The haplotyping results of all these fami-lies gave a lod score for dRTA vs D17S759 of 13.44 at theta 5 0. DNA samples from affected members of the three different families were typed on the same gel and no alleles were found in common.
Mutations in the AE1 (band 3) gene associated with dRTA.
We examined the genomic DNA of the members of the dRTA families for alterations in the AE1 gene. The exons of the AE1
gene were amplified using the polymerase chain reaction (PCR) and primers based on the AE1 gene sequence (13). The exons were scanned for mutations by single-strand conformational polymorphism (SSCP) analysis or DNA sequencing on both strands (two or more samples from affected individuals) in comparison with samples from unaffected family members or controls.
DNA sequencing of exon 14 showed that all the affected members of family A were heterozygous for a G→A mutation in exon 14 of the AE1 gene, at the position corresponding to nt 1766 of AE1 mRNA (numbered from the erythroid translation start codon). The mutation alters Arg589 of normal band 3 to
His (R589H). The unaffected members of the dRTA family
did not carry this mutation, and all were homozygous for the normal AE1 gene sequence (Table II). No other changes were found in the AE1 exons of the affected members of family A. Similar studies were carried out on the genomic DNA of fam-ily B. All the affected individuals of famfam-ily B were found to be heterozygous for the same Arg589→His (R589H) mutation in
the AE1 gene as was found in the affected members of family A (Table III). The unaffected members of the family were ho-mozygous for normal band 3.
Studies on the genomic DNA of the affected individuals in family C showed that both were heterozygous for a C→T mu-tation at the position corresponding to nt 1765 of AE1 cDNA which results in a Arg589→Cys(R589C) change in band 3
(Ta-ble III). This arginine residue is changed to histidine in af-fected members of families A and B, but here is mutated to cysteine. DNA from unaffected members of family C was not available for study.
[image:5.612.61.553.63.428.2]were heterozygous for a C→T mutation in exon 15 at the posi-tion corresponding to nt 1838 of AE1 cDNA, which results in the amino acid change Ser613→Phe (S613F). The unaffected
family members were all homozygous for the normal AE1 se-quence (Table IV).
We also examined the possibility that changes in the kidney promoter of the AE1 gene of the affected members of these
families might specifically reduce the transcription of kidney AE1 in these individuals without affecting red cell AE1 ex-pression. We sequenced a 913 bp region of the AE1 gene (13) containing the consensus transcription factor binding sites up-stream of the kidney promoter, TATA box and downup-stream sequence (extending from nt 78 from the 59 end of erythroid intron 3 to nt 31 from the 59 end of erythroid exon 4) of
af-Table II. Red Cell Sulfate Transport, DIDS Binding Sites and Band 3 Sequence of Family A
Family member
dRTA status
Sulphate transport activity (percent
of normal)
Number of DIDS binding sites
(per-cent of normal) Km (percent of normal) Vmax (percent of normal)
Altered amino acid residue
in band 3
A:I:1 dRTA 7461i 94 11567* 9062* R589→H
A:I:2 Normal 9962* 100 10664* 10562* R589
A:I:3 dRTA 8362§, 7562§, 8064§ 94, 95, 108 13666i, 144611§ 10366*, 10964* R589→H
A:II:1 Normal 9262‡ 97 9264* 9263* R589
A:II:2 Normal 9761* 89 10066* 10363* R589
A:II:3 dRTA 7262i, 7462i 101, 95 11869* 9363* R589→H
A:II:4 Normal 9661* 96 9664* 9463* R589
A:II:5 dRTA 7661i 93 123614* 9764* R589→H
A:II:6 dRTA 7265‡, 7964§ 101, 102 118611*, 14367i 9165*, 10163* R589→H
A:II:7 Normal 9564*, 9463* 104, 100 9066* 9165* R589 A:II:8 dRTA 8163§ 106 12766i, 13165§, 14467i 9365*, 10265*, 10763* R589→H
A:II:9 dRTA 7263i, 7463§, 7463i 90, 97, 100 14067i, 13368§ 9963*, 10265* R589→H
A:II:10 Normal 9563* 93 11263* 10165* R589
A:III:1 dRTA 6962i, 7964§ 103, 97 12866i 9163* R589→H
A:III:2 dRTA 7764i 96 12967§ 9463* R589→H
Mean affected (dRTA) 7664, n5 16 9865, n5 16 131610, n5 14 9866, n5 14 Mean unaffected 9562, n57 9765, n57 9968, n56 9866, n5 6
Sulfate transport activity, number of DIDS binding sites and apparent Km and Vmax for sulfate transport were determined as described in the legends
to Figs. 2 a and 3 a, respectively. Each value is the mean and standard error of the mean expressed as the percentage of the mean value obtained for the normal control cells in the experiment and was obtained by regression analysis of the data. Samples from some subjects were studied more than once. Statistical analysis of the significance of the difference between the results for the family samples and control samples was done using an un-paired, two-tailed Student’s t test on the two sets of data. The results of the statistical analysis are indicated by the following symbols: *P. 0.05; ‡P,
[image:6.612.57.555.73.313.2]0.05 . 0.01; §P, 0.01 . 0.001; iP# 0.001. n.t., not tested; R, arginine; H, histidine.
Table III. Red Cell Sulfate Transport, DIDS Binding Sites and Band 3 Sequence of Families B and C
Family member
dRTA status
Sulphate transport activity (percent
of normal)
Number of DIDS binding sites (percent of normal)
Km (percent
of normal)
Vmax (percent
of normal)
Altered amino acid residue
in band 3
B:II:2 dRTA 8063i 94 12567‡ 10163* R589→H
B:II:3 dRTA 7961i, 8065‡ 107, 99 12063‡ 9661* R589→H
B:II:4 dRTA 8064i, 7466‡ 97, 88 13064i 9861* R589→H
B:III:1 Normal 9366*, 9765* 103, 97 9464* 9562* R589
B:III:2 Normal 9565* 102 (n.t.) (n.t.) R589
Mean affected (dRTA) 7963, n55 9767, n5 5 12565, n53 9863, n5 3 Mean unaffected 9562, n5 3 10163, n53 94 95
C:I:1 dRTA 7862i 108 (n.t.) (n.t.) R589→C
C:II:2 dRTA 8263i 104 (n.t.) (n.t.) R589→C
Mean affected (dRTA) 80 106
Sulfate transport activity, DIDS binding sites and apparent Km and Vmax for sulfate transport were determined as described in the legends to Figs. 2 a
and 3 a and Table II. Samples from some subjects were studied more than once. Symbols for the results of statistical analysis are described in Table II.
[image:6.612.67.555.529.703.2]fected and unaffected members of the families. Although indi-viduals in some of the families were heterozygous for a g→a mutation 332 nts. from the 59 boundary of intron 3, the pres-ence of this mutation did not correlate with the disease. Thus while the unaffected individuals B:III:1 and D:II:3 and the dRTA patient D:I:1 were heterozygous for this mutation, the dRTA individuals A:I:3 and B:II:2 were homozygous for the normal sequence, as was the unaffected individual A:II:7 (see Fig. 1).
Anion transport properties of the red cells of dRTA individ-uals. The influx of [35S]sulfate into the red cells of the
mem-bers of each family was compared with that of red cells from normal control individuals bled at the same time. The results for family A are summarized in Table II. Typical results ob-tained from di-isothiocyanatostilbene disulfonate (DIDS) ti-tration studies of sulfate transport are shown in Fig. 2 a. The samples from the affected family members showed a consis-tently lower anion transport activity than the normal samples at each concentration of DIDS. Under the conditions used for the assay the very high affinity inhibitor DIDS stoichiometri-cally binds band 3 and titrates anion transport, so that the in-tercept with the sulfate influx axis measures the relative trans-port activity, while the intercept with the DIDS concentration axis measures the number of DIDS binding sites in the cells and hence the relative number of band 3 molecules in the red cell samples (25). The dRTA and normal control samples had similar numbers of band 3 molecules per red cell (Table II). The reduction in the sulfate transport into the red cells of the different dRTA individuals compared with the normal control samples measured at the same time was consistently observed in several experiments conducted on different occa-sions (7664% [mean6SEM]; n 5 16), while the combined re-sults from these experiments showed there was no difference in the number of band 3 molecules in the red cells of the dRTA and normal control red cells (9865%; n 5 16). In trast the unaffected members of the family did not show a con-sistent difference in anion transport from the normal controls (Table II) and the mean value obtained from several experi-ments was 9562% (n 5 7) of the control values. As expected the results of the DIDS titration experiments in Table II also show that the unaffected members of the family had levels of
red cell band 3 which did not differ significantly from control normal red cells (9765%; n 5 7).
Because of the very high affinity of DIDS for band 3, the conditions used for the experiment in Fig. 2 a cannot be used to examine whether there are small changes in the sensitivity of band 3 in dRTA red cells to stilbene disulfonate inhibitors (25). We therefore examined the sensitivity of sulfate trans-port in dRTA red cells to inhibition by the lower affinity in-hibitor, 4-acetamido-49-isothio-cyano-2,29-stilbene disulfonate (SITS), using red cells from patient A:II:8 and normal red cells. Although the dRTA red cells showed a lower uptake of sulfate than the control red cells when the same concentrations of SITS were present, the percentage inhibition of sulfate transport was found to be the same for the dRTA and control red cells over a range of SITS concentrations (data not shown). The apparent Km and Vmax for sulfate transport of the red
cells of affected and unaffected members of family A were measured in comparison with normal controls bled at the same time and are summarised in Table II. Typical results are shown in Fig. 3 a. The red cells from the three affected individuals ex-amined in this experiment showed a similar increase in appar-ent Km, but Vmax values very close to the control. The mean of
the results obtained with different family members (Table II) in several different experiments showed that the affected fam-ily members had an increase in the apparent Km for sulfate to
131610% (n 5 14) of the control samples measured at the same time, while the unaffected family members had normal
Km for sulfate (9968% of control; n 5 6). The mean of the Vmax values obtained for the affected family members was
9866% of the controls (n 5 14), and for the unaffected family members was 9866% of the controls (n 5 6), suggesting that this kinetic parameter is unchanged in both the affected and unaffected individuals in family A. The unaffected family members had kinetic constants that were not significantly dif-ferent from the control red cells.
[image:7.612.64.556.74.214.2]Similar sulfate transport experiments were carried out on the red cells of family B and the results are summarised in Ta-ble III. The results of DIDS titration on some affected and un-affected family members and control red cells are shown in Fig. 2 b. The mean of several experiments showed that the affected family members had sulfate transport reduced to
Table IV. Red Cell Sulfate Transport, DIDS Binding Sites and Band 3 Sequence of Family D
Family member
dRTA status
Sulphate transport activity (percent
of normal)
Number of DIDS binding sites (percent of normal)
Km (percent
of normal)
Vmax (percent
of normal)
Altered amino acid residue
in band 3
D:I:1 dRTA 25265i, 27368i 110, 109 2761i 7462i S613→F
D:I:2 Normal 10664* 102 (n.t.) (n.t.) S613
D:II:1 Normal (n.t.) (n.t.) (n.t.) (n.t.) S613
D:II:2 dRTA 24666i, 27569i 109, 105 2962i 7562i S613→F
D:II:3 Normal 10863*, 10265* 109, 100 9662* 9562* S613 D:II:4 Normal 10261*, 9765* 106, 100 9664* 9362* S613
Mean affected (dRTA) 262615, n5 4 10862, n5 4 28 74.5 Mean unaffected 10364, n5 5 10364, n55 96 94
Sulfate transport activity, DIDS binding sites and apparent Km and Vmax for sulfate transport were determined as described in the legends to Figs. 2 a
and 3 a and Table II. Samples from some subjects were studied more than once. Symbols for the results of statistical analysis are described in Table II.
7963% (n 5 5) of control red cells, but had similar band 3 con-tent (9767%; n 5 5) as the control red cells. The red cells of the affected individuals had an increased apparent Km for
sul-fate but normal Vmax (Table III and Fig. 3 b). The red cells of
the unaffected family members had sulfate transport and band 3 content similar to the normal control cells and the kinetic constants of the one unaffected family member tested were similar to the normal controls (Table III and Figs. 2 b and 3 b). Limited sulfate transport data were obtained from the red cells of the two affected members of family C, because of the small samples of blood available. DIDS titration (Fig. 2 c and Table III) showed that the red cells of both affected individu-als had reduced sulfate transport (mean 80% of control), and band 3 contents similar to the normal control.
The red cells of the affected members of family D showed sulfate transport characteristics which were quite different from those of the red cells of the other families studied. The
two affected individuals had a striking increase in sulfate trans-port activity (Fig. 2 d and Table IV). The mean of several ex-periments showed that the dRTA red cells had sulfate trans-port increased by 262615% (n 5 4) compared with the normal controls and band 3 content not significantly different from the controls (10862%; n 5 4). Measurement of the kinetic con-stants for sulfate transport (Fig. 3 c and Table IV) showed that the red cells of the affected individuals had a marked reduction in the apparent Km for sulfate (mean 28% of control) as well as
a smaller reduction in the Vmax for transport (mean 74.5% of
control), suggesting that the increased transport activity of the dRTA cells results from a much increased affinity for sulfate. The red cells of the unaffected family members had normal sulfate transport, band 3 content and normal kinetic constants (Fig. 2 d, Fig. 3 c, and Table IV).
[image:8.612.64.554.61.406.2]There are differences in the mechanism by which monova-lent and divamonova-lent anions are transported by band 3 (ref. 32), Figure 2. DIDS titration of sulfate influx into dRTA and normal samples. The influx of [35S]sulfate into the cells was measured at 10%
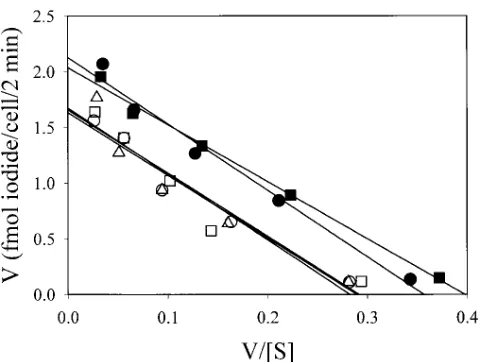
and it was desirable to examine whether the red cells of the af-fected members of family D showed a similar marked increase in monovalent anion transport. Since chloride uptake into red cells is too rapid to be conveniently measured, we measured the uptake of the more slowly transported anion, iodide, at 08C to estimate the monovalent anion transport activity in the cells (Fig. 4). Although there appeared to be a small increase in io-dide uptake into the dRTA cells, resulting from a small but sig-nificant increase in the Vmax for iodide transport to 125% of
the control, there was no change in the Km for iodide, in
con-trast to the substantial change in the Km for sulfate. The red
cells of the affected individuals in family D thus show very dif-ferent changes in transport characteristics for sulfate com-pared with iodide.
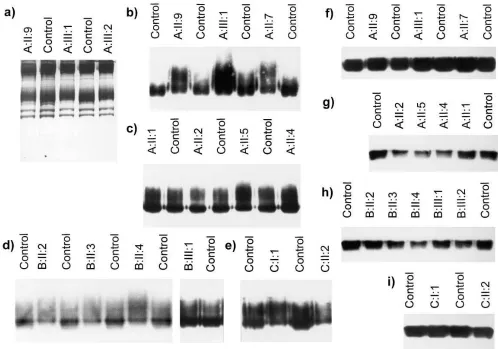
Band 3 in the dRTA red cell samples from some families has an altered mobility on SDS-PAGE. When the red cell mem-brane proteins of the dRTA patients from families A, B, and C were compared with normal controls after separation on SDS-PAGE, the mobility of band 3 was slightly slower in the dRTA samples compared with normal controls. The results for three affected family members from family A are shown in Fig. 5 a. The change in mobility is particularly noticeable when the mo-bilities of the leading edge of band 3 of the dRTA and normal samples are compared. All the affected members of family A showed a similar shift in mobility. Band 3 of unaffected mem-bers of family A all had normal mobility, with the exception of A:II:7 whose red cells showed a shift in mobility similar to that observed for the affected family members. SSCP analysis and DNA sequencing confirmed that A:II:7 had normal band 3 se-quence and the red cells of A:II:7 showed normal anion trans-port (Table II).
The relatively common band 3 polymorphism, band 3 Memphis (6), has a lower mobility than normal band 3 on SDS-PAGE (33), and it was important to establish that the ab-normal mobility of dRTA band 3 did not result from the pres-ence of this polymorphism. Band 3 Memphis can be readily distinguished from normal band 3 by chymotrypsin treatment of intact red cells. The resulting NH2-terminal proteolytic
frag-ment of band 3 migrates as a sharp 60-kD band in the case of normal band 3, but band 3 Memphis yields a fragment signifi-cantly larger (63 kD; ref. 33). Chymotrypsin treatment of the red cells of all the members of all the families (including the unaffected members) gave only the normal 60-kD NH2
-termi-nal chymotrypsin fragment of band 3 (data not shown). Since the NH2-terminal 60-kD chymotrypsin fragment was
[image:9.612.56.296.59.551.2]the same size in both affected and unaffected members of the family, we studied the COOH-terminal 35-kD chymotrypsin fragment to further localize the origin of the shift in SDS-PAGE mobility found in the intact band 3 of the dRTA sam-ples. Changes in SDS-PAGE mobility might also be expected to be accentuated in this smaller fragment. It is difficult to de-tect the rather diffuse 35-kD fragment band in Coomassie Blue-stained gels of erythrocyte membranes, so the fragment was visualized by immunoblotting using monoclonal antibody BRIC 155, which reacts with the COOH terminus of band 3 (14). Immunoblots using BRIC 155 of membranes from chy-motrypsin-treated red cells, showed that the leading edge of the 35-kD fragment of band 3 from the affected members of Figure 3. Sulfate influx into dRTA and normal red cells. The influx
of [35S]sulfate into the red cells was measured at 10% hematocrit in
isotonic citrate buffer pH 6.5 containing sodium sulfate concentra-tions between 40 and 0.4 mM. The tonicity of the buffer was main-tained constant by varying the concentration of sodium citrate. Sul-fate influx was determined after 5 min at a nominal temperature of 30°C. Each data point was derived from measurements in triplicate. The results are presented as Eadie-Hofstee plots with linear regres-sion analysis of the data. The results of statistical analysis of this data are included in Tables II–IV. Representative examples of experi-ments on samples from each family are shown. The results of the ex-periments in a, b, and c are not directly comparable as each experi-ment was done under slightly different conditions. (a) Samples from family A. dRTA red cells (A:II:9 [d], A:III:1 [j], A:III:2 [m]), unaf-fected family member red cells (A:II:10 [s]) and control red cells (h). (b) Samples from family B. dRTA red cells (B:II:2 [d], B:II:3 [j], B:II:4 [m]), unaffected family member red cells (B:III:1 [s]) and control red cells (h). (c) Samples from family D. dRTA red cells
family A migrated more slowly than the normal controls or the unaffected family members (Fig. 5, b and c). The distribution of material within the broad 35-kD fragment band in the sam-ples from affected individuals was also different from the nor-mal controls or unaffected members of the family. However as noted above, the 35-kD band 3 fragment from the unaffected individual A:II:7 was exceptional in that it showed a shifted mobility similar to that of the affected family members (Fig. 5 b). The 35-kD band 3 chymotrypsin fragment of the affected members in families B and C showed a shift in mobility similar to that observed with the affected members of family A (Fig. 5,
d and e), while the 35-kD fragment from the unaffected mem-bers of family B showed normal mobility. No samples were available from the unaffected members of family C.
In contrast to the results with families A, B, and C, the red cell membranes of both affected and unaffected members of family D showed no abnormality in the mobility of the intact band 3 or the 35-kD band 3 fragment of band 3 (data not shown).
Endoglycosidase treatment of red cells of the dRTA fami-lies. Band 3 carries a single, extensively branched N-glycan chain. The size of the carbohydrate chain is very heteroge-neous because varying numbers of N-acetyllactosamine repeat units are present in individual chains (34), and this size varia-tion gives rise to the characteristic diffuse migravaria-tion of band 3
on SDS-PAGE. The N-glycan chain is located on Asn642 in the
COOH-terminal 35-kD fragment produced by chymotrypsin digestion of red cells. We determined whether the altered mo-bility of the dRTA band 3 in families A, B, and C resulted from alterations in the N-glycan chain by examining the effect of digestion by PNGase F on the mobility of band 3. Endogly-cosidase treatment of detergent-solubilized membranes from chymotrypsin treated red cells gave a sharp 35-kD fragment band with the same mobility in both affected and unaffected members and normal control samples in all the families (Fig. 5,
f–i). This result suggests that the abnormal SDS-PAGE mobil-ity of the dRTA band 3 in families A, B, and C results from an alteration in the N-glycan chain. As expected both affected and unaffected samples gave the same sharp 35-kD band as normal samples when PNGase F digestion was done on the chymotrypsin-treated red cells of family D (results not shown).
The dRTA families have normal red cell glycophorin A (GPA). The band 3 in red cells which lack glycophorin A (En[a-] or Mk/Mk red cells) shows an increased relative
molec-ular mass on SDS-PAGE because its N-glycan chain is on av-erage longer than the N-glycan chain of band 3 from normal red cells (35–37). We immunoblotted dRTA red cell mem-branes with murine monoclonal antibody R1.3 which detects both glycophorin A (GPA) and glycophorin B, and two mono-clonal antibodies directed to different epitopes on glycophorin A (R18 and BRIC 163), to eliminate the possibility that the al-tered oligosaccharide chain in dRTA resulted from an abnor-mality in glycophorin A. The erythrocyte membranes from two dRTA samples from family A (A:I:3 and A:II:9) as well as the unaffected member with abnormal band 3 mobility (A:II:7) gave the normal pattern of immunostaining with all three anti-bodies, showing that all these red cells contained normal GPA and glycophorin B (results not shown). All the remaining af-fected and unafaf-fected members of families A, B, and D and C:I:1 were shown to have normal GPA by immunoblotting with BRIC 163 (data not shown). DNA sequencing of exons 2, 3, 4 and 5 of the GPA gene showed that A:I:3 had the normal sequence expected for the blood-group M form of GPA (24).
Expression of the dRTA mutant proteins in Xenopus oo-cytes. The Xenopus oocyte does not express endogenous band 3 and this system has been well characterized for the heterolo-gous expression of band 3 and measurement of band 3 func-tional activity (28, 30, 38). We constructed the R589H, R589C and S613F mutations in both intact erythroid AE1 and the NH2-terminally truncated kidney isoform of AE1 (KAE1).
Band 3-specific anion transport induced in the oocytes was es-timated measuring the difference in radioactive chloride up-take in the presence and absence of 4,49-dinitro-2,29-stilbene disulfonate (DNDS). This expression system allows measure-ment of the transport activity of the pure mutant proteins, whereas both mutant and normal proteins are present in dRTA red cells. It also allows measurement of the transport activity for chloride anions, which are more physiologically rel-evant than sulfate as a transport substrate in the kidney. This is of particular importance because of the differences in the mechanism of transport of the two anions by AE1, and the very different results obtained for the transport of sulfate and iodide by the red cells of family D, who are heterozygous for the S613F mutation.
[image:10.612.57.298.56.237.2]The uptake of chloride by the mutant AE1 proteins is shown in Fig. 6, A and B. Although AE1(R589H) showed trans-port activity reduced to 40% of wild-type AE1, the R589C and Figure 4.Iodide influx into red cells of family D and normal red cells.
The influx of [125I]iodide into the red cells was measured at 10%
he-matocrit in isotonic citrate buffer pH 7.4 containing between 60 and 0.4 mM sodium iodide, with the tonicity of the buffer kept constant by varying the sodium citrate concentration. Iodide influx was deter-mined after 2 min at 0°C. Each data point was measured in triplicate. The results are presented as Eadie-Hofstee plots with linear regres-sion analysis of the data. Family D dRTA red cells (D:I:1 [d], D:II:2 [j]), unaffected family D member red cells (D:II:4 [s]) and two con-trol red cells (h, n). The Vmax determined for the affected family
members D:I:1 and D:II:2 were 12866% and 12263%, respectively, of the control red cells (P , 0.05 and . 0.01 for both samples), with Km 10368% and 8864%, respectively, of the control red cells (P.
0.5 for both samples). The Vmax and Km of the unaffected family
S613F variants had chloride transport activity similar to the wild-type protein. The kidney (KAE1) isoforms of the mutant proteins also showed chloride transport activity. The chloride transport activity of the KAE1(R589H) and R589C variants did not show a statistically significant difference from the wild-type KAE1. The results with KAE1(S613F) suggest it may have slightly reduced chloride transport activity compared with wild-type KAE1. These experiments clearly demonstrate that both the erythroid and kidney isoforms of all the variant pro-teins associated with dRTA retain substantial chloride trans-port activity, although in the case of the AE1(R589H) variant this is reduced compared with the wild-type protein. The anion transport activity of all the variant AE1 proteins was also en-hanced by glycophorin A (GPA), as is the case for the wild-type protein (Fig. 6 A). GPA also enhanced the expression of the anion transport activity of both wild-type KAE1 and the KAE1 variants (Fig. 6 B).
We also measured the band 3-specific chloride transport activity induced in oocytes on co-expression of equal amounts of normal and some of the variant protein cRNAs. The results
for the AE1 isoforms of the R589H and R589C proteins and the KAE1 isoform of R589H (Fig. 6 C) show that the chloride transport activity resulting from co-expression of the wild type and these variant proteins did not differ significantly from that expected from the sum of the activity of the wild-type and vari-ant proteins expressed separately.
Discussion
[image:11.612.56.554.59.408.2]R589H in AE1, and the affected individuals in family D were heterozygous for the mutation S613F. The unaffected mem-bers of these families were all homozygous for the normal AE1 sequence and it is clear that in these families the presence of dRTA correlates with the AE1 mutation. The two affected members of family C studied were both heterozygous for the mutation R589C. Since samples from unaffected members of this family were not available for study, we cannot be certain that the disease is also associated with this AE1 mutation. However, it is very likely that this is the case, particularly in view of the fact that this arginine residue is the same as that al-tered in families A and B.
We also sequenced the DNA of members of families A, B, and D in the region of the promoter for kidney band 3 tran-scripts which is located in erythroid intron 3 of the AE1 gene (12, 13), since mutations in this region might specifically re-duce or abolish the expression of band 3 in the kidney without affecting expression in the red cell. Although some individuals were found to be heterozygous for a sequence change in eryth-roid intron 3 which has not been previously described, the presence of this mutation did not correlate with the presence of dRTA, suggesting it is an unrelated polymorphism. These results suggest the dRTA condition in these families does not result from reduced expression of AE1 transcripts in the kidney. Our failure to find a common haplotype for the marker in the two families (A and B) with identical R589H mutations does not support a founder effect, but certainly does not ex-clude a common origin for the mutation, especially since both families originated in the same part of the republic of Ireland. The genetic distance between AE1 and the marker tested is not known with precision. Since the work was completed it has been possible to obtain a slightly better estimate of the genetic position of AE1 from consideration of results published in the radiation hybrid transcript map (39). This placed the EST RA17959 (GenBank T91230), shown by sequence compari-son to be AE1, between the genetic markers D17S800 and D17S930, about 3 centimorgans (cM) apart on the Genethon map (40). Reference to the integrated map on the location da-tabase (http://cedar.genetics.soton.ac.uk/public_html) suggests that D17S579 lies within this interval, probably within z 1 cM of AE1, but the map order is unknown. More detailed study of the region would be necessary to confirm or refute a founder effect for the identical mutation in these two families.
Changes in red cell anion transport associated with autoso-mal dominant dRTA. We examined the band 3-mediated an-ion exchange properties of the red cells of affected individuals in families with dRTA to help us determine the transport properties of the mutant proteins. This might illuminate how the disease was related to alterations in the band 3 HCO32/Cl2
exchanger in the kidney. The sulfate transport activity of the red cells of the affected family members consistently differed from that of unaffected family members and unrelated control samples, although the nature of the sulfate transport change depended on the family studied. The affected members of fam-ilies A, B, and C all showed red cell sulfate transport reduced to 75–80% compared with the unaffected members and con-Figure 6. Chloride influx into Xenopus oocytes after expression of
normal and kidney isoforms of variant AE1s. Xenopus oocytes were injected with in vitro transcribed cRNAs indicated in the Figure and the band 3-specific transport induced was estimated by measuring the DNDS-sensitive chloride influx as described in Methods. The results are expressed as the percentage of the chloride influx obtained using oocytes injected with the same amount of the appropriate normal AE1 control. The error bars represent the standard errors of the mean. The symbols above the bars show the statistical significance of the difference between the results obtained from the mutant and nor-mal proteins as assessed by unpaired 2-tailed Student’s t tests. 1P .
0.05; *P , 0.05 and . 0.01; ***P , 0.001. In the experiments where the constructs were coinjected with GPA cRNA, the appropriate nor-mal AE1 coinjected with GPA cRNA was used as the basis for the comparison. (A) Chloride influx induced in oocytes by expression of erythroid isoforms of variant AE1 constructs (R589H, R589C and S613F) compared with normal erythrocyte AE1 (N). Experiments in which GPA was also coinjected are indicated by 1GPA. 1 ng of each AE1 cRNA was injected per oocyte, and when GPA was co-expressed 1 ng GPA cRNA was also injected per oocyte. (B) Chlo-ride influx induced in oocytes by expression of kidney isoforms (KAE1) of variant AE1 constructs (KR589H, KR589C) compared with normal kidney KAE1 (K). Experiments in which GPA was also coinjected are indicated by 1GPA. 1 ng of each KAE1 cRNA was in-jected per oocyte, and when GPA was co-expressed 1 ng GPA cRNA was also injected per oocyte. (C) Chloride influx (relative to the ap-propriate normal erythroid or kidney AE1 control) induced in oo-cytes by co-expression of variant erythroid AE1 (R589H or R589C) or variant kidney KAE1 (KR589H) with an equal amount of the cor-responding normal erythroid (N) or normal kidney (K) AE1. O rep-resents the experimentally observed chloride influx, and E is the ex-pected chloride influx calculated from the average of the measured influxes obtained when an equal amount of each cRNA was ex-pressed alone. cRNAs were each injected at a concentration of 0.5 ng/
[image:12.612.57.296.54.386.2]trol red blood cells. An increased apparent Km for sulfate was
found for the affected members of families A and B, suggest-ing that the decreased transport results from a decreased affin-ity of the altered AE1 for sulfate.
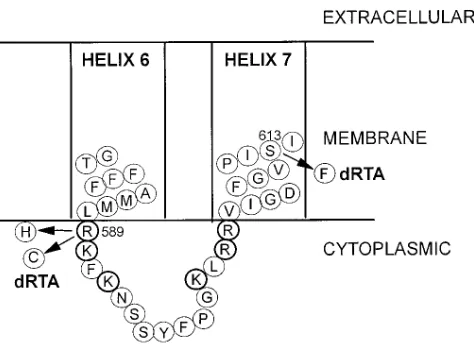
The amino acid altered in these families (Arg589) is located
in the cytoplasmic loop between transmembrane segments 6 and 7 of band 3 (Fig. 7). This arginine is conserved in all the known vertebrate sequences of the AE gene family (AE1, AE2, and AE3), suggesting it is functionally important. Arg589 is
lo-cated in a cluster of basic residues (Fig. 7), which may form part of the cytoplasmic anion binding site of band 3 (41). The immediately adjacent amino acid residue (Lys590) has an
un-usually low pK, probably because of the large number of basic residues surrounding it, and can be specifically labeled at neu-tral pH with phenyl isothiocyanate (41) . The covalent modifi-cation of this lysine residue is accompanied by inhibition of an-ion transport, suggesting that it might have a role in the anan-ion transport process (42). The R589H and R589C mutations may raise the pK of Lys590 by reducing the number of positive
charges surrounding the lysine residue, and thus affect the transport mechanism. In addition, the mutation may change the binding affinity for sulfate and thus give rise to the in-creased apparent Km for sulfate observed in the red cell
trans-port studies.
In contrast, the S613F mutation in family D results in a very marked increase in red cell sulfate transport, resulting from a large decrease in the apparent Km for sulfate. The mechanism
by which this mutation increases the affinity of the protein for sulfate is not clear. One possibility is that the mutation, which is located near the center of membrane span 7 (Fig. 7) and re-sults in the substitution of serine by a bulky phenylalanine res-idue, alters the orientation of membrane span 7 relative to span 6. This may distort the conformation of the cytoplasmic loop between spans 6 and 7 which contains the putative anion binding site (Fig. 7) so that the clustered basic residues bind sulfate more tightly than the wild-type protein. While the S613F mutation shows a dramatic change in sulfate transport, there was little change in the transport parameters for the monovalent anion iodide, suggesting that the binding site for
monovalent anions is largely unaffected by the mutation. The R589H and R589C mutants also change the cytoplasmic loop between membrane spans 6 and 7, and alterations in this re-gion of the protein may have an important role in the mecha-nism of dRTA.
The erythroid and kidney isoforms of the expressed mutant AE1 proteins retain chloride transport activity. Although the changed kinetic constants for anion transport in the dRTA red cells suggest that the mutant proteins are expressed at the red cell surface, we could not directly measure the relative abun-dance of the variants compared with the normal protein in the red cells to estimate their transport activity. In addition, we measured the red cell transport activity for the slowly trans-ported divalent anion, sulfate, because the very high monova-lent anion transport activity of red cells makes it difficult to measure the transport of a physiologically relevant monova-lent anion such as chloride. The different effects of the S613F mutation on sulfate and iodide transport made it desirable to measure the transport activity of the mutant proteins towards chloride. We therefore expressed the mutant proteins by themselves in Xenopus oocytes and measured their ability to induce band 3-specific chloride transport. The erythroid forms of the R589C and S613F mutant proteins showed normal chlo-ride transport activity, while the activity of the R589H mutant was reduced. Constructs encoding the mutant kidney isoforms were also expressed and these gave chloride transport activi-ties similar to the normal kidney isoform. Although there were some quantitative differences between the activities of the variant and normal proteins, it is important to note that both the erythroid and kidney isoforms of all the mutant proteins retained substantial chloride transport activity. The data also demonstrate that all the mutant proteins are expressed at the oocyte cell surface, as expected from the indirect evidence that the mutant proteins are expressed in the red cell membrane. Overall the results are consistent with the data on the trans-port activity of the mutant red cells, bearing in mind that the mutations may have different consequences on chloride and sulfate transport, as noted above for the iodide and sulfate transport activity of the S613F mutation. It is clear that the kidney isoforms of the mutant proteins can move to the cell surface of oocytes. It is very likely they can also move to the surface of renal a-intercalated cells, although, unlike oocytes, the latter are polarized cells.
GPA enhances the expression of AE1-specific anion trans-port in Xenopus oocytes by facilitating the movement of AE1 to the cell surface, and it is suggested to have the same role in red blood cells (28). What role, if any, GPA plays in band 3 movement to the cell surface in the a-intercalated cells of the kidney is unknown. Our experiments demonstrate that the chloride transport activity of all the variant AE1 proteins and the corresponding KAE1 isoforms was enhanced by GPA, suggesting that GPA also facilitates the movement of these proteins to the oocyte cell surface.
[image:13.612.59.296.509.681.2]Since band 3 is present in the red cell membrane as an oligo-mer, and the dRTA patients are heterozygous for both the type and variant proteins, it was possible that the wild-type and variant proteins could influence the activity of each other when they were present together in hetero-oligomers. We examined this question with the AE1 isoforms of the R589H and R589C variants and the KAE1 isoform of the R589H mutant. Co-expression of the normal and variant pro-teins yielded levels of chloride transport activity similar to that Figure 7. Amino acid sequence of band 3 around the dRTA
expected from the sum of the activities of the wild-type and variant proteins expressed separately, suggesting that the wild-type and variant proteins tested do not have a major effect on the activity of each other.
Altered red cell band 3 N-glycan chain associated with the R589H and R589C dRTA mutations. The red cells of the af-fected members of families A–C showed an increase in the av-erage size of the poly N-acetyllactosamine-containing N-gly-can chain, which was not present in the unaffected family members (with the exception of A:II:7, see below). Abnormal elongation of the band 3 oligosaccharide chain due to the pres-ence of additional N-acetyllactosamine repeating units occurs when glycophorin A is absent from red cells (in En[a-] and Mk/
Mk red cells; 35–37). The enzymes responsible for the addition
of the N-acetyllactosamine units are located in the trans-most region of the Golgi system (43), and when GPA is absent band 3 probably remains longer in the Golgi complex during its movement to the plasma membrane (37). However, the red cells of families A, B, and C all contain normal GPA. The al-tered structure of the band 3 N-glycan chain in the affected members of these families also very likely reflects a change in the processing of the N-glycan chain and the biosynthetic path-way of band 3 as a consequence of the mutation of Arg589.
Unlike the other five unaffected individuals in families A and B, A:II:7 showed an altered N-glycan chain similar to that found in the dRTA samples in these families. A:II:7 has nor-mal AE1 sequence and nornor-mal red cell anion transport as well as normal GPA and GPB. This change also reflects altered processing of the band 3 N-glycan during band 3 biosynthesis in the erythroid cells of A:II:7 but its cause is unknown. It ap-pears to be restricted to the branch of family A containing A:II:7 and may originate from her deceased father.
Autosomal dominant familial dRTA does not result simply from a change in AE1 HCO32/Cl2 anion exchange activity.
We were originally prompted to carry out this study because of the possibility that there was an association between dRTA and hereditary ovalocytosis. This was suggested from the re-port of a Filipino family with both syndromes by Baehner et al., (44) and because one of us had seen three unrelated patients in Malaysia with both dRTA and ovalocytosis (Wrong, O., un-published observations). The best characterized form of he-reditary ovalocytosis (Southeast Asian ovalocytosis, SAO) re-sults from the heterozygous presence of an abnormal band 3 (band 3 SAO) that has a deletion of residues 400–408, and gives rise to abnormally rigid red cells (6). Band 3 SAO is mis-folded in the membrane and can no longer transport anions, so that the red cells of SAO individuals have only about half the normal anion transport activity (25). It is clear that the families affected with dRTA studied here have mutations in band 3 which differ from band 3 SAO. Indeed, an individual with SAO (confirmed to be heterozygous for band 3 SAO; ref. 45) showed a normal ability to acidify urine and thus no evidence of dRTA (Bruce, L.J., P.S. Low, M.J.A. Tanner, R. Unwin, and O. Wrong, unpublished observations).
Both the erythroid and kidney isoforms of the expressed dRTA variant band 3 proteins show levels of chloride trans-port activity similar to that of normal band 3. This suggests that the transport activity of band 3 in the kidney intercalated cells of the dRTA patients is probably unchanged. The least active variant, R589H, has activity reduced to about half of the normal protein. If it is assumed that the dRTA individuals ex-press equal amounts of normal and variant proteins, chloride
transport would only be reduced by z 25% in these cells, even in this case. It is difficult to see how the relatively small reduc-tion in anion transport activity in these individuals heterozy-gous for the dRTA mutation should itself give rise to the dom-inant effect and result in the dramatic loss in acid-secreting capacity in the renal tubular cells. As indicated above, SAO in-dividuals, who are heterozygous for a transport-inactive form of band 3 and show z 40% of normal red cell anion transport (25), are not known to have impaired urinary acidification. Similarly, many mutations in band 3 are known which lead to hereditary spherocytosis, because the mutant band 3 is not in-corporated into the red cell membrane (46). The red cells of these patients, who are heterozygous for the mutations, con-tain significantly decreased amounts of band 3 and show about half normal red cell sulfate transport (47), but these individu-als have not been reported to show any defect in urinary acidi-fication. In these cases reduction of band 3 transport activity to half normal or less does not result in dRTA. However, the complete absence of band 3 appears to result in defective renal acid secretion in cattle (48, 49), although it has not been re-ported whether a similar situation occurs in band 3-deficient mice (50).
We conclude that the disease in the dRTA families we have studied is not related simply to the anion transport activity of the mutant proteins. At present we can only speculate on the mechanism leading to the disease and its autosomal dominant inheritance in these families. The dominant effects of the mu-tations on acid secretion might be explained if the mutant pro-tein formed a membrane ion shunt that dissipated the ionic gradients necessary for the net movement of acid across the renal tubular cell, and there are several possible ways by which this might occur. For example, if the mutant protein was mis-targeted to the apical membrane, rather than the basolateral membrane where the normal protein resides, bicarbonate efflux into the tubular lumen by the mutant protein could neutralize the protons pumped by the apical H1-ATPase, so that there is
no net transfer of hydrogen ions. Retargeting of AE1 from the basolateral to the apical membrane is suggested to occur dur-ing the conversion of acid-secretdur-ing a-intercalated cells to bi-carbonate-secreting b-intercalated cells (51). Equally, since the wild-type and mutant band 3 are likely to form heterolig-omers, the presence of the mutant protein might also alter the normal basolateral targeting of the wild-type protein. Alterna-tively, the dRTA mutations could change the obligatory ex-change transport activity of band 3 to a membrane channel or leak. Channel activity, as distinct from exchange transport ac-tivity, has been observed with trout AE1 (52). All these possi-bilities require further investigation.
The underlying mechanisms responsible for dRTA are likely to be different in different forms of the disease (3). The commonest form of dRTA is the one associated with multiple systemic autoimmune diseases and hypergammaglobulinemia, which has a slightly different phenotype from familial dRTA in that the condition is confined to post-pubertal women, and hypokalemia is more frequent and more severe (15). Renal bi-opsy of three of these patients, all with Sjögren’s syndrome, has shown that their distal nephron intercalated cells do not stain for H1-ATPase. The same cells from two of the patients
also did not stain for band 3 (53–55). We have no renal biopsy data from the present study as the dRTA patients would not agree to this procedure.