© 2016, IRJET | Impact Factor value: 4.45 | ISO 9001:2008 Certified Journal | Page 1388
Utilization of Buffer size by modifying Spray and Wait protocol in
VDTN
Sonal B. Gandhi
1, Prof. Vyomal N. Pandya
2, Dr. Prashant M. Dolia
31
Electronics and Communication Dept, L.D. College of Engineering, Ahmedabad, Gujarat, India.
2
Electronics and Communication Dept, C. K. Pithawalla College of Engineering and Technology, Surat,
Gujarat, India.
3
Department of Computer Science and Applications, Bhavnagar University, Bhavnagar, Gujarat, India.
Abstract
—VDTNs have dynamic topology due to vehicles’speed; transfer depends on opportunity and small contact duration. Routing in such sparse and opportunistic network is challenging task as it has direct effect on the performance of network. In Spray and Wait protocol, source node transfers X message copies to first X encounter nodes. Then these X nodes goes into wait phase for direct transmission to its destination. It has two modes: Normal mode and Binary mode. The aim of this paper is to enhance the performance of network by modifying existing binary spray and wait routing protocol in terms of main three parameters: Delivery probability, overhead ratio and latency.In this paper we offer proposed flow chart and algorithm for modified spray and wait protocol. The modifications are done based on ratio of number of message copies at sender/relay nodes and encountered nodes. For analysis, series of simulations are done in ONE simulator with version of 1.4.1.Key Words: VDTN, Spray and Wait, ONE simulator
I.INTRODUCTION
VDTNs are partitioned and sparse networks where communication is depend on contact opportunities.Routing in such opportunistic environment is challenging task that has direct effect on overall performance of the network.
Characteristics of routing protocol for Opportunistic networks:
It should create less contention under high traffic.
It should have high delivery probability than other single and multi-copy based routing protocols.
It should be highly ascendable, means maintain its performance regardless of changes in network parameters.
Require as little network information as possible, for implementation.
Spray and wait protocol is simple and proficient and justifies all above goals. It is based on flooding strategy. It creates X number of message copies. Where, X is the number of nodes in the network.
It has two modes: Normal mode and Binary mode.
(1)Spray and Wait Normal mode: Spray and Wait Routing consists of the following two phases: It is based on two Phases, Spray phase and Wait phase. In Spray phase the Sender forwards X message copies to the first X nodes and comes into Wait phase. In Wait phase all nodes with a single message copy attempts for direct transmission to the destination node.
(2)Spray and Wait Binary mode: In this mode, the source node starts with Xmessage copies; any node A that has m > 1 message copies (source or relay), and makes a contact with another node B that has no message copy. Than node A gives m/2 copies to node B and keeps m/2 for itself. Whenever it has only one copy, it shifts to direct transmission.
The Spray and Wait Protocol accomplishes to expressively reduce the transmission overhead of flooding -based techniques and have superior performance with respect to delivery probability in most network scenarios. This is mostly marked when conflict for the wireless network is high. Further, it does not have need of any network information and past encounters history.
II. MODIFIED SPRAY AND WAIT PROTOCOL
© 2016, IRJET | Impact Factor value: 4.45 | ISO 9001:2008 Certified Journal | Page 1389 between Binary spray and wait routing protocol and
modified spray and wait protocol.
As already mentioned in previous section, In Binary spray and wait protocol the source node initially starts with X number of message copies. When it make a contact with first node(no copies) then it gives 50% (X/2) message copies to that node and keeps 50% (X/2) message copies for itself. This process is repeated until the node is left single message copy, then it goes into wait phase and wait for the direct delivery to its destination.
In modified spray and wait protocol, this 50-50 % ratio in binary spray and wait is replaced with 65-65% and 75-75% ratios. Detailed information about this modification is provided in below section. Due to this modification, dissemination more number of message copies can be achieved in network for each new created message. So, there are more chances of successful delivery. Hence, this will increase the delivery probability.
III. ALGORITHM AND FLOWCHART
This section contains detailed information regarding algorithm for both 65-65% modification ratio and 75-75% modification ratio and flowchart is given in below.
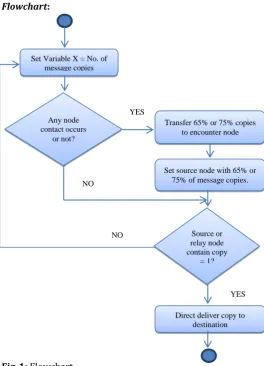
Algorithm:
1) Set initial number of copies (X)
2) Check any node contact occurs or not? 3) If yes
Transfer 65% or 75% of X number of message copies to contact node and Set source node with 65% or 75% of message copies.
4) Else
Go to step 5
5) Check if source/relay node is left with only one message copy (=1) or not?
6) If yes
Direct deliver the message copy to destination. 7) Else
Repeat steps from 2 to 5
The modified spray and wait protocol-1 (modified with 65-65 % ratio) and modify spray and wait protocol-2 (modified with 75-75 % ratio) both have changes in program that based on java. In the first step, before transfer take place source/relay node with X no. of message copies, stored into variable. Then check whether node contact occurs or not? If contact is done then gives 65% or 75% message copies to the encounter node and set variable with 65 % or 75 % of X. So, by this way both
source/relay node and encounter node both have 65% or 75% message copies.
Flowchart:
Fig-1: Flowchart
IV.SIMULATION RESULTS
Simulation Setup parameters are given in below table. There are two scenarios, in scenario-1 number of moving nodes (vehicles) are vary by [250,300,350,450] and number of message copies are fixed by 12. In scenario-2 number of copies are vary by [scenario-2,4,6,8,10,1scenario-2,14,16,18,scenario-20] and number of nodes are fixed by 350.
Table- 1: Simulation Parameters
Parameters Value
Simulation Time 25000 sec
No. of Nodes 1[250.300,350,450], Scenario-2[fixed by 350]
Interface Bluetooth, WiFi simple, WiFi High-speed
Interface Type Simple Broadcast Transmit speed Bluetooth- 3 Mbps
Set Variable X = No. of message copies
Any node contact occurs
or not?
Direct deliver copy to destination Set source node with 65% or
75% of message copies. Transfer 65% or 75% copies
to encounter node
Source or relay node contain copy
= 1? YES
NO
NO
[image:2.595.305.570.130.497.2]© 2016, IRJET | Impact Factor value: 4.45 | ISO 9001:2008 Certified Journal | Page 1390
WiFi simple- 11 Mbps WiFi High-speed- 50 Mbps Transmit Range Bluetooth- 10 m
WiFi simple- 70 m WiFi High-speed- 150 m Movement Model ShortestPathMapBased Movement
Buffer Size 20 MB
Routing Protocols Binary Spray and Wait, Modified spray and wait protocol 65-65% and 75-75% No. of message copies Scenario-1[12 copies],
Scenario-2 [2,4,6,8,10,12,14,16,18,20] Message Size 500 KB to 1 MB
Message Interval 25 to 35 sec
Message TTL 300 minutes
The results of two scenarios are shown in form of graphs as below.
Results of Scenario-1:
It can be clearly seen from Fig.2 that for different number of nodes, modified spray and wait protocol gives excellent probability compare to binary spray and wait protocol.
Fig-2: Delivery Probability vs. No. of nodes graph for comparison between existing Binary spray and wait and Modified Spray and wait protocols
As shown in Fig.3, we can notice that overhead ratio increases with nodes increases. Modified Spray and Wait protocol with 75-75% ratio has high overhead ratio than other two protocols for each number of nodes.
Average Latency reduces with number of nodes increases for modified spray and wait protocol with both ratios as shown in Fig.4. However, Modified spray and wait protocol with 75-75% ratio provides less latency as compare to other two protocols.
Fig-3: Overhead Ratio vs. No. of nodes graph for
comparison between existing Binary spray and wait and Modified Spray and wait protocols
Fig-4: Average Latency vs. No. of nodes graph for comparison between existing Binary spray and wait and Modified Spray and wait protocols
Results of Scrnario-2:
From the graph and data table for delivery probability as shown in Fig.5 and Table 2 respectively, the value that obtained for 16 copies in binary spray and wait protocol, that exactly same value we can get for 12 copies in 65-65% ratio and for 6 copies in 75-75% ratio.
Fig-5: Delivery Probability vs. No. of Msg copies graph for comparison between existing Binary spray and wait and Modified Spray and wait protocols
0.9 0.92 0.94 0.96 0.98 1
250 300 350 450
D
e
liv
e
ry
Pr
o
b
ab
ili
ty
No. of nodes
Binary SnW
Modified SnW(65-65%)
Modified SnW(75-75%)
0 10 20 30 40 50 60 70
250 300 350 450
Ov
er
h
ead
r
ati
o
No. of nodes
Binary SnW
Modified SnW(65-65%)
Modified SnW(75-75%)
500 700 900 1100 1300 1500 1700
250 300 350 450
A
ver
age
Lat
ency
No. of nodes
Binary SnW
Modified SnW(65-65%)
Modified SnW(75-75%)
0.7 1.2 1.7 2.2 2.7 3.2
2 4 6 8 10 12 14 16 18 20
D
el
iv
er
y
P
rob
abil
ity
No.of Msg Copies
Modified SnW(75-75%)
Modified SnW(65-65%)
© 2016, IRJET | Impact Factor value: 4.45 | ISO 9001:2008 Certified Journal | Page 1391
Table- 2:Delivery Probability vs. No. of Msg copies graph for comparison between existing Binary spray and wait and Modified Spray and wait protocols
No. of message
copies
Delivery Probability
Binary SnW Modified SnW(65-65%)
Modified SnW(75-75%)
2 0.7414 0.7412 0.7414
4 0.8619 0.8720 0.9244
6 0.9103 0.8720 0.9457
8 0.9244 0.9244 0.9563
10 0.9386 0.9244 0.9563
12 0.9410 0.9457 0.9646
14 0.9421 0.9457 0.9646
16 0.9457 0.9457 0.9634
18 0.9516 0.9563 0.9634
20 0.9528 0.9563 0.9610
Fig-6: Overhead Ratio vs. No. of Msg copies graph for comparison between existing Binary spray and wait and Modified Spray and wait protocols
From the graph and resultant data table for overhead ratio, it can be seen that as number of message copies increases overhead ratio also increase for all three protocols (existing binary spray and wait, modified 65-65%, modified 75-75%). The same thing is also happened in case of overhead ratio as shown in data table 3.
Table- 3: Overhead ratio vs. No. of Msg copies graph for comparison between existing Binary spray and wait and Modified Spray and wait protocols
No. of message
copies
Overhead Ratio
Binary SnW Modified SnW(65-65%)
Modified SnW(75-75%)
2 1.3471 1.3471 1.3471
4 3.4644 3.4644 7.5019
6 5.4475 3.4644 15.6017
8 7.5019 7.5019 31.6235
10 9.4528 7.5019 31.6235
12 11.5031 15.6017 63.1248
14 13.5689 15.6017 63.1248
16 15.6017 15.6017 125.8664
18 17.5310 31.6235 125.8664
20 19.5366 31.6235 218.4177
Fig-7:Average Latency vs. No. of Msg copies graph for comparison between existing Binary spray and wait and Modified Spray and wait protocols
According to the graph and data table for Average Latency, it can be seen that as number of message copies increases latency reduces, for all three protocols (existing binary spray and wait, modified 65-65%, modified 75-75%).Here also, The same thing happened, as shown in data table 4.
Table- 4: Average Latency vs. No. of Msg copies graph for comparison between existing Binary spray and wait and Modified Spray and wait protocols
No. of message
copies
Average Latency
Binary SnW Modified
SnW(65-65%) Modified SnW(75-75%)
2 4323.1783 4323.1783 4323.1783
4 2977.6466 2977.6466 1825.2248
6 2247.3982 2977.6466 1274.9900
8 1825.2248 1825.2248 1007.5519
10 1647.6340 1825.2248 1007.5519
12 1476.6625 1274.9900 889.2558
14 1355.3596 1274.9900 889.2558
16 1274.9900 1274.9900 852.7157
18 1206.8300 1000.5519 852.7157
20 1166.3371 1000.5519 921.9730
0 50 100 150 200 250 300
2 4 6 8 101214161820
Ov
e
rh
e
ad
R
atio
No. of Msg Copies
Modified SnW(75-75%)
Modified SnW(65-65%)
Binary SnW
500 1000 1500 2000 2500 3000 3500 4000 4500
2 4 6 8 10 12 14 16 18 20
A
ver
ag
e
La
te
n
cy
No. of Msg Copies
Modified SnW(75-75%)
Modified SnW(65-65%)
© 2016, IRJET | Impact Factor value: 4.45 | ISO 9001:2008 Certified Journal | Page 1392
V. CONCLUSION
By evaluating results of comparison between binary spray and wait protocol and modified spray and wait protocols (65-65% and 75-75% ratio) , we can be conclude that modified spray and wait protocol for both ratios gives higher probability, lowest overhead ratio and small value of latency for less number of message copies. That means it requires less memory i.e. reducing buffer size.
REFERNCES
[1] Chintan B. Desai, Mr. Vyomal N. Pandya, and Dr.
Prashant M. Dolia, “Comparative Analysis Of Different Routing Protocols In Delay Tolerant Networks”, , IJCSET ,2013
[2] Paulo Rogerio Pereira, Member, IEEE, et.al “From
Tolerant Networks to Vehicular Delay-Tolerant Networks”, IEEE Communications Surveys & Tutorials, Vol. 14, No. 4, Fourth Quarter 2012, Page No.-1166-1182
[3] Nabil Benamar, “Are VDTN Routing Protocols
Suitable For Data Collection In Smart Cities: A Performance Assessment “, Journal of Theoretical and Applied Information Technology, 2013
[4] Chintan B. Desai, Vyomal N. Pandya, “A Survey on
Knowledge Based Classification of Different Routing Protocols in Delay Tolerant Networks” , IJCSMC, Vol. 2,pg.83 – 88, March 2013
[5] Ari Keränen, “The ONE Simulator for DTN Protocol
Evaluation”, Helsinki University of Technology (TKK), Copyright 2009 ICST ISBN 978-963-9799-45-5.
[6] “A DTN Study: Analysis of Implementations and Tools”,
available at www.imm.dtu.dk, ISSN 0909-3192, 2010. [7] QaisarAyubet.al.,“The optimization of Spray and
Wait routing Protocol by prioritizing the message forwarding order” International Journal of Innovation and Applied Studies ISSN 2028-9324 Vol. 3 No. 3 July 2013, pp. 794-801.
[8] Vyomal N. Pandya, Dr.PrashantDolia, Sharmila N.
Rana,” Modification in Spray and Wait Protocol for VDTN”, International Conference on Electrical, Electronics, Signals, Communication and Optimization (EESCO) – 2015
[9] Sharmila N. Rana, “PERFORMANCE ANALYSIS
AND PERFORMANCE ENHANCEMENT OF VEHICULAR DELAY TOLERANT NETWORK (VDTN)”, A Thesis submitted to Gujarat technological university, June 2014.
[10] Sonal B. Gandhi, “Performance Evaluation of
various Routing Protocols in VDTN”, A Thesis