M E T H O D O L O G Y
Open Access
Understanding the cluster randomised
crossover design: a graphical illustration of
the components of variation and a sample
size tutorial
Sarah J. Arnup
1, Joanne E. McKenzie
1, Karla Hemming
2, David Pilcher
3,4,5and Andrew B. Forbes
1*Abstract
Background:In a cluster randomised crossover (CRXO) design, a sequence of interventions is assigned to a group, or‘cluster’of individuals. Each cluster receives each intervention in a separate period of time, forming‘cluster-periods’. Sample size calculations for CRXO trials need to account for both the cluster randomisation and crossover aspects of the design. Formulae are available for the two-period, two-intervention, cross-sectional CRXO design, however implementation of these formulae is known to be suboptimal. The aims of this tutorial are to illustrate the intuition behind the design; and provide guidance on performing sample size calculations.
Methods:Graphical illustrations are used to describe the effect of the cluster randomisation and crossover aspects of the design on the correlation between individual responses in a CRXO trial. Sample size calculations for binary and continuous outcomes are illustrated using parameters estimated from the Australia and New Zealand Intensive Care Society–Adult Patient Database (ANZICS-APD) for patient mortality and length(s) of stay (LOS).
Results:The similarity between individual responses in a CRXO trial can be understood in terms of three components of variation: variation in cluster mean response; variation in the cluster-period mean response; and variation between individual responses within a cluster-period; or equivalently in terms of the correlation between individual responses in the same cluster-period (within-cluster within-period correlation, WPC), and between individual responses in the same cluster, but in different periods (within-cluster between-period correlation, BPC).
The BPC lies between zero and the WPC. When the WPC and BPC are equal the precision gained by crossover aspect of the CRXO design equals the precision lost by cluster randomisation. When the BPC is zero there is no advantage in a CRXO over a parallel-group cluster randomised trial. Sample size calculations illustrate that small changes in the specification of the WPC or BPC can increase the required number of clusters.
Conclusions:By illustrating how the parameters required for sample size calculations arise from the CRXO design and by providing guidance on both how to choose values for the parameters and perform the sample size calculations, the implementation of the sample size formulae for CRXO trials may improve.
Keywords:Cluster randomised, Crossover, Sample size, Intracluster correlation, Within-period correlation, Between-period correlation, Components of variability
* Correspondence:[email protected]
1School of Public Health and Preventive Medicine, Monash University, The Alfred Centre, Melbourne, VIC 3004, Australia
Full list of author information is available at the end of the article
Background
Individually randomised trials are considered the ‘gold standard’for evaluating medical interventions [1]. How-ever, situations arise where is it necessary, or preferable, to randomise clusters of individuals, such as hospitals or schools, rather than the individual patients or students, to interventions [2, 3]. A cluster randomised trial will generally require a larger sample size compared with an individually randomised trial to estimate the interven-tion effect to the same precision [4].
In a two-period, two-intervention, cluster randomised crossover (CRXO) design, each cluster receives each of the two interventions in a separate period of time, lead-ing to the formation of two ‘cluster-periods’. In a cross-sectional design, each cluster-period consists of different individuals, while in a cohort design, each cluster-period consists of the same individuals. The order in which the interventions are delivered to each cluster is randomised to control for potential period effects [5, 6]. Like in an individually randomised trial, this adaption has the bene-fit of reducing the required number of participants [7]. The key to understanding the CRXO design is to recog-nise how both the cluster randomisation and crossover aspects of the design lead to variation between individ-ual responses in a trial; and how these aspects of the design give rise to similarities in the responses of groups of individuals.
Sample size formula have been published for the two-period, two-intervention, cross-sectional CRXO design [8–10]. These formulae require a-priori specification of two correlations: the similarity between two individuals in the same cluster-period, typically measured by the within-cluster within-period correlation (WPC); and the similarity between two individuals in the same cluster, but in different cluster-periods, typically measured by the within-cluster between-period correlation (BPC). However, there is little guidance for informing the value of the BPC, nor on the sensitivity of the sample size to the chosen values of both correlations [11, 12].
A 2015 systematic review of CRXO trials found that both the cluster randomisation and crossover aspects of the design of the CRXO was appropriately accounted for in only 10% of sample size calculations and 10% of ana-lyses [13]. This suggests that the CRXO design is not well understood.
The aims of this tutorial are to illustrate the intuition behind the CRXO design; to provide guidance on how to a-priori specify the WPC and BPC; and perform sam-ple size calculations for two-period, two-intervention, cross-sectional CRXO trials.
In the ‘Understanding the CRXO design’section, we describe how the cluster randomisation and crossover aspects of the design leads to variation between individ-ual responses in a two-period, two-intervention,
cross-sectional CRXO design, using intensive care unit (ICU) length(s) of stay (LOS) as an example. In the‘Performing a sample size calculation’section, we outline how to per-form sample size calculations and discuss how to specify values of the WPC and BPC for sample size calculations. In the ‘Common mistakes when performing a sample size analyses’ section, we outline common mistakes made by trialists when performing sample size calcula-tions for CRXO trials and the likely consequences of those mistakes. We conclude with a general discussion, considering extensions and larger designs.
Understanding the CRXO design
In this section we illustrate graphically how the cluster randomisation and crossover aspects of the CRXO de-sign leads to variation in the responses of individuals in a CRXO trial, and how these aspects of the design can be used to measure the similarity between individuals using the WPC and BPC.
We illustrate the sources of variation and measures of similarity that arise in the two-period, two-intervention, cross-sectional CRXO design by considering a hypothet-ical CRXO trial conducted in 20 ICUs over a 2-year period. We consider the ICU LOS of all patients admitted to these 20 ICUs, and assume (for ease of exposition) that the number of patients in each ICU is infinitely large (or at least very large). As LOS is non-normally distributed and right skewed, we use the logarithmic transform of ICU LOS throughout our illustration.
Each ICU is randomly assigned to administer one of two interventions to all patients admitted during the first year (period 1). In the subsequent year, each ICU administers the alternate intervention (period 2). All patients admitted to a single ICU over the 2-year period can be thought of as belonging to acluster. Within each ICU (cluster), the patients admitted during a 1-year period can be thought of as belonging to a separate
cluster-period. Therefore, in each ICU (cluster) there are two cluster-periods.
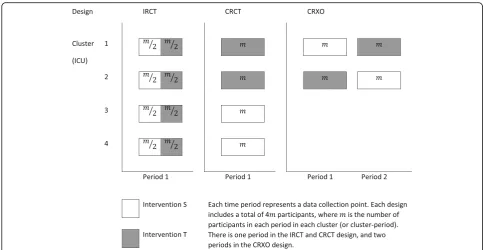
The allocation of interventions to patients in the stratified, multicentre, parallel-group, individually rando-mised trial (IRCT) design, the parallel-group cluster ran-domised trial (CRCT) design, and the CRXO design are shown in Fig. 1. In each design, each intervention is given for one 12-month period. In the IRCT design half the patients in each centre (ICU) receive each interven-tion. In the CRCT design, all patients in a single ICU are assigned the same intervention.
Variation in the length of stay between patients
of patients, the overall mean LOS for all patients in the trial will be equal to the true overall mean LOS for all patients who could be admitted to the 20 ICUs. The variation in LOS arises from both patient and ICU fac-tors. In a CRXO design, the ICU (cluster) and the time period of admission (cluster-period) are both factors that could affect the patient’s LOS and, therefore, explain some of the variation seen in patient LOS. For example, each ICU may have a different case mix of patients, different operating policies and procedures, and different staff. And within an ICU, changes to staff or policy over time could lead to differences in LOS between time periods. The following sections describe how the ICU and time period of admission can explain part of the variation in the LOS between patients.
Variation in the length of stay between ICUs
Each ICU has a true mean LOS for the infinite number of patients who could be hypothetically admitted to that ICU. When there is true variability between ICUs, the true mean LOS for each ICU will differ from the mean of all true ICU mean LOS. In the hypothetical situation where we have an infinite number of patients, the overall mean LOS for all patients and the mean of all true ICU mean LOS will be equal to the same true overall mean LOS.
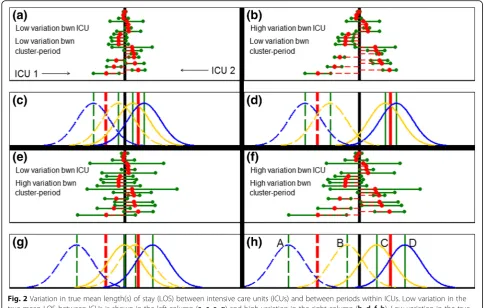
Figure 2a, b, e and f show four scenarios that each illustrate variation in the true mean LOS across ICUs (red circles). The true mean LOS in each ICU may be similar and, therefore, close to the true overall mean LOS (black line) (Fig. 2a); or the true mean LOS of each
ICU may be more dispersed about the true overall mean (Fig. 2b). The difference in the spread of true ICU mean LOS between Fig. 2a and b indicates greater variability in the true ICU mean LOS across ICUs in Fig. 2b than in Fig. 2a. The same comparison can be made between Fig. 2e and f.
Variation in the length of stay between time periods in an ICU
Within each ICU, there is also a true mean LOS for the infinite number of patients who could be hypothetically admitted in each 1-year period (i.e. each cluster-period). Figure 2a, b, e and f show also that there is variation in the difference between the true cluster-period mean LOS (green circles) and the true ICU mean LOS (red circles). The true cluster-period mean LOS may be similar to the true ICU mean LOS Fig. 2a); or the true mean LOS of each cluster-period may be more dispersed about the true ICU mean (Fig. 2e). The difference in the spread of the true cluster-period mean LOS between Fig. 2a and e indi-cates greater variability in true cluster-period mean LOS within ICUs in Fig. 2e than in Fig. 2a. The same compari-son can be made between Fig. 2b and f.
Variation in length of stay between patients in a cluster-period
[image:3.595.55.539.86.336.2]Two of the 20 example ICUs are depicted in Figs. 2c, d, g and h. ICU 1 is shown withsolid linesand ICU 2 is shown in dashed lines. As previously, the mean LOS in each ICU is marked by ared line, and the mean LOS in each cluster-period is marked by agreen line. The distri-bution of the individual patient LOS within each cluster-period follows a normal distribution, and is shown with four yellow or blue curves. The distribution of the LOS for patients receiving intervention S are colouredyellow, and the distribution of those receiving intervention T are colouredblue.
Within each cluster-period, patients have a range of individual LOS centred at the true cluster-period mean LOS (green line). Nonetheless, the patients in each cluster-period are from distinct distributions labelled as A, B, C, and D in Fig. 2h (these labels apply also to Fig. 2c, d and g). In each cluster-period, we assume that
the variability of the individual patient LOS is the same, and hence the yellow and blue curves have the same shape and are only shifted in location between the four cluster-periods.
Summary of the sources of variation in the CRXO design We have illustrated how the cluster randomisation aspect of the CRXO design leads to the formation of clusters of patients defined by ICU, while the crossover aspect of the design leads further to the formation of
cluster-periodsof patients within each cluster.
[image:4.595.55.540.88.396.2]between cluster-periods; and variation between individual patient LOS within a cluster-period.
The within-cluster within-period correlation and the within-cluster between-period correlation
In this section we show how the three sources of vari-ation outlined in the preceding section can be used to quantify the similarity in LOS between the groups of patients defined by ICU (cluster) and cluster-period.
The within-cluster within-period correlation (WPC)
quantifies the similarity of outcomes from patients in the same cluster-period. The within-cluster between-period correlation (BPC) quantifies the similarity of outcomes from patients in the same cluster, but in different periods. Specification of these two correla-tions are required to perform sample size estimates for a CRXO trial.
In the hypothetical circumstance where the LOS of an infinite number of patients admitted to each ICU is measured, we can determine the true WPC and BPC. In practice, the LOS can only be measured on a sample of patients, and the true WPC and BPC will be estimated from this sample of patients, with some amount of ran-dom sampling error.
We first describe the sources of variation underlying the BPC, and then extend the description to the WPC.
Within-cluster between-period correlation (BPC)
The BPC measures how much of the total variability in the LOS is due to variability in the ICU mean LOS or analogously how similar patient responses are within the same cluster, but in different periods. The formula for the BPC,η, is:
η¼ σ2C σ2
Cþσ2CPþσ2I
; ð1Þ
whereσC 2
is the variance in mean LOS between clusters (ICUs), σCP2 is the variance in mean LOS between
cluster-periods, and σI2is the variance in individual LOS
within a cluster-period.
The BPC measures the similarity between the LOS of two patients from the same ICU with one patient from the first period (cluster-period C) and one patient from the second period (cluster-period D).
The similaritybetween the LOS of patients in an ICU
betweencluster-periods arises from the variabilityin the ICU mean LOSonly. We now refer to Fig. 2 to describe how this relationship between similarity and variability arises. As the ICU mean LOS (red lines/red circles) become more dispersed between ICUs, relative to the dispersion (i.e. distance) between cluster-period mean LOS within an ICU (green lines/green circles), the distri-bution of the patient LOS (yellow/blue curves) in the
cluster-periods A and B become more similar to each other, as do the distribution of patient LOS in cluster-periods C and D.
For example, in Fig. 2c there is little variation in the ICU mean LOS around the overall mean LOS (black line) and the distribution of patient LOS in cluster-periods A, B, C and D almost all coincide. As a result, the similarity between the LOS of patients in different cluster-periods within the same ICU (e.g. one patient from period A and one patient from cluster-period B) is comparable to the similarity between the LOS of patients in different ICUs (e.g. one patient from cluster-period A and one patient from cluster-periods C or D). In contrast, in Fig. 2d, there is more separation between the ICU mean LOS and only the distributions of patient LOS from the same ICUs coincide (i.e. cluster-periods A and B, and cluster-periods C and D, coincide). As a result, the LOS of patients in different cluster-periods within the same ICU (e.g. one patient from period A and one patient from cluster-period B) are more similar to each other than to the patients in other ICUs (e.g. one patient from cluster-period A and one patient from cluster-cluster-periods C or D). Hence, the BPC is larger in Fig. 2d than in Fig. 2c. The same comparison can be made between Fig. 2g and h.
The within-cluster within-period correlation (WPC) The WPC measures how much of the total variability in the LOS is due to variability in the ICU mean LOS and the cluster-period mean LOS or analogously how similar patient responses are within a cluster-period. The formula for the WPC,ρ, is:
ρ¼ σ2Cþσ2CP σ2
Cþσ2CPþσ2I
: ð2Þ
The WPC measures the similarity in the LOS from two patients in the same period, e.g. cluster-period C.
The similarity between the LOS of patients within a cluster-period arises from the variability in the ICU mean LOSandcluster-period mean LOS. We now refer to Fig. 2 to describe how this relationship between simi-larity and variability arises. We describe the relationship in two parts: variability in the ICU mean LOS; and vari-ability in the cluster-period mean LOS.
variation between the ICU mean LOS around the overall mean LOS (black line) and the distribution of patient LOS in cluster-periods A, B, C and D almost all coin-cide. As a result, the similarity between the LOS of two patients in cluster-period A is comparable to the similar-ity between the LOS of one patient from cluster-period A and one patient from cluster-period B (or C or D). In contrast, in Fig. 2d, there is more separation between the ICU mean LOS and hence more separation of the patient LOS in ICUs 1 and 2. As a result, the LOS of two patients in cluster-period A are more similar to each other than to one patient from cluster-period A (cluster 1) and another patient from cluster-periods C or D (cluster 2). Hence, the WPC is smaller in Fig. 2c than in Fig. 2d. We note that the same comparison can be made between Fig. 2g and h.
Likewise, as the cluster-period mean LOS (green circles/green lines) becomes more disperses, relative to the distance between the ICU mean LOS (red circles/red lines), the distribution of the individual patient LOS (yellow/blue curves) in the four cluster-periods A, B, C and D also become more distinct from each other, and hence patients within a cluster-period become more similar to each other. For example, in Fig. 2d there is little variation between the cluster-period mean LOS around the ICU mean LOS and thus the distribution of patient LOS in cluster-periods A and B (and equivalently C and D) almost coincide. As a result, the similarity between the LOS of two patients in cluster-period A is comparable to the similarity between the LOS of one patient from cluster-period A and one patient from cluster-period B. In contrast, in Fig. 2h, there is more separation between the cluster-period mean LOS and the distribution of patient LOS. As a result, the LOS of two patients in cluster-period A are more similar to each other than to one patient from cluster-period A and another patient from cluster-period B (and even more similar than one patient from cluster-period A and another patient from cluster-cluster-periods C or D). Hence the WPC is again smaller in Fig. 2d than in Fig. 2h. We note that the same comparison can be made between Fig. 2c and g.
Precision of the CRXO design compared to the parallel-group cluster randomised design and parallel-parallel-group, individually randomised design
In this section, we discuss how the WPC and BPC affect the precision of the estimate of the difference between interventions, and hence the sample size requirement, in a two-period, two-intervention, cross-sectional CRXO trial. We illustrate the two extremes of the CRXO design: when the precision in the CRXO design is equivalent to an IRCT design; and equivalent to a CRCT
design. The allocation of interventions to patients in the IRCT, CRCT, and CRXO design are shown in Fig. 1.
To illustrate the effect of the WPC and BPC on preci-sion (and equivalently the components of variation), we continue to assume that the true difference between interventions is zero. We consider a large sample of patients admitted toonecluster in a CRXO design, such that the sampling error in the estimated mean LOS for patients is assumed negligible. Therefore, in the single cluster shown in Fig. 3, the separation between the distribution of LOS from patients receiving intervention S (yellow curve) and intervention T (blue curve) arises solely from the variation in the mean LOS between cluster-periods (σCP
2
). In this section, we show which par-titioning of the total variation in LOS into the compo-nents of variation leads to the most precision and to the least precision in the CRXO design.
In the CRXO design, the observed mean LOS of patients receiving each intervention can be compared within each cluster because each intervention is delivered in each cluster. As an illustration, in Fig. 3a, the observed difference in mean LOS between patients receiving each intervention could be due to a difference in true cluster-period mean LOS (green lines) but not due to differences in the true ICU mean LOS because this component of variation is removed when the two interventions are com-pared within an ICU.
As the variation in the true cluster-period mean LOS increases, and hence the separation between the green lines in Fig. 3a increases, the separation between the
yellow and blue curveswithin an ICU increases. Corres-pondingly, from Eqs. 1 and 2, the difference between the WPC and BPC increases. In conclusion, increasing vari-ability in the cluster-period means leads to increasing uncertainty in the observed difference in the mean LOS between patients receiving each intervention.
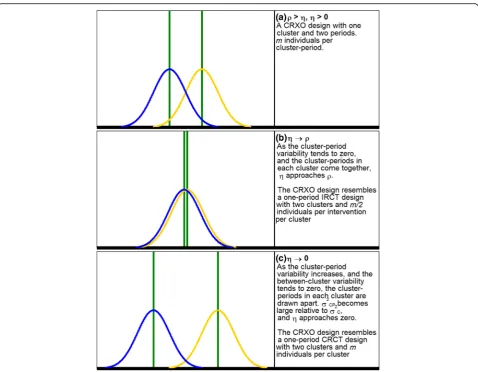
Conversely, the precision of the CRXO design decreases when the cluster-period variability increases. As the variability between periods within a cluster increases, the separation between the green lines, and correspondingly the yellow and blue curves, in Fig. 3a increases. The increased separation results in greater variability in the comparison of patient LOS in each intervention within each cluster. For a fixed total variability in ICU LOS, as the variability between periods within a cluster increases, the variability between different clusters must reduce. In the limiting case there is no variation at all between clusters (σC2= 0),
resulting in the BPC equalling zero (Eq. 1). In this case each cluster-period effectively resembles a separate cluster (Fig. 3c). Two patients in different cluster-periods in the same ICUare no more similar than two patientsin differ-ent ICUs. Therefore, there is no advantage to the
crossover component of the CRXO design and the CRXO will have the same precision as a CRCT design.
In most situations, the BPC will lie between zero and the WPC. In the following section,‘Performing a sample size calculation’, we discuss the effect of the BPC and WPC on the sample size required to be able to detect a specified true intervention effect in a CRXO trial with a given level of power, and provide guidance on how to choose values for the BPC and WPC for a sample size calculation.
Performing a sample size calculation
[image:7.595.59.538.85.457.2]CRXO design when the true difference between inter-ventions was assumed to be zero. However, even when the true difference is not zero, the effects of the WPC and BPC on precision described in the previous section continue to hold.
The sample size required for a CRXO trial increases as the cluster-period variability increases, or equivalently as the difference between the WPC and BPC increases. As the value of the BPC increases from zero to the WPC, the sample size required for the CRXO design will decrease from that required for a CRCT design towards the sample size for an IRCT. Therefore, using an appropriate specifi-cation of the difference between the WPC and the BPC is essential for performing sample size calculations for the CRXO design.
We now illustrate how to perform a sample size calcula-tion for a two-period, two-intervencalcula-tion CRXO trial with a continuous and binary outcome using ICU LOS and in-ICU mortality data, respectively, from the Australian and New Zealand Intensive Care Society (ANZICS) Adult Patient Database (APD) [14, 15]. There are 37 tertiary ICUs in Australia and New Zealand, of which 25 to 30 might be expected to participate in a trial.
We compare the sample size requirement for number of individuals and number of clusters (ICUs) from the CRXO design with the requirement from the stratified, multicentre, parallel-group, individually randomised de-sign (IRCT) and the parallel-group cluster randomised design (CRCT) conducted over one period.
Comparisons of the sample size requirements for these different designs can either be made by fixing the total number of clusters across all designs; or by treating the CRXO design as lasting twice as long, i.e. two periods, instead of one period as in the IRCT and CRCT designs. We take the latter approach here so that the WPC is the same in each period.
We include Stata do-files to estimate the required sample size for each trial design, for a chosen set of sam-ple size parameters (see Additional files 1 and 2).
The sample size formulae for a one-period IRCT design, a one-period CRCT design, and a period, two-intervention, cross-sectional CRXO design
The sample size formula for thetotal number of partici-pants required for a normally distributed continuous outcome in a two-period, two-intervention CRXO trial, across all clusters and interventions, assuming a con-stant number of participants recruited to each cluster-period is [8]:
NCRXO¼2zα=2þzβ2 2σ
2
μA−μB
ð Þ2 ð1þðm−1Þρ−mηÞ þ4m;
and for a one-period, two-intervention CRCT:
NCRCT ¼2 zα=2þzβ
2 2σ2
μA−μB
ð Þ2 ð1þðm−1ÞρÞ þ2m;
and for a one-period, two-intervention, parallel-group IRCT, stratified by cluster, across all clusters and in-terventions is [16]:
NIRCT¼2 zα=2þzβ
2 2σ2
μA−μB
ð Þ2 ð1−ρÞ;
where zα/2and zβare the standard normal values corre-sponding to the upper tail probabilities of α/2 and β, respectively; α is the two-sided significance level, typic-ally 0.05; 1−βis the power to detect the specified differ-ence (μA−μB) with probability α; σ2 is the variance of the outcome;μA and μBare the outcome means in each
arm;mis the number of participants per cluster-period;
ρis the WPC; andηis the BPC.
The formulae presented above include a correction for when the number of clusters small, as suggested in Eldridge and Kerry (p. 149) [2] and Forbes et al. [9]. This leads to an additional 4m participants in the CRXO design and 2m participants in the CRCT de-sign. No correction is necessary for the IRCT because the number of individual participants will be large in the example settings.
For a binary outcome we can replace μ2σ2
A−μB
ð Þ2 with pAð1−pAÞþpBð1−pBÞ
pA−pB
ð Þ2 in the above formulae [12], where pAand pBare the proportions of the outcomes in each arm.
For the CRXO design, CRCT design and IRCT design, respectively, the formulae to determine the number of clusters (ICUs) needed to achieve the required number of participants are:
nCRXO¼ N2CRXOm ,nCRCT ¼ NCRCTm , andnIRCT ¼ NIRCTm .
Australian and New Zealand Intensive Care Society– Adult Patient Database (ANZICS-APD): estimates of the WPC and BPC
The ANZICS-APD is one of four clinical quality regis-tries run by the ANZICS Centre for Outcome and Resource Evaluation and collects de-identified informa-tion on admissions to adult ICUs in Australia and New Zealand. A range of data is collected during patients’ admissions, including ICU LOS and in-ICU mortality. In this section we use the ANZICS-APD data from 34 tertiary ICUs to estimate the correlations required to perform sam-ple size calculations for CRXO trials. We estimate the values of the WPC and the BPC from two 12-month periods of data between 2012 and 2013 (Appendix 1).
Continuous outcomes
the estimated WPC was ^ρ ¼ 0:038, and the BPC was ^
η ¼ 0:032 (Table 1). The overall mean LOS was 5.3 log-hours, with a standard deviation 1.39 log-hours.
Binary outcomes
We follow the methods of Donner et al. to estimate the WPC and BPC (Appendix 1). Using the in-ICU mortality data, the estimated WPC was ρ^¼0:010 , and the BPC wasη^¼0:007. The overall mortality rate was 8.7%.
Sample size example for ICU LOS
Suppose we wish to design a period, two-intervention, CRXO trial to have 80% power to detect a true reduction in ICU LOS of 0.1 log-hours (1.1 h) using a two-sided test with a Type-I error rate of 5%. In practice, the choice of reduction in ICU LOS should be the minimally clinically important reduction, deter-mined in consultation with subject matter experts. A 0.1 log-hours’ reduction is equivalent to a 10% reduc-tion, and is a reasonable minimally clinically important reduction in ICU LOS.
The standard deviation is estimated to be 1.2 log-hours (3.3 h). As an illustration, we assume that in a 12-month period, 200 patients in each ICU will meet the inclusion criteria for the trial. The CRXO trial will, therefore, run for 2 years and include 400 patients per ICU, with 200 patients receiving each intervention in each ICU.
For comparison, we consider an IRCT and a CRCT run for a 12-month period, with 100 patients receiving each intervention in each ICU in the IRCT and all 200 patients receiving one intervention in each ICU in the CRCT.
Using the estimates that we calculated from the ANZICS-APD data for the WPC and BPC, the total number of patients and ICUs for each design are sum-marised in Table 2 (see Appendix 2 for calculations). T3
The total number of participants required for the CRXO design is NCRXO= 10,564. To include 10,564 participants,
we requirenCRXO= 27 ICUs, each recruiting 200
partici-pants in each of thetwo 12-month periods. If instead we conducted a CRCT over a single 12-month time period, the total number of participants required would beNCRCT
= 39,065. Assuming that 200 patients are eligible in each
ICU, we would neednCRCT= 196 ICUs. The total number
of participants required for an IRCT conducted over a 12-month period is NIRCT= 4345. With 200 patients per
ICU (100 patients per intervention), the total number of ICUs required isnIRCT= 22.
In this example, the CRXO design required five more clusters (ICUs) than the IRCT design; however, the CRXO design is run for twice as long. The CRCT design would require 7.3 times as many clusters as the CRXO design. Given that there are only 37 tertiary ICUs in Australia and New Zealand, a CRCT trial would not be feasible.
We can examine the sensitivity of the CRXO sam-ple size calculation to a different BPC. If the BPC was η= 0.010 rather than η= 0.032, then the CRXO design requires NCRXO= 30,433 participants. The total
number of ICUs required to obtain the required number of participants is nCRXO= 77. The total
[image:9.595.305.541.144.235.2]num-ber of ICUs required has now increased by 50, and the trial would no longer be feasible in the Australia and New Zealand region within tertiary ICUs only. Note that when the number of patients admitted in
Table 1Calculation of the within-cluster, within-period
correlation (WPC) and within-cluster, between-period correlation (BPC) for intensive care unit (ICU) log-length of stay (LOS) in the Australian and New Zealand Intensive Care Society–Adult Patient Database (ANZICS-APD)
^
σ2 ICU¼0:045 ^
σ2 CP¼0:008 ^
σ2 I ¼1:360 ^
ρ¼^σ2ICUþσ^2CP ^
σ2
ICUþσ^2CPþσ^
2
I ¼ 0:0450:þ0450:þ0080:þ0081:360 ¼ 0:038 ^
η¼ σ^2ICU ^
σ2
ICUþσ^2CPþσ^
2
[image:9.595.305.539.589.724.2]I ¼ 0:045þ00::045008þ1:360 ¼ 0:032
Table 2Number of individuals and number of clusters required
for a cluster randomised crossover (CRXO), cluster randomised controlled trial (CRCT) and individually randomised controlled trial (IRCT) trial withρ= 0.038 for all designs and specifiedηfor CRXO design
Number of required individuals
Number of required ICUs CRXO
ρ= 0.038,η= 0.032 10,564 27
ρ= 0.038,η= 0.010 30,433 77
CRCT 39,065 196
IRCT 4345 22
ICUintensive care unit
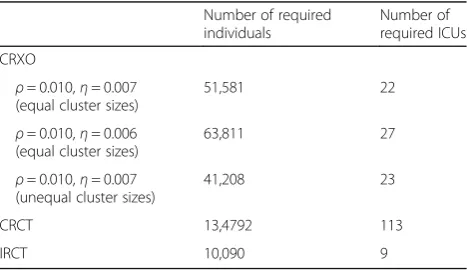
Table 3Number of individuals and number of clusters required
for a cluster randomised crossover (CRXO), cluster randomised controlled trial (CRCT) and individually randomised controlled trial (IRCT) trial withρ= 0.010 for each design and specifiedη for the CRXO design
Number of required individuals
Number of required ICUs CRXO
ρ= 0.010,η= 0.007 (equal cluster sizes)
51,581 22
ρ= 0.010,η= 0.006 (equal cluster sizes)
63,811 27
ρ= 0.010,η= 0.007 (unequal cluster sizes)
41,208 23
CRCT 13,4792 113
IRCT 10,090 9
each cluster-period is relatively large, we would observe a similar increase in the sample size if we had underestimated the WPC by 0.023, rather than overestimated the BPC by 0.023.
Sample size example for in-ICU mortality
In a second example, suppose that we wish to design a study to have 80% power to detect a true reduction in in-ICU morality from 8.7% to 7.2% (absolute difference of 1.5%) using a two-sided test with a Type-I error rate of 5%. From the ANZICS-APD admission data, we estimate that in a 12-month period, 1200 patients will be admitted in each ICU and eligible for inclusion in the trial. The total number of patients and ICUs for each design are sum-marised in Table 3 (see Appendix 2 for calculations).
For a CRXO design, using the estimates for the WPC, the BPC, and the cluster-period size we calculated from the ANZICS-APD, the total number of participants required is NCRXO= 51,581. Since we expect 1200
patients in each ICU for each of the two 12-month periods, the required number of ICUs is nCRXO= 22. If
we had used a CRCT, the required number of partici-pants is NCRCT= 134, 792. Assuming that 1200 patients
admitted over a single 12-month period, we would need
nCRCT= 113 ICUs. The total number of participants
required for the IRCT design is NIRCT= 10,090. For a
trial run over 12 months, with 1200 patients per ICU (600 patients per intervention), the total number of ICUs required isnIRCT= 9.
In this example, the CRXO design required 2.4 times as many clusters (ICUs) as the IRCT design, and is run for twice as long. Despite the increase in required clus-ters, the CRXO is still a feasible design, unlike the CRCT design, which would require 5.1 times as many clusters as the CRXO design.
We can examine the sensitivity of the CRXO sample size calculation to a different BPC. If the BPC was η= 0.006, rather than η= 0.007, then the total number of participants required is NCRXO= 63,811. Since we expect
1200 patients for each cluster-period, we would need to include nCRXO= 27 ICUs, i.e. 54 cluster-periods. This
demonstrates that a small change in the assumed BPC can have a marked impact on the number of required ICUs and patients.
Unequal cluster-period sizes
We have so far assumed that the cluster-period size is constant. In reality, it is likely that different ICUs will in-clude a differing number of participants [17, 18]. An ex-tension to the sample size formula for this scenario is provided by [9]. When the analysis is based on un-weighted cluster-period means, the arithmetic mean in
the sample size formula given for the CRXO design can be replaced by the harmonic mean:
mh¼n
Xn
i¼1 1
mi:
We assume that the cluster-period size is the same in each period within a cluster. For further extensions, see Forbes et al. [9].
From the ANZICS-APD data, we estimate that the harmonic mean ismh= 900. Therefore then the required
number of patients is NCRXO= 41,208, and the required
number of ICUs is:
nCRXO¼
41208 2 900¼23:
Allowing for unequal cluster-period sizes has increased the required number of clusters slightly from 22 to 23.
Guidance on how to choose the WPC and the BPC for the sample size calculation
As was seen in the ‘Understanding the CRXO design’ section, the difference between the WPC and BPC is key in determining the sample size for a CRXO design.
Approaches for choosing the within-cluster intracluster correlation (ICC) in sample size calculations for parallel-group CRCTs have been discussed [19–22]. Similar considerations apply when choosing the WPC in a CRXO design. In particular, because the ICC estimates are subject to large uncertainty [23], reviewing multiple relevant esti-mates of the ICC is recommended. These ICC estiesti-mates may be obtained from trial reports, lists published in jour-nal articles or from routinely collected data.
Identification of the factors which influence the mag-nitude of the within-cluster ICC can assist trialists in selecting ICC estimates that are relevant to their planned trial. Typically, the trial outcome itself is less predictive of the value of the ICC than factors such as: the type of outcome variable (i.e. process outcomes that measure adherence to protocol and policy or individually mea-sured outcomes) [19], the prevalence of the outcome [20], the size of the natural cluster of individuals that the randomised clusters are formed from [20], and the char-acteristics of the individuals and clusters [22].
time, and we are unaware of any research investigating if this is justified.
In contrast, we are aware of only two publications reporting estimates of the BPC [24, 25]. Therefore, until reporting of the BPC becomes more common [26], esti-mates of the BPC are likely to rely on the analysis of routinely collected data, pilot or feasibility study data, or a reasoned best-guess. As for the within-cluster ICC in cluster randomised trials, estimating the BPC from feasi-bility or a single routinely collected data source is likely to be subject to considerable uncertainty [27].
In forming a best guess, it is helpful to recognise that the difference between the WPC and BPC is a measure of changes over time within a cluster’s environment that affect the outcomes of each individual in that cluster (e.g. a change in policy in one ICU). Over short time periods or in clusters with stable environments and patient characteristics, it might be reasonable to expect little change over time and, therefore, the BPC will be similar to the WPC. However, if this assumption is untrue and the BPC is less that the WPC, a sample size calculation assuming that the two correlations are equal will lead to an underpowered study. It may be prudent to assume that the BPC is less than the WPC. To this end, suggestions have been made to set the BPC to: half the WPC [12]; and to 0.8 of the WPC [11].
In the ANZICS-APD the ratio of the BPC to WPC is 0.7 for ICU mortality and 0.8 for ICU LOS, which is consistent with the suggestion made by Hooper and Bourke [11]. In the absence of multiple estimates or precise estimates of the ICCs, a conservative ap-proach in selecting the BPC is recommended to avoid an underpowered trial. Further, a sensitivity analysis exploring the effect of the choice of ICC on the sam-ple size is recommended.
Common mistakes when performing sample size calculations and analyses
Many trialists have made strong assumptions about the values of the WPC and the BPC in their sample size and analysis methodology [13]. In this section we illustrate the consequences of using incorrect sample size meth-odology on the estimated sample size and power.
Assume the outcomes are independent
In a review of CRXO trials, 34% of sample size calcula-tions made the assumption that the observacalcula-tions were independent [13]. There are two scenarios where this as-sumption is reasonably appropriate: when the WPC and the BPC are equal and the sample size calculation was stratified by centre; or when the WPC and the BPC are both zero.
The first scenario arises when the outcomes of two individuals in the same cluster are equally similar if the
individuals are in different periods as if the individuals are in the same period (i.e. there is no change in the WPC over time within a cluster). In this fortuitous case the precision gained by crossover aspect of the CRXO design equals the precision lost by cluster randomisation (apart from a factor of 1-WPC, which is usually small [16]). The second scenario arises when there is no simi-larity between the outcomes of any two individuals, which is unlikely.
The effect on power of assuming that the outcomes are independent will depend on the cluster-period size and the difference between the WPC and the BPC. Loss of power will increase as both the differ-ence between the two ICCs increases and the cluster-period size increases.
We illustrate the potential effect on power and sample size assuming the outcomes are independent using a published sample size calculation. Roisin [28] estimated that the seven wards (clusters) participating in their trial required a minimum of 3328 patients to have 80% power to detect a reduction in proportion of hospital acquisi-tion of methicillin-resistant Staphylococcus aureus
(MRSA) from 3% to 1.5%. From the ANZICS-APD data, we estimate a WPC of 0.010, and a BPC of 0.007 for in-ICU mortality in the in-ICU setting. As an example only, we assume that the estimates of the correlations for ICU mortality are similar to the correlations for ICU MRSA acquisition. Given that a total of 2505 patients were eli-gible for inclusion in the study, we determined the average cluster-period size to be 179. From these esti-mates, we determine that a sample size of 5385 is re-quired to achieve the specified power, which is a 62% increase from the published sample size requirement of 3328.
Assume a parallel-group cluster randomised design instead of a cluster randomised crossover design
progressively more overpowered as the true BPC be-comes larger and the cluster-period sizes increase.
We illustrate the potential effect on power and the sample size requirement using CRCT sample size meth-odology by means of a published sample size calculation. van Duijn [29] estimated that eight ICUs (clusters) par-ticipating in their trial would include 135 patient mea-surements per cluster-period. Using CRCT sample size methodology, each of the 16 cluster-periods (two periods per ICU) were assumed to be separate clusters of 135 patients. van Duijn [29] assumed a within-cluster ICC of 0.01, and hence they estimated that the trial required 1842 patients to have 80% power to detect a reduction in proportion of ICU patients with antibiotic-resistant gram-negative bacteria from 55% to 45%. From the ANZICS-APD data, we estimate a WPC of 0.010, and a BPC of 0.007, as in the example in the previous section. From these estimates, we determine that a sample size of 1623 is required to achieve the specified power, which is 12% less than the sample size required for a CRCT.
Discussion
Sample size calculations for CRXO trials need to ac-count for both the cluster randomisation and crossover aspects of the design to ensure that an appropriate number of participants are recruited to adequately address the trial’s hypotheses. There are simple, sample size formulae available for a two-period, two-intervention, cross-sectional CRXO design; however, the implementa-tion of these formulae has been limited [13]. Such limited use of the formula may be due to a lack of recognition that formulae are available, a lack of availability of estimates of the parameters required within the formulae, or a lack of trialists’understanding of those parameters.
We have illustrated how the cluster randomisation and crossover aspects of the CRXO design give rise to simi-larity in both the responses of individuals within the same cluster and within the same cluster-period; and have described the parameters required to perform sam-ple size calculations for CRXO trials. We have provided guidance on how to choose the parameters required for the sample size calculation and perform sample size calculation using those parameters.
While our focus has been on the intervention, two-period, cross-sectional CRXO design, more complex designs with additional periods and interventions are pos-sible. The sample size and analysis methodology is more complex in these designs. For example, in a design with more than two periods, additional assumptions are required about the similarity between individuals in the same cluster in the same time period, and 1, 2, or 3, etc. time periods apart. Careful consideration should always be given to whether cluster randomisation is necessary [30],
and whether the risk of the intervention effect from one period carrying over to the next period is minimal [6].
In addition to consideration of the sample size meth-odology, it is also essential to appropriately account for the cluster and the cluster-period in the analysis. Very few published trials do so [13]. Failure to account for the cluster-period in an individual level analysis leads to inflated Type-I error rates [31]. Methods to analyse CRXO trials have been published by Turner et al. and Forbes et al. [5, 9].
Conclusions
Sample size calculations for CRXO trials must account for both the cluster randomisation and crossover aspects of the design. In this tutorial we described how the CRXO design can be understood in terms of compo-nents of variation in the individual outcomes, or equiva-lently, in terms of correlations between the outcomes of individual patients. We illustrated how to perform sam-ple size calculations for continuous and binary out-comes, and provided guidance on selecting estimates of the parameters required for the sample size calculation.
Appendix 1
Estimates of the WPC and BPC
To illustrate the impact of the WPC and BPC on the sample size calculation, we estimate the values of the WPC and BPC by using previously published methods for continuous and binary outcomes [5, 12].
Continuous outcomes
ICU LOS is right-skewed, so we begin by log-transforming this variable, so that the assumptions of the model used to estimate the correlations are more likely to be met. We use LOS to represent log(LOS) throughout. We estimate the values of the WPC and the BPC from the variances estimated by fitting the following model [5]:
Yijk ¼μþ πþuiþvijþeijk;
where there are i= 1, …, n ICUs, j= 1, 2 12-month periods andk= 1,…,mijpatients in theithICU (cluster)
and jth period; Yijk is the LOS for the k th
patient in the
jthcluster-period in theith ICU (cluster);μis the overall mean LOS; π is the fixed period effect; ui~ N(0, σC2) is
the difference from the overall mean LOS for each ICU mean LOS; vij~ N(0, σCP2 ) is the difference from the
ICU mean LOS for each cluster-period mean LOS, and
eijk~ N(0, σI 2
) is the difference from the cluster-period mean LOS for each patient LOS;σC2,σCP2 , andσI2are the
Because we are fitting the model to registry data, ra-ther than clinical trial data of the actual treatments to be considered, we estimate the model parameters under the assumption of a null treatment effect, and hence have not included a fixed treatment effect. A fixed treatment effect should be included when estimating the variance components from data from the actual clinical trial.
The model was fitted in Stata 14 with the mixed com-mand using restricted maximum likelihood estimation: mixed log(LOS) periodeffect || cluster: || cluster_ period:, reml.
Binary outcomes
We estimate the value of the WPC for within-ICU mortality by fitting the analysis of variance (ANOVA) estimator for the intracluster correlation [12]:
^
ρ¼ MSC−MSW
MSCþðm0−1ÞMSW;
MSC¼
X2
j¼1
Xn
i¼1mij P^ij−P^j
2
X2
j¼1ðn−1Þ
;
MSW ¼
X2
j¼1
Xn
i¼1mijP^ij 1−P^ij
X2
j¼1 Nj−n
;
m0 ¼
N−X2 j¼1
Xn
i¼1m 2
ij=Nj
X2
j¼1ðn−1Þ
;
where there are i= 1, …, n ICUs and j= 1, 2 12-month periods; mij is the number of patients in the ith ICU
(cluster) andjthperiod;Njis the total number of patients
in each period and N is the total number of patients overall; P^ij is the estimated mortality rate in each cluster-period; and P^j is the estimated mortality rate in periodj.
And by fitting the Pearson pairwise estimator for the BPC [12]:
^ η¼
Xn
i¼1Y1i−m1iP^1
Y2i−m2iP^2
ffiffiffiffiffiffiffiffiffiffiffiffiffiffiffiffiffiffiffiffiffiffiffiffiffiffiffiffiffiffiffiffiffiffiffiffiffiffiffiffiffiffiffiffiffiffiffiffiffiffiffiffiffiffiffiffiffiffiffiffiffiffiffiffiffiffiffiffiffiffiffiffiffiffiffiffiffiffiffiffiffiffiffiffiffiffiffiffiffiffiffiffiffiffiffiffiffiffiffiffiffiffiffiffiffiffiffiffiffiffiffiffiffiffiffiffiffiffiffiffiffiffiffiffiffiffiffiffiffiffiffiffiffiffiffiffiffiffiffiffiffiffiffiffiffiX
n
i¼1m2i Y1i−2Y1iP^1þm1iP^ 2 1
Xn
i¼1m1i Y2i−2Y2iP^2þm2iP^ 2 2 ; r
whereY1iand Y2iare the number of deaths in two
adja-cent time periods on theithICU.
Appendix 2
Sample size calculations
In this section we provide the details of the sample size calculations presented in the ‘Performing a sample size calculation’ section, using the estimates for the WPC and BPC that we calculated from the ANZICS-APD data in Appendix 1.
Sample size calculation for ICU LOS
Total number of participants and ICUs required for the CRXO design
NCRXO¼2 zα=2þzβ
2 2σ2
μA−μB
ð Þ2 ð1þðm−1Þρ−mηÞ þ 4m;
NCRXO¼2 ð1:96þ0:84Þ2
21:22
5:3−5:2
ð Þ2ð1þð200−1Þ0:038−200 0:032Þ þ4200¼10564
Since we expect 200 patients in each ICU for each of the two 12-month periods, the number of ICUs needed to achieve the required number of participants is:
nCRXO¼ NCRXO
2m ¼
10564 2 200¼27:
If the BPC wasη= 0.010 rather thanη= 0.032, then:
NCRXO¼2 ð1:96þ0:84Þ2
21:22
5:3−5:2
ð Þ2ð1þð200−1Þ0:038−200 0:010Þ þ4200¼30433
The total number of ICUs required to obtain the required number of participants is:
nCRXO¼ NCRXO
2m ¼
30433 2 200¼77:
Total number of participants and ICUs required for the CRCT design
NCRCT ¼2 zα=2þzβ
2 2σ2
μA−μB
ð Þ2 ð1þðm−1ÞρÞ þ2m;
NCRCT¼2 1ð :96þ0:84Þ2
21:22
5:3−5:2
ð Þ2ð1þð200−1Þ0:038Þ
þ2200¼39065
Assuming that 200 patients are eligible in each ICU over the 12-month trial period, we would need to include:
nCRCT ¼ NCRCT
m ¼
39065
200 ¼196 ICUs:
Total number of participants and ICUs required for the IRCT design
NIRCT¼2 zα=2þzβ
2 2σ2
μA−μB
ð Þ2 ð1−ρÞ;
NIRCT ¼2 1ð :96þ0:84Þ2
21:22
5:3−5:2
ð Þ2ð1−0:038Þ ¼4345:
nIRCT ¼ NIRCT
m ¼
4345 200 ¼22: Sample size calculation for in-ICU mortality
Total number of participants and ICUs required for the CRXO design
NCRXO¼2 zα=2þzβ2pAð1−pAÞ þpBð1−pBÞ pA−pB
ð Þ2 ð1þðm−1Þρ−mηÞ þ4m;
NCRXO¼2ð1:96þ0:84Þ20:087ð1−0:087Þ þ0:072ð1−0:072Þ
0:087−0:072
ð Þ2 ð1þð1200−1Þ
0:010−12000:007Þ þ41200 ¼ 51581
The number of ICUs needed to achieve the required number of participants is:
nCRXO ¼ NCRXO
2m ¼
51581 21200¼22:
If the BPC was η= 0.006, rather than η= 0.007, then the total number of participants required is:
NCRXO¼2 ð1:96þ0:84Þ2
0:087ð1−0:087Þ þ0:072ð1−0:072Þ 0:087−0:072
ð Þ2
1þð1200−1Þ 0:010−1200 0:006
ð Þ þ41200¼63811
We would need to include:
nCRXO ¼ NCRXO
2m ¼
63811
2 1200¼27 ICUs:
Total number of participants and ICUs required for the CRCT design
NCRCT¼2zα=2þzβ2pAð1−pAÞ þpBð1−pBÞ pA−pB
ð Þ2 ð1þðm−1ÞρÞ þ2m;
NCRCT¼2 1ð :96þ0:84Þ2
0:087ð1−0:087Þ þ0:072ð1−0:072Þ 0:087−0:072
ð Þ2
1þð1200−1Þ 0:010
ð Þ þ2 1200¼134792
We would neednCRCT ¼ NCRCTm ¼ 1347921200 ¼113 ICUs:
Total number of participants and ICUs required for the IRCT design
NIRCT ¼2 zα=2þzβ
2pAð1−pAÞ þpBð1−pBÞ
pA−pB
ð Þ2 ð1−ρÞ;
NIRCT¼ 2 1ð:96þ0:84Þ2
0:087ð1−0:087Þ þ0:072ð1−0:072Þ
0:087−0:072
ð Þ2
1−0:010
ð Þ ¼10090
The total number of ICUs required is:
nIRCT¼ NIRCT
m ¼
10090 1200 ¼9: Additional files
Additional file 1:Continuous outcomes sample size Stata do file. Stata do file to perform sample size calculations for continuous outcomes using formulae presented in the‘Performing a sample size calculation’ section, for a given set of sample size parameters. (DO 1 kb)
Additional file 2:Binary outcomes sample size Stata do file. Stata do file to perform sample size calculations for binary outcomes using formulae presented in the‘Performing a sample size calculation’section, for a given set of sample size parameters. (DO 2 kb)
Abbreviations
ANZICS-APD:Australia and New Zealand Intensive Care Society–Adult Patient Database; BPC: Within-cluster between-period correlation; CRCT: Cluster randomised controlled trial; CRXO: Cluster randomised crossover; ICC: Intracluster correlation; ICU: Intensive care unit; IRCT: Individually randomised controlled trial; LOS: Length of stay; WPC: Within-cluster within-period correlation
Acknowledgements
Not Applicable.
Funding
This research was in part supported by a National Health and Medical Research Council (NHMRC) project grant (1108283).
SJA was supported in part by a Monash University Graduate Scholarship and a National Health and Medical Research Council of Australia Centre of Research Excellence grant (1035261) to the Victorian Centre for Biostatistics (ViCBiostat). JEM was supported by a National Health and Medical Research Council (NHMRC) Australian Public Health Fellowship (1072366).
Availability of data and materials
Not applicable.
Authors’contributions
SJA led the development of all sections and drafted the manuscript. JEM contributed to the development of all sections and provided critical review of the manuscript. KH contributed to the development of the graphical illustrations and corresponding sections, and provided critical review of the manuscript. DP provided guidance on the ANZIC-APD data and contributed to the development of the sample size examples. ABF conceived of the graphical illustrations, contributed to the development of all sections and provided critical review of the manuscript. All authors read and approved the final manuscript.
Authors’information
Not applicable
Ethics approval and consent to participate
Not applicable.
Consent for publication
Not applicable.
Competing interests
The authors declare that they have no competing interests.
Publisher’s Note
Springer Nature remains neutral with regard to jurisdictional claims in published maps and institutional affiliations.
Author details
3004, Australia.5Australian and New Zealand Intensive Care Research Centre, School of Public Health and Preventive Medicine, Monash University, The Alfred Centre, Melbourne, VIC 3004, Australia.
Received: 30 July 2016 Accepted: 19 July 2017
References
1. Grimes DA, Schulz KF. An overview of clinical research: the lay of the land. Lancet. 2002;359(9300):57–61.
2. Eldridge S, Kerry S. A practical guide to cluster randomised trials in health services research. Chichester: Wiley; 2012.
3. Ukoumunne OC, Gulliford MC, Chinn S, Sterne JA, Burney PG. Methods for evaluating area-wide and organisation-based interventions in health and health care: a systematic review. Health Technol Assess. 1999;3(5):iii–92. 4. Donner A, Birkett N, Buck C. Randomization by cluster. Sample size
requirements and analysis. Am J Epidemiol. 1981;114(6):906–14. 5. Turner RM, White IR, Croudace T. Analysis of cluster randomized cross-over
trial data: a comparison of methods. Stat Med. 2007;26(2):274–89. 6. Parienti JJ, Kuss O. Cluster-crossover design: a method for limiting
clusters level effect in community-intervention studies. Contemp Clin Trials. 2007;28(3):316–23.
7. Hills M, Armitage P. The two-period cross-over clinical trial. Br J Clin Pharmacol. 1979;8(1):7–20.
8. Giraudeau B, Ravaud P, Donner A. Sample size calculation for cluster randomized cross-over trials. Stat Med. 2008;27(27):5578–85. 9. Forbes AB, Akram M, Pilcher D, Cooper J, Bellomo R. Cluster
randomised crossover trials with binary data and unbalanced cluster sizes: application to studies of near-universal interventions in intensive care. Clin Trials. 2015;12(1):34–44.
10. Rietbergen C, Moerbeek M. The design of cluster randomized crossover trials. J Educ Behav Stat. 2011;36(4):472–90.
11. Hooper R, Bourke L. Cluster randomised trials with repeated cross sections: alternatives to parallel group designs. BMJ. 2015;350:h2925.
12. Donner A, Klar N, Zou G. Methods for the statistical analysis of binary data in split-cluster designs. Biometrics. 2004;60(4):919–25.
13. Arnup SJ, Forbes AB, Kahan BC, Morgan KE, McKenzie JE. Appropriate statistical methods were infrequently used in cluster-randomized crossover trials. J Clin Epidemiol. 2016;74:40–50.
14. Stow PJ, Hart GK, Higlett T, George C, Herkes R, McWilliam D, Bellomo R, Committee ADM. Development and implementation of a high-quality clinical database: the Australian and New Zealand Intensive Care Society Adult Patient Database. J Crit Care. 2006;21(2):133–41.
15. Kaukonen KM, Bailey M, Pilcher D, Cooper DJ, Bellomo R. Systemic inflammatory response syndrome criteria in defining severe sepsis. N Engl J Med. 2015;372(17):1629–38.
16. Vierron E, Giraudeau B. Sample size calculation for multicenter randomized trial: taking the center effect into account. Contemp Clin Trials. 2007;28(4):451–8.
17. Konstantopoulos S. Power analysis in two-level unbalanced designs. J Exp Educ. 2010;78(3):291–317.
18. Kerry SM, Bland JM. Unequal cluster sizes for trials in English and Welsh general practice: implications for sample size calculations. Stat Med. 2001; 20(3):377–90.
19. Campbell MK, Fayers PM, Grimshaw JM. Determinants of the intracluster correlation coefficient in cluster randomized trials: the case of implementation research. Clin Trials. 2005;2(2):99–107.
20. Gulliford MC, Adams G, Ukoumunne OC, Latinovic R, Chinn S, Campbell MJ. Intraclass correlation coefficient and outcome prevalence are associated in clustered binary data. J Clin Epidemiol. 2005;58(3):246–51.
21. Gulliford MC, Ukoumunne OC, Chinn S. Components of variance and intraclass correlations for the design of community-based surveys and intervention studies: data from the Health Survey for England 1994. Am J Epidemiol. 1999;149(9):876–83.
22. Adams G, Gulliford MC, Ukoumunne OC, Eldridge S, Chinn S, Campbell MJ. Patterns of intra-cluster correlation from primary care research to inform study design and analysis. J Clin Epidemiol. 2004;57(8):785–94. 23. Ukoumunne OC. A comparison of confidence interval methods for the
intraclass correlation coefficient in cluster randomized trials. Stat Med. 2002; 21(24):3757–74.
24. Martin J, Girling A, Nirantharakumar K, Ryan R, Marshall T, Hemming K. Intra-cluster and inter-period correlation coefficients for cross-sectional cluster randomised controlled trials for type-2 diabetes in UK primary care. Trials. 2016;17:402.
25. Feldman HA, McKinlay SM. Cohort versus cross-sectional design in large field trials: precision, sample size, and a unifying model. Stat Med. 1994; 13(1):61–78.
26. Hooper R, Teerenstra S, de Hoop E, Eldridge S. Sample size calculation for stepped wedge and other longitudinal cluster randomised trials. Stat Med. 2016;35(26):4718–28.
27. Eldridge SM, Costelloe CE, Kahan BC, Lancaster GA, Kerry SM. How big should the pilot study for my cluster randomised trial be? Stat Methods Med Res. 2016;25(3):1039–56.
28. Roisin S, Laurent C, Denis O, Dramaix M, Nonhoff C, Hallin M, Byl B, Struelens MJ. Impact of rapid molecular screening at hospital admission on nosocomial transmission of methicillin-resistant staphylococcus aureus: cluster randomised trial. PLoS One. 2014;9(5):e96310.
29. van Duijn PJ, Bonten MJ. Antibiotic rotation strategies to reduce antimicrobial resistance in Gram-negative bacteria in European intensive care units: study protocol for a cluster-randomized crossover controlled trial. Trials. 2014;15:277.
30. Campbell MK, Piaggio G, Elbourne DR, Altman DG, Group C. CONSORT 2010 Statement: extension to cluster randomised trials. BMJ. 2012;345:e5661. 31. Morgan KE, Forbes AB, Keogh RH, Jairath V, Kahan BC. Choosing appropriate
analysis methods for cluster randomised cross-over trials with a binary outcome. Stat Med. 2017;36(2):318–33.
• We accept pre-submission inquiries
• Our selector tool helps you to find the most relevant journal • We provide round the clock customer support
• Convenient online submission • Thorough peer review
• Inclusion in PubMed and all major indexing services • Maximum visibility for your research
Submit your manuscript at www.biomedcentral.com/submit