72
AN IMPROVED APPROACH FOR GEARBOX CONDITION
MONITORING BASED ON WAVELET-FRACTAL ANALYSIS
1
WEIGUO HUANG, 1RONGFANG ZENG, 2*ZHIYONG HE, 3PENG LI
1School of Urban Rail Transportion, Soochow University, Suzhou 215006, China
2*School of Mechanical and Electrical Engineering, Soochow University, Suzhou 215021,China
3Department of PMPI, University of Science and Technology of China, Hefei, China
*Corresponding author: [email protected]
ABSTRACT
This paper has classified the acceleration signals of different working states of gearbox based on the wavelet-fractal analysis. Considering the similarity of the power spectrums between bearing vibration signals and 1/f processes signals, the principles based on wavelet-fractal analysis for gearbox fault diagnosis are explored. The improved approach mainly includes three following steps: the discrete wavelet transform (DWT) is first performed on vibration signals gathered by accelerometer from gearbox to achieve a series of detailed signals at different scales; the variances of multiscale detailed signals are then calculated; finally, the improved approach slope features are estimated from the slope of logarithmic variances. The presented features reveal an inherent structure within the power spectra of vibration signals. The effectiveness of the proposed feature was verified by experiment on gear wear diagnosis. Experimental results show that the improved approach features have the merits of high accuracy and stability in classifying different fault conditions of gearbox, and thus are valuable for machine fault diagnosis.
Keywords: Gearbox, Condition Monitoring, Wavelet-Fractal Analysis
1 INTRODUCTION
The gearbox is one of the most important equipments in modern industrial applications. Unexpected failures may endanger normal machine operation and productivity, and thus cause significant economic losses. Therefore, condition monitoring and fault diagnosis play a valuable role in terms of system maintenance and process automation.
Wavelet analysis is more suited for extracting information from measured data than the single scale analysis because measured data from most processes are inherently multiscale in nature owing to contributions from events occurring at different locations and with different localization in time and frequency [1]. Many mutiscale feature extraction methods have been developed. Wouwer [2] proposed a texture multiscale characterization method from discrete wavelet representations by the statistics of the wavelet detail coefficients. Luo [3] developed an approach for sensor fault detection via multiscale analysis. Yoo [4] proposed a dynamic monitoring method for multiscale fault detection and diagnosis in the wastewater treatment process. These
papers displayed the good performance of multiscale method for feature extraction.
In this paper, we propose a novel multiscale feature based on wavelet analysis for identifying the working conditions of rotating machinery. Concretely, to extract multiscale feature, the DWT is first performed on vibration signals gathered by accelerometer from rotating machinery and a series of detailed signals at different scales are achieved. Then the variances of multiscale detailed signals are calculated to form a feature vector. Finally, the wavelet-based multiscale slope features are estimated from the slope of logarithmic variances. Experimental results demonstrate the effectiveness of the proposed method for pattern representation and classification of rotating machinery.
73
2 THE IMPROVED WAVELET-FRACTAL
ANALYSIS ALGORITHM
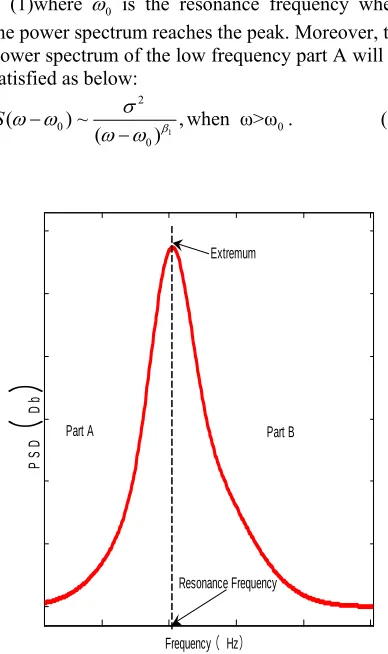
The spectrum of the vibration signal can be divided into two parts by the resonance frequency as indicated in the Fig.1. Thus the power spectrum of the high frequency part B is satisfied:
1 2
0 0
0
( ) ~ , when ω>ω
( )
S
.
(1)where 0 is the resonance frequency where
the power spectrum reaches the peak. Moreover, the power spectrum of the low frequency part A will be satisfied as below:
1 2
0 0
0
( ) ~ , when ω>ω
( )
S
. (2)
( )
Frequency Hz
()
P
S
D Db
Extremum
Part B Part A
[image:2.612.95.289.216.543.2]Resonance Frequency
Figure 1. Typical Spectrum Of A Vibration Signal Of Rotating Machinery.
According to Eq. (1) and Eq. (2), the slope of the logarithmic power spectrum in two parts will have good linearity. Recently, the DWT method has been proposed to estimate the slope β based on multiscale variance [5]. This structure has grate similarity of the process of 1/f [6, 7]. In the following, two multiscale slope features according to the two parts in power spectrum of the rotating machinery vibrations are investigated to represent the vibration pattern.
Wavelet transform (WT) has proved its great capabilities in decomposing, de-noising, and
analyzing non-stationary signals [8]. The variance of wavelet coefficients has the same dimension with energy and the variance in different scales is proportional to the energy in corresponding frequency band [9]. Recently, the DWT method has been proposed to estimate the slope β based on multiscale variance [10].Thus, the S(ω) in Eq. (1) and (2) can be replaced by the variance of the detail
signalsd2j, which can be estimated as
2
2
Var d ~
2
j
j
. (3)
where j represents the scale, represents the
slope which measures the variance progression over the scales.
The variance of the detail signal at scale j is given
as:
2 2
2 2
1
( ) ( )
1
j j dj
j
Var d d m
N
.(4) where
2j d
m is the mean of the detail signal at
scale d2j, and Nj represents the number of samples
of the detail signal.
The logarithms of the variance of each scale lj
are calculated as:
2
log[ ( j)]
j
l Var d . (5)
The slope can then be estimated by the
multiscale variance using least square method. The slope of the logarithmic variance in different scales would be able to estimate the slope of the logarithmic power spectrum. Two slopes, β1 and β2, are calculated respectively according to two power spectrum parts divided by resonance frequency as illustrated in Figure 1. These multiscale slope features make a convenient estimate of the signal structure which depends on the rotating machinery working conditions.
74
Figure 2. Feature Extraction Based On Wavelet-Fractal Analysis
The detailed steps are described as follows.
Vibration signals are recorded from an automobile transmission gearbox. The gearbox is tested at three health conditions such as healthy, slight wearing gear, and severe wearing gear. The collected vibration signals from a gearbox is usually non-stationary [11]. In this study, the vibration signals are preprocessed by mean normalization and the empirical mode decomposition technique[12]. The DWT is conducted on vibration signals to achieve J levels of decomposition, and the logarithm of the variance is calculated, then the maximum in the log-variance vs scale curve were chosen as the turning point. Two spectrum parts are divided by the turning point. The slopes of the logarithmic variance progression, β1 and β2, are estimated for two parts by using Least Square Method (LSM), respectively. The slopes β1 and β2 are then explored as the multiscale slope features to distinguish different conditions of gearbox.
3 EXPERIMENT
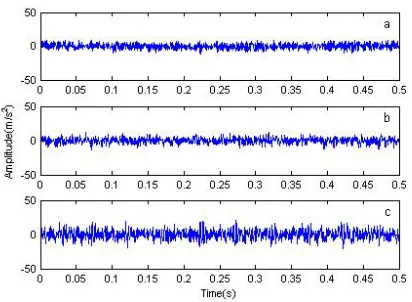
The experimental setup is to conduct a fatigue test of an automobile transmission gearbox, which can load 5 forward speeds and one backward speed. The vibration signals were acquired by an accelerometer, which was mounted on the outer case of the gearbox when it is loaded with the third speed gearbox. The rotating speed is 1600 r/min and the corresponding meshing frequency of the third speed is calculated to be 500 Hz. The sampling frequency is set to be 3000 Hz. Three different working conditions of test gear,
including normal, slight wearing, and severe wearing, were selected to analyze the vibration signals measured on the gearbox. The vibration signals and their power frequency are in Fig.3 and Fig.4 respectively.
The collected vibration signals from a gearbox is usually non-stationary. A pretreatment is performed to extract the resonance band near 250 Hz for each condition signal by using the empirical mode decomposition technique. The power spectrums of the pretreated vibration signals with different working conditions can be seen that the energy distribution is quite different in spectrums for three working conditions of the gearbox, but all of them follow the form represented in Fig.1. The multiscale slope feature analysis is then adopted with the experiential mother wavelet selection of Daubechies
[13] wavelet with orderN8. Here, the sampling
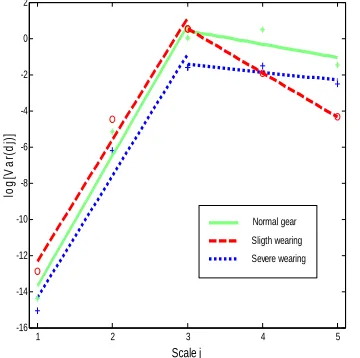
[image:3.612.323.529.539.690.2]frequency in gearbox test is much lower than in bearing test and the frequency band represented in the fifth level is about 0-100Hz. Lower frequency components in deeper levels are usually polluted and meaningless for gearbox conditions monitoring, so the gearbox acceleration signals were decomposed into 5 levels. The logarithmic variance plot is then indicated in Fig.5. In the gearbox test, scale 3 is selected as the turning point for its obvious highest position in the logarithmic variance plot and the peaks of spectrums indicated in Fig.5 are also located at the same frequency bands. The log-variance vs. scale plot of the wavelet coefficients variances shows good linear features from scale 1 to scale 3 and from scale 3 to scale 5, which corresponding to two slope features β1 and β2, respectively. It can be seen that the least-squares fitting lines of different condition samples are shown as different types of lines in Fig.5.
75
Figure 4. The Power Spectrum Of Different Working Conditions Gearbox
1 2 3 4 5
-16 -14 -12 -10 -8 -6 -4 -2 0 2
Scale j
lo
g
[V
a
r(
d
j)
]
[image:4.612.324.526.92.307.2]Normal gear Sligth wearing Severe wearing
Figure 5. The Log-Variance-Scale Plot Of The Wavelet Coefficients And The Fitting Lines Generated By
Least-Squares Approximation For Gearbox.
Temporal window test is executed, and 1500 samples are contained in each window and 750 samples are overlapped between adjacent windows. Respectively 15 steps were executed for each condition, and the distributions of all slope feature values are shown in Fig.6. It can be seen that the two slope features display clear clustering results, which indicates the effectiveness in characterizing different working conditions.
Statistics of the multiscale slope features calculated by temporal window test, including mean value and variance, are calculated as listed in Table I to further validate the merits of proposed features. The results demonstrate the new presented feature extraction approach can play a good performance
and has great value in rotating machinery fault diagnosis.
6.5 6.6 6.7 6.8 6.9 7 7.1 7.2 7.3 -3.5
-3 -2.5 -2 -1.5 -1 -0.5 0
Slope
2
β
Sl
ope
β1
[image:4.612.104.284.308.487.2]Normal Slight wearing Severe wearing
Figure 6. Representation By Two Multiscale Slope Features Of Testing Samples.
TABLE I
The results of temporal window trials for gearbox Working
Stage
Slope β1 Slope β2
Mean Variance Mean Variance
Normal 7.134 0.0073 -1.277 0.0079
Slight Wearing
6.778 0.0082 -2.513 0.0094
Severe
Wearing 6.715 0.0093 -0.521 0.0075
4 CONCLUSIONS AND DISCUSSIONS
In this paper, a new approach is developed for gearboxes feature extraction from the acceleration signals by using wavelet analysis, which has been proved to be a useful tool for analyzing non-stationary signals.
To estimate the wavelet-based multiscale slope features, we used the detailed signals decomposed by DWT from scales 1 to 5 whose frequency band is approximately 1-1500Hz for gearbox signal analysis. The turning points in log-scale-variance plots in these two experiment examples are located scale 3, whose frequency bands are 187.5 – 375 Hz, respectively. Temporal window tests are executed and the good cluster and low variance of the results affirm the validity of this method. In conclusion, the experiments demonstrate that the slope features can be used to characterize different working conditions of the gearbox.
[image:4.612.310.529.351.432.2]76 estimation which is very important for real-time monitoring of device. By combining with pattern identification theory, this approach has a great foreground for fault diagnosis and condition monitoring in practice.
REFERENCES:
[1] B. R. Bakshi, “Multiscale Analysis And Modeling Using Wavelets”, Journal of Chemometrics, Vol. 13, 1999, pp.415–434.
[2] G. Van de Wouwer, P. Scheunders, D. Van Dyck, “Statistical texture characterization from discrete wavelet representations”, IEEE Transactions on Image Processing, Vol. 8, No. 4, 1999, pp. 592–598.
[3] R.F. Luo, M. Misra, D.M. Himmelblau, “Sensor fault detection via multiscale analysis and dynamic PCA”, Industrial & Engineering Chemistry Research, Vol. 38, No. 4, 1999, pp. 1489–1495.
[4] C.K. Yoo, S.W. Choi, I.B. Lee, “Dynamic monitoring method for multiscale fault detection and diagnosis in MSPC”, Industrial & Engineering Chemistry Research, Vol. 41, No. 17, 2002, pp. 4303–4317.
[5] M. Sekine, T. Tamura, M. Akay, T. Fujimoto, T.Togawa, Y. Fukui, “Discrimination of walking patterns using wavelet-based fractal analysis”, IEEE Transactions on Neural Systems and Rehabilitation Engineering, Vol. 10, No. 3 , 2002, pp. 188–197.
[6] M. S. Keshner, “1/f noise”, Proceedings of the IEEE, Vol. 70, No. 3, 1982, pp. 212–218. [7] X. Lou, K. Loparo, “Gearbox fault diagnosis
based on wavelet transform and fuzzy inference”, Mechanical Systems and Signal Processing, Vol. 18, No. 5, 2004, pp.1077–1095.
[8] J. Lin, M. J. Zuo, “Gearbox Fault Diagnosis using adaptive wavelet Filter, Mechanical Systems and Signal Processing”, Vol. 17, No. 6, 2003, pp. 1259–1269.
[9] X.M. Tao, L.H. Sun, B.X. Du, Y. Xu, “Bearings fault diagnosis based on wavelet variance spectrum entropy”, Journal of Vibration and Shock, Vol. 28, No. 3, 2009, pp. 18–22.
[10] M. Akay, M. Sekine, T. Tamura, Y. Higashi, T.Fujimoto, “Fractal dynamics of body motion in post-stroke hemiplegic patients during walking”, Journal of Neural Engineering, Vol. 1, No. 2, 2004, pp. 111–116.
[11] X. Fan, M.J. Zuo, “Gearbox fault detection using Hilbert and wavelet packet transform”, Mechanical Systems and Signal Processing, Vol. 20, No. 4, 2006, pp. 966–982.
[12] N.E. Huang, Z. Shen, S.R. Long et al., “The empirical mode decomposition and the Hilbert spectrum for nonlinear and non-stationary time series analysis”, Proc. R. Soc., Lond., Vol. 454, No. 1971, 1998, pp. 903–995.
[13] I. Daubechies, “Orthonormal bases of compactly supported wavelets”, Communications on Pure and Applied Mathematics, Vol. 41, No. 7, 1998,