ISSN: 1992-8645 www.jatit.org E-ISSN: 1817-3195
PERFORMANCE ANALYSIS AND LOCATION
IDENTIFICATION OF STATCOM ON IEEE-14 BUS SYSTEM
USING POWER FLOW ANALYSIS
1SUNDARARAJU.K, 2NIRMAL KUMAR.A, 3JEEVA.S, 4NANDHAKUMAR.A
1
Department of Electrical and Electronics Engineering , M.Kumarasamy College of Engineering
2 Department of Electrical and Electronics Engineering , Karpagam College of Engineering 3,4 Department of Electrical and Electronics Engineering , PG Scholar,M.Kumarasamy College of
Engineering Email: [email protected]
,
2
[email protected] , [email protected],
4
ABSTRACT
FACTS devices open up wide and new opportunity for the enhancement of usable capacity in the power system. This paper presents a comprehensive analysis of STATCOM (STATic synchronous COMpensator) with IEEE-14 bus system concerning the problem of variable loading and losses. The power flow analysis is performed on a IEEE-14 bus system with and without STATCOM. Due to unequal loading, the most affected bus is identified and the compensation is done in order to improve the voltage for all the buses. The detailed investigations are carried out with different loading and the performance of the IEEE-14 bus system is examined. The voltage regulation and the reactive power compensation upto critical point of voltage stability in the system is shown through proper output curves. These investigations indicate the need of power flow analysis and location of STATCOM on the proposed system.
Keywords: Flexible AC Transmission Systems (Facts), Static Synchronous Compensator(STATCOM), Power Flow Analysis, Ranking Analysis, Voltage Regulation
1. INTRODUCTION
The power flow studies are very common in power system analysis. Load flow allows us to know the present state of a system, given previous known parameters and values. The power that is flowing through the transmission line and its generated by the generators, the power that is being consumed by the loads, the losses occurring during the transfer of power from source to load and so on all are iteratively decided by the load flow solution or also known as power flow solution. In any system, the most important quantity is known as the voltage at different points throughout the system. Flexible AC transmission system (FACTS) controllers are able to change the power system parameters in an effective way. In FACTS controller , the STATCOM is used for enhancing the performance of power system. The voltage and angle stability are improved by the concern of STATCOM.
2. NEED OF COMPUTATIONAL ALGORITHM
The mathematical algorithms are used to compute the unknown quantities from the known ones through a process of successive trial and error methods and consequently produce a result. The initial values of the system are assumed and the program computes the successive quantities. The load flow solution is needed to determine the overloading of particular elements in the system. It is also used to make sure that the generators run at the ideal operating point, which ensures that the demand will be met without overloading the facilities and either maintains them without compromising the security of the system or the demand. The objectives of any load flow analysis is to produce the following information
• Voltage magnitude and phase angle at each bus. • Real and reactive power flowing in each element. • Reactive power loading on each generator.
2.1 Power Flow Equations of n Bus System with STATCOM
controllable voltage source of STATCOM is denoted as Vt in series with Zt impedance.
The power flow equations of the system with STATCOM connected to bus ‘S’ are the same as power flow equations of the system without STATCOM for all buses except STATCOM connected bus ‘S’. The following equations are power flow equations for bus ‘S’.
Figure 1: STATCOM connection in a bus
n
s t s sj j s j sj
j 1
P
P
V Y V cos(
)
=
= +
∑
δ − δ − θ
(1)
n
s t s sj j s j sj
j 1
Q
Q
V Y V cos(
)
=
= +
∑
δ −δ −θ
(2)
The summation terms of the injected active and reactive power for the system,
2
t t s s t t s t t
P
= +
G V
−
V Y V cos(
δ −δ −θ
)
(3)
2
t t s s t t s t t
Q
= −
B V
−
V Y V sin(
δ −δ −θ
)
(4) Where Vt ,δt, Yt and θt are noted in figure 1
and other variables were given in equations (3) and (4).
One more equation is needed to solve the power flow problem. This equation is needed to find the power consumed by the source Vt . The
power must be zero in steady state condition.
2 *
t
vt t t t s t t t s t
P Real VI
=
=−
GV
+
V Y V cos(
δ −δ −θ =
) 0
(5)
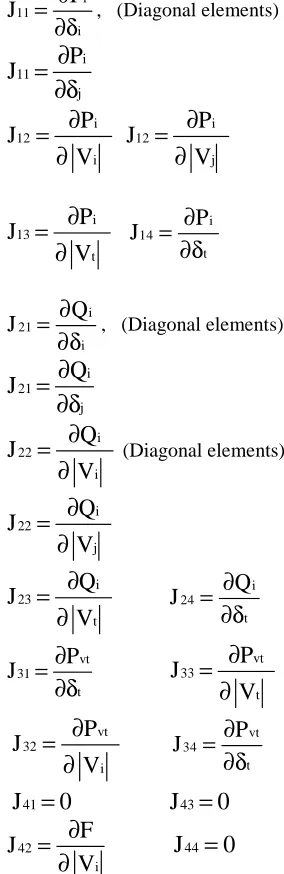
2.2 Jacobian Equation with STATCOM
As per the above equations, the new power flow problem with STATCOM has to be solved. The linearized Jacobian equation is extended and modified as per new Jacobian equation below.
11 12 13 14 i
i
21 22 23 24 i
i
31 32 33 34 t
vt
41 42 43 44 t
J
J
J
J
P
J
J
J
J
V
Q
J
J
J
J
V
P
J
J
J
J
F
∆δ
∆
∆
∆
=
∆
∆
∆δ
∆
(6)
where control variable for jacobian matrix, F=Vs.
3. IEEE 14 BUS SYSTEM
IEEE 14 bus system is used to test the power flow analysis without and with STATCOM. The IEEE14 bus test system is shown in figure 2. Here, the STATCOM is connected randomly at different buses. The voltage of all buses is heavily affected for the increasing load. The STATCOM is randomly connected and power flow losses for various buses are calculated to improve the voltage profile and also compensate the reactive power of whole system. Using the Newton Raphson method, the following analysis are made,
i) To find base load losses of all buses and also total losses of IEEE 14 bus system. ii) To find load losses of all buses and also
total losses for different load variation without STATCOM
iii) To find load losses of all buses and also total losses for different load variation with STATCOM
Initially the 14 bus system is tested without STATCOM. The real and reactive power flow is analysed by using the Newton Raphson method.
ISSN: 1992-8645 www.jatit.org E-ISSN: 1817-3195
Figure 2: IEEE 14 Bus Test System
Initially the system is investigated during steady state .A comparative analysis is made with different loading conditions. The load is increased keeping 40% of the load at the start.
4. STABILITY OF POWER SYSTEM
Modern electric power system is a complex network of synchronous generators, transmission lines and loads. Electric utilities first acted as isolated systems, and then gradually neighboring utilities began to join forming large interconnected networks. This enabled the utilities to draw on each other’s generation reserves during the time of need.
Three phase fault or sudden load switching which creates transients. This makes the system to be unstable which is very worse. A good power system should possess the ability to regain its normal operating condition after a disturbance. Since the ability to supply uninterrupted electricity determines the quality of electric power supplied to the load, stability is regarded as one of the important topics of power system research[2, 3, 4].
5. OPTIMAL ALLOCATION OF STATCOM
STATCOM devices can be used to control power flows in large power system networks. STATCOM types and locations should be reasonably chosen according to their contribution to the general objective of power system economic generation and dispatch. In this research, using the MATLAB m-file program, the locations of the STATCOM devices are optimized simultaneously along with the rated values. The objective cost
function, is to minimize the investment costs for STATCOM devices and the generation costs.[5]
5.1 Rating of STATCOM
The nature and the type of faults that the system need to overcome decides the size of the STATCOM. Although the final rating of the STATCOM is determined based on system economics, the rating chosen must be atleast adequate for the system to be stable after a fault or temporary system disturbances. The STATCOM ratings are based on many parameters which are mostly governed by the amount of reactive power the system needs to recover and ride through system faults on the power system and to reduce the interaction of other system causing disturbances. This causes out of synchronism with the grid. The nature and the type of faults that the system need to overcome decides the size of the STATCOM. For example, a three phase fault of low impedance requires a very high rating STATCOM.A high impedance short circuit fault needs a lower rating device[5]. This support is needed to stabilize the system after a disturbance. The capability of the STATCOM is also decided based on the converter current ratings and the size of the capacitor. The devices in a voltage source converter are clamped against over-voltages across the DC link capacitor bank to minimize losses and not have to withstand large spikes in reverse over-voltage [5].
5.2 Effective Location of STATCOM
Simulation results show that STATCOM provides effective voltage support at the bus to which it is connected to. The STATCOM is placed as close as possible to the load bus for various reasons. There are two important reason for choosing the location of STATCOM.
i)The location of the reactive power support should be as close as possible to the point at which the support is needed.
ii) The location of the STATCOM at the load bus is more appropriate.
The location of the STATCOM is based on quantitative benefits evaluation. The main benefits of using a STATCOM in the system are reduced losses and increased maximum transfer capability. [6]
I2R losses. The location of STATCOM is generally
chosen to be the location in the system which needs reactive power. Shipping of reactive power at low voltages in a system running close to its stability limit is not very efficient.[6]
Also, the transmission line power factor limiting factors decides the total amount of reactive power transfer available in the system. This proves that sources and compensation devices are to be kept as close as possible to the load.
6. REACTIVE POWER SUPPORT FROM COMPENSATING DEVICE
The amount of reactive power supplied by any compensating device depends on the voltage drop at the bus and its capabilities. For example, a STATCOM can supply its maximum rated compensating current even at lower voltages. The reactive power that can be supplied, but usually they have some extra capability called the transient capability which is available to the system for a short period of time. The reactive power supplied is also dependent on the immediate reactive power sources in the system [6].
7.
SIMULATION AND TEST RESULTS7.1 Real and Reactive Power Variation
The following results are shown to compensate the real power and reactive power losses for the load variation. Here due to the reactive power variation, the voltage of all buses are improved with rated value by connection of STATCOM
.
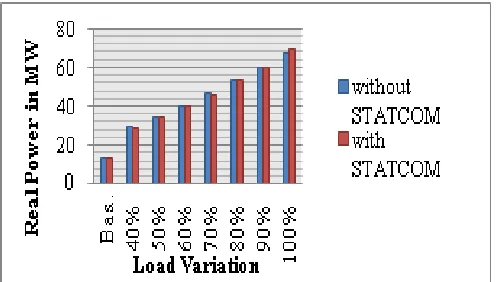
The change in real and reactive power [image:4.612.323.572.138.279.2]for different load variation is shown in Figure 3 and Figure 4 respectively. The position of STATCOM is varied and adjusted slightly for the real and
reactive power compensation and losses for the load variation are calculated.
[image:4.612.317.574.320.472.2]Figure 3: Real Power variation without and with STATCOM
Figure 4: Reactive Power variation without and with STATCOM
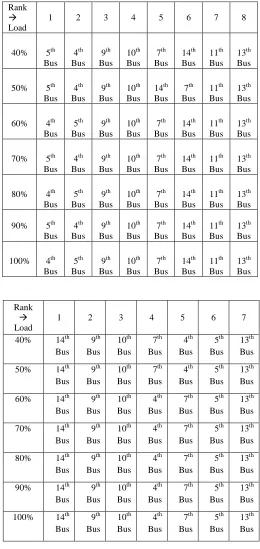
Table 1: Ranking List for Voltage Variation
Load
Losses without STATCOM
Losses with STATCOM
MW MVar MW MVar
Base load 13.555 57.077 13.443 56.632
40% Load 29.413 120.407 28.946 117.123
50% Load 34.487 140.676 34.044 136.477
60% Load 40.078 162.885 39.594 158.802
70% Load 46.200 187.134 45.898 182.359
80% Load 52.866 213.541 53.128 210.427
90% Load 60.124 242.216 60.402 239.061 100%
[image:4.612.310.568.551.717.2]ISSN: 1992-8645 www.jatit.org E-ISSN: 1817-3195
Table 2: Ranking List for Reactive Power Variation
Rank Load
1 2 3 4 5 6 7 8
40% 5th Bus 4th Bus 9th Bus 10th Bus 7th Bus 14th Bus 11th Bus 13th Bus
50% 5th Bus 4th Bus 9th Bus 10th Bus 14th Bus 7th Bus 11th Bus 13th Bus
60% 4th Bus 5th Bus 9th Bus 10th Bus 7th Bus 14th Bus 11th Bus 13th Bus
70% 5th Bus 4th Bus 9th Bus 10th Bus 7th Bus 14th Bus 11th Bus 13th Bus
80% 4th Bus 5th Bus 9th Bus 10th Bus 7th Bus 14th Bus 11th Bus 13th Bus
90% 5th Bus 4th Bus 9th Bus 10th Bus 7th Bus 14th Bus 11th Bus 13th Bus
100% 4th Bus 5th Bus 9th Bus 10th Bus 7th Bus 14th Bus 11th Bus 13th Bus Rank Load
1 2 3 4 5 6 7
40% 14th Bus 9th Bus 10th Bus 7th Bus 4th Bus 5th Bus 13th Bus
50% 14th Bus 9th Bus 10th Bus 7th Bus 4th Bus 5th Bus 13th Bus
60% 14th Bus 9th Bus 10th Bus 4th Bus 7th Bus 5th Bus 13th Bus
70% 14th Bus 9th Bus 10th Bus 4th Bus 7th Bus 5th Bus 13th Bus
80% 14th Bus 9th Bus 10th Bus 4th Bus 7th Bus 5th Bus 13th Bus
90% 14th Bus 9th Bus 10th Bus 4th Bus 7th Bus 5th Bus 13th Bus
The affected buses are ranked in 14th, 9th and 10th buses respectively by voltage variation. Here rank list is only analysed and verified for finding the real and reactive power variation. The variation in power with increasing loads is listed with and without STATCOM in Table 3. The transmission losses are reduced and reactive power is compensated with the help of STATCOM. The ranking is prepared for reactive power compensation in various loads by STATCOM. The ranking list is given in Table 2.This ranking analysis is very useful in analyzing the effective location of STATCOM.
7.2 Voltage Curve for Load Variation
[image:6.612.315.457.262.699.2]By connection of STATCOM, the voltage of all buses are improved and is found to be above 1 p.u. The voltage regulation performance of the STATCOM is clearly shown in figure 5. Here due to the reactive power variation, the voltage of all buses are improved with rated value by connection of STATCOM. From the graph, it is inferred that the system performance can be improved to a greater extent with the connection of STATCOM.
[image:6.612.92.305.386.487.2]Figure 5: Voltage Curve for Load Variation
Table 3: Real and Reactive Power Losses
Without the connection of STATCOM ,the system performance is not in a appreciable level hence the losses are more. By connecting the STATCOM in a effective location the real and reactive power losses are reduced.
CONCLUSION
The power flow analysis without and with STATCOM is performed on IEEE-14 bus system. The IEEE-14 bus system and STATCOM are modeled using MATLAB m-file. By injecting the additional voltage and power angle, the transmission losses are analyzed for various buses. The STATCOM is connected in different buses for
different loads. The transmission losses are calculated and compared with other buses which is connected with STATCOM. The location of STATCOM on IEEE-14 bus system are identified by ranking analysis for voltage variation and reactive power compensation. The STATCOM gives better reactive power compensation and voltage regulation in 4th, 5th ,9th and 10th buses respectively.
APPENDIX:
As per the above Jacobian matrix, the elements are
i 11
i
P
J
=
∂
∂δ
, (Diagonal elements)i 11
j
P
J
=
∂
∂δ
i 12 iP
J
V
∂
=
∂
i 12 jP
J
V
∂
=
∂
i 13 tP
J
V
∂
=
∂
i 14 tP
J
=
∂
∂δ
i 21
i
Q
J
=
∂
∂δ
, (Diagonal elements)i 21
j
Q
J
=
∂
∂δ
i 22 iQ
J
V
∂
=
∂
(Diagonal elements)i 22 j
Q
J
V
∂
=
∂
i 23 tQ
J
V
∂
=
∂
i 24 tQ
J
=
∂
∂δ
vt 31
t
P
J
=
∂
∂δ
vt 33 tP
J
V
∂
=
∂
vt 32 iP
J
V
∂
=
∂
vt 34 tP
J
=
∂
∂δ
41
J
=
0
43
J
=
0
42 i
F
J
V
∂
=
∂
44J
=
0
ISSN: 1992-8645 www.jatit.org E-ISSN: 1817-3195
REFERENCES:
[1]. G.W.Stagg and A.H.EL-abaid, “Computer methods in power systems (New York hills, 1968).
[2]. N.G. Hingorani, L. Gyugyi, Understanding FACTS – Concepts and technology of Flexible AC Transmission Systems, IEEE Press, 2000.
[3]. P.M. Anderson and A.A.Fouad, “Power system control and stability”, Iowa state university press, 1980.
[4]. L.J. Cai and I. Erlich, " Simultaneous Coordinated Tuning of PSS and FACTS Damping Controllers in Large Power Systems, " IEEE Transactions on Power Systems. [5]. Xiao-Ping Zhang, , Ping Ju” Continuation
Three-Phase Power Flow: A Tool for Voltage Stability Analysis of Unbalanced Three-Phase Power Systems” IEEE transactions on power systems.
[6]. H. Okamoto, A. Kurita, Y.Sekine,”A method for identification of effective locations of variable impedence apparatus on enhancement of steady-state stability in large scale power systems”, IEEETransactions on Power Systems.
[7]. Gabriela Hug-Glanzmann, G¨oran Andersson,Zurich, Switzerland.,” Coordinated Control of FACTS Devices in Power Systems for Security Enhancement” iREP Symposium - Bulk Power System Dynamics and Control. [8]. Sidhartha Panda and Narayana Prasad
Padhy,”Power System with PSS and FACTS Controller: Modelling, Simulation and Simultaneous Tuning Employing Genetic Algorithm”, international journal of electrical, computer, and systems engineering.