Gamma Ray Shielding Studies on (100 – x) TeO
2
–
x ZnCl
2
Glasses
Ramandeep Kaur1, Balkrishan2, Rajesh Khatri3, Ashok Kumar4,
1
Department of Physics, Punjabi University, Patiala, Punjab, India.
2
Department of Physics, University College, ChuniKalan, Punjab, India.
3
Department of Physics, DAV College, Abohar, Punjab, India.
4
Department of Physics, University College, Benra-Dhuri, Punjab, India.
Abstract: Gamma – ray shielding parameters for (100 – x) TeO2 – x ZnCl2 (where x = 10, 20, 30, 40 and 60 mol %) glasses were
investigated. The mass attenuation coefficients (µm) have been calculated using Win XCOM software at 0.122, 0.356, 0.511,
0.662, 0.840, 1.17, 1.275, 1.33 Me V respectively. These coefficients were then used to calculate the other shielding parameters such as linear attenuation coefficient (µ), effective atomic number (Zeff), electron density (Ne) and mean free path (MFP) values.
The variation of these shielding parameters with energy has also been discussed. It has been observed that the sample containing higher percentage composition of TeO2 should be considered as best shielding material due to the higher value of Zeff and lower
values of MFP. The shielding efficiencies of these samples have also been compared to the standard shielding concretes in terms of MFP.
I. INTRODUCTION
Many radioactive waste materials acquire highly penetrating radiations such as gamma rays affects human body or receivers [1]. The exposure of gamma rays and neutron is controlled by using shielding materials [2]. Therefore, many researchers have great interest to develop the radiation shielding materials. These materials are used in different fields such as nuclear reactors, nuclear waste storage sites, outer space exploration, agriculture and industries to attenuate the gamma radiations and neutrons [3]. Concrete is used mostly for radiation shielding because it is inexpensive and adaptable for any construction design [4]. But concrete has many disadvantages such as variation in its composition and water content [5]. Water content decreases the density and structural strength of concrete [6]. Heavy metal oxide glasses can be used as a shielding material because glasses are transparent to visible light and its properties can be modified with composition and preparation techniques [7].Nowadays, there has been a great interest among researchers to study the shielding properties of tellurite glasses due to their extraordinary properties such as high infrared transparency, high refractive index, low melting temperature, low glass transition temperature, low phonon energy and high dielectric constant [8]. These glasses are used in nonlinear optical micro devices and solid state batteries [9]. The shielding parameters such as effective atomic number and electron density are required to study the penetration of gamma rays [10]. In our present work, we study tellurite based glasses of composition (100 – x) TeO2 – x ZnCl2 (where x = 10, 20, 30, 40 and 60 mol %).
The shielding parameters such as mass attenuation coefficient, effective atomic number, electron density, mean free path was calculated using Win XCOM program.
A. Theory
The mass attenuation coefficient values were determined by using mixture rule [11]: µm = ∑ µ
where (µm)i is the mass attenuation coefficient for single element in glass sample and wi is the fractional weight of that element in
the sample.
The value of linear attenuation coefficient was calculated by multiplying mass attenuation coefficient with density [12]:
µ = µm × ρ
where µ is the linear attenuation coefficient of the present glass sample and ρ is the density of the sample.
MFP = µ
The total atomic cross-section, σt, a (barn/atom) and total electronic cross-section, σt, el (barn/atom) was used to determine the Zeff
using the following relation [14]: Zeff =
σ,
σ,
whereσt, a =
µ
∑ and σt, el = ∑ (µ )ᵢ
where M is the molar mass, NA is the Avogadro’s constant ni is the number of atoms of the element i having atomic weight Ai
,where fi is the number of atoms of the element relative to the total number of atoms and Zi is the atomic number of the element
i.The electron density of the glass sample can be derived from following formula [15 - 16]:
Ne = µ
σ, = NA∑
II. RESULTS AND DISCUSSION
[image:3.612.99.514.317.426.2]The chemical composition, density and weight fraction of each element of the present five glasses are represented in Table1.
Table 1. Chemical composition and density of the selected glass samples Sample Mole fraction Weight fraction of elements present
in the sample
Density (g/cm3)
TeO2 ZnO ZnCl2 Te Zn Cl O
S1 90 0 10 0.73022 0.04158 0.04509 0.18312 5.30
S2 80 0 20 0.65884 0.08441 0.09153 0.16522 5.21
S3 70 0 30 0.58529 0.12855 0.13939 0.14678 5.15
S4 60 0 40 0.50946 0.17405 0.18873 0.12776 5.06
S5 40 0 60 0.35051 0.26943 0.29216 0.08790 4.91
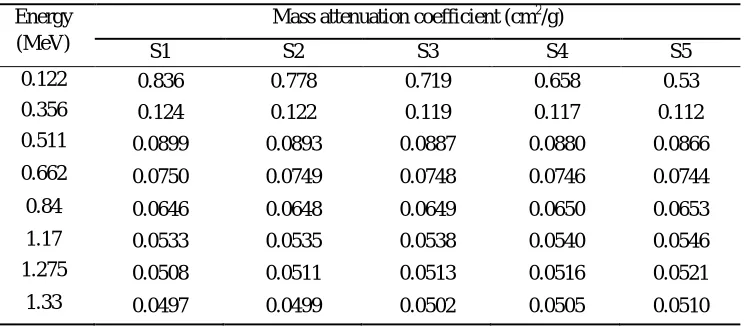
The mass attenuation coefficient have been determined using Win XCOM software at 0.122, 0.356, 0.511, 0.662, 0.840, 1.17, 1.275, 1.33 MeV respectively and presented in Table2.
Table 2: Mass attenuation coefficient of the selected glasses Energy
(MeV)
Mass attenuation coefficient (cm2/g)
S1 S2 S3 S4 S5
0.122 0.836 0.778 0.719 0.658 0.53
0.356 0.124 0.122 0.119 0.117 0.112
0.511 0.0899 0.0893 0.0887 0.0880 0.0866
0.662 0.0750 0.0749 0.0748 0.0746 0.0744
0.84 0.0646 0.0648 0.0649 0.0650 0.0653
1.17 0.0533 0.0535 0.0538 0.0540 0.0546
1.275 0.0508 0.0511 0.0513 0.0516 0.0521
1.33 0.0497 0.0499 0.0502 0.0505 0.0510
The variation of mass attenuation coefficient of the selected samples with incident photon energy has been shown in Fig1. The values of mass attenuation coefficient decreases gradually as the photon energy increases from 0.122 – 1.17 MeV region. As shown in Table1. the µm values of the present glasses decreases from 0.836 - 0.0497, 0.778 – 0.0499, 0.719 – 0.0502, 0.658 – 0.0505 and
[image:3.612.123.495.487.650.2]0.0 0.2 0.4 0.6 0.8 1.0 1.2 1.4 0.0 0.2 0.4 0.6 0.8 --- M a s s a tt e n u a ti o n c o e ff ic ie n t --->
[image:4.612.172.429.94.231.2]--- Energy ---> S1 S2 S3 S4 S5
Fig.1. Variation of mass attenuation coefficient with energy
The value of µm is maximum for S1 and minimum for S5 for 0.122, 0.356, 0.511 and 0.662 energy ranges. This is due to decrease in
percentage composition of TeO2 as we go from S1 to S5. But for higher energy region (0.840, 1.17, 1.275, 1.33 MeV) the value of
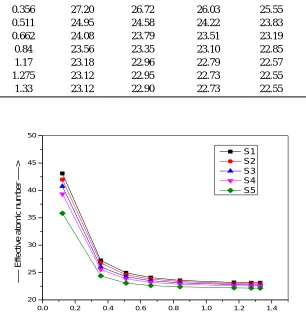
µm increases as we go from S1 to S5.The variation of effective atomic number (Zeff) of the present glasses with photon energy is
[image:4.612.123.489.342.477.2]shown in Fig.2 and the values of Zeffof these glasses are presenting in Table 3.
Table 3: Effective atomic number of the selected glasses Energy
(MeV)
Effective atomic number
S1 S2 S3 S4 S5
0.122 43.10 41.97 40.75 39.35 35.82
0.356 27.20 26.72 26.03 25.55 24.38
0.511 24.95 24.58 24.22 23.83 23.05
0.662 24.08 23.79 23.51 23.19 22.62
0.84 23.56 23.35 23.10 22.85 22.38
1.17 23.18 22.96 22.79 22.57 22.19
1.275 23.12 22.95 22.73 22.55 22.14
1.33 23.12 22.90 22.73 22.55 22.14
0.0 0.2 0.4 0.6 0.8 1.0 1.2 1.4 20 25 30 35 40 45 50 --- E ff e c ti v e a to m ic n u m b e r --->
--- Energy --->
S1 S2 S3 S4 S5
[image:4.612.130.436.379.695.2]The values of Zeff ranges from 43.09 – 23.12, 41.97 – 22.90, 40.75 – 22.73, 39.35 – 22.55 and 35.82- 22.14 for S1, S2, S3, S4 and
S5 respectively. The values of Zeff decreases as photon energy increases which is due to the dominance of Compton scattering
process in the given energy region. S1 have highest value of Zeff due to the presence of higher concentration of TeO2 present in the
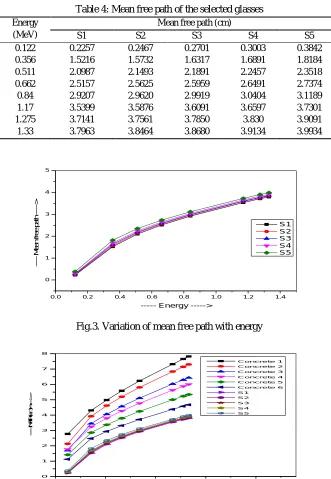
sample. The variation of MFP of the present glasses with photon energy are shown in Fig 3. The values of MFP are determined from mass attenuation coefficient and are presenting in Table 4. It is clear that the MFP increases as photon energy increases from 0.122 – 1.33 MeV. Fig 3 shows that MFP posses maxima for S5 and minima for S1. Lower is the value of MFP, better is the shielding material. Therefore, we can say that S1 should be considered as best shielding material among all the present samples. This is due to the fact that the Zeff is maximum for S1 and minimum for S5. The comparison of the MFP of the glasses with standard concretes are
[image:5.612.137.468.216.695.2]shown in Fig. 4. The present glasses are having lower values of the MFP compared to the MFP of the standard shielding concretes. The selected glasses are having better shielding efficiencies.
Table 4: Mean free path of the selected glasses Energy
(MeV)
Mean free path (cm)
S1 S2 S3 S4 S5
0.122 0.2257 0.2467 0.2701 0.3003 0.3842
0.356 1.5216 1.5732 1.6317 1.6891 1.8184
0.511 2.0987 2.1493 2.1891 2.2457 2.3518
0.662 2.5157 2.5625 2.5959 2.6491 2.7374
0.84 2.9207 2.9620 2.9919 3.0404 3.1189
1.17 3.5399 3.5876 3.6091 3.6597 3.7301
1.275 3.7141 3.7561 3.7850 3.830 3.9091
1.33 3.7963 3.8464 3.8680 3.9134 3.9934
0.0 0.2 0.4 0.6 0.8 1.0 1.2 1.4 0 1 2 3 4 5 --- M e a n f re e p a th - -->
--- Energy --->
[image:5.612.138.476.233.357.2]S1 S2 S3 S4 S5
Fig.3. Variation of mean free path with energy
0.0 0.5 1.0 1.5 2.0
0 1 2 3 4 5 6 7 8 --- M F P ( c m ) --->
--- Energy (MeV) --->
Concrete 1 Concrete 2 Concrete 3 Concrete 4 Concrete 5 Concrete 6 S1 S2 S3 S4 S5
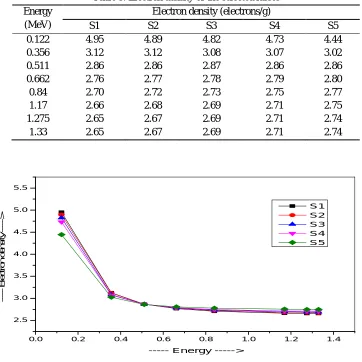
[image:5.612.163.436.565.708.2]The behavior of electron density with incident photon energy is shown in Fig.5 and their values are presenting in Table 6.
Table 5: Electron density of the selected lasses Energy
(MeV)
Electron density (electrons/g)
S1 S2 S3 S4 S5
0.122 4.95 4.89 4.82 4.73 4.44
0.356 3.12 3.12 3.08 3.07 3.02
0.511 2.86 2.86 2.87 2.86 2.86
0.662 2.76 2.77 2.78 2.79 2.80
0.84 2.70 2.72 2.73 2.75 2.77
1.17 2.66 2.68 2.69 2.71 2.75
1.275 2.65 2.67 2.69 2.71 2.74
1.33 2.65 2.67 2.69 2.71 2.74
0.0 0.2 0.4 0.6 0.8 1.0 1.2 1.4 2.5
3.0 3.5 4.0 4.5 5.0 5.5
---
E
le
c
tr
o
n
d
e
n
s
it
y
-
-->
--- Energy --->
S1 S2 S3 S4 S5
Fig.5. Variation of electron density with energy of the selected glass samples
The value of Ne increases with photon energy as we go from S1 to S5. The number of electrons present in the S1 is maximum due to
the higher value of Zeff. S1 is having the highest value of Ne due to the presence of higher concentration of TeO2 present in it.
III. CONCLUSION
In this work, gamma ray shielding features for different compositions of (100 – x) TeO2 – x ZnCl2 glasses were investigated at
0.122, 0.356, 0.511, 0.662, 0.840, 1.17, 1.275, 1.33 Me V energies respectively. From investigation, it has been observed that the values of µm, ,Zeff and Neof the prepared glass samples decreases with increase in incident photon energy of gamma rays whereas the
values of MFP increases with energy. The present glasses are having lower values of the MFP compared to the MFP of the standard shielding concretes. The selected glasses are having better shielding efficiencies. Among the samples, S1 is the best shielding material due to presence of higher percentage composition of TeO2.Thus the present glasses are useful to control the exposure of
radiations.
REFERENCES
[1] A. M. Osman, M. A. El-Sarraf, A. M. Abdel-Monem, A. El-SayedAbdo, “Studying the shielding properties of lead glass composites using neutrons and gamma rays”, Annals of Nuclear Energy, 78 (2015) 146 - 151.
[2] Ashok Kumar, M. I. Sayyed, MenggeDong, XiangxinXue, “Effect of PbO on the shielding behavior of ZnO–P2O5 glass system using Monte Carlo simulation”, Journal of Non-Crystalline Solids, 481 (2018) 604 – 607.
angle on the gamma ray buildup factor”, Annals of Nuclear Energy, 35 (12) (2008) 2412 – 2416.
[5] KulwinderKaur, K. J. Singh, VikasAnand, “Correlation of gamma ray shielding and structural properties of PbO – BaO – P2O5 glass system”, Nuclear Engineering and Design 285 (2015) 31 – 38.
[6] K. J. Singh, N. Singh, R. S. Kaundal, K. Singh, “Gamma ray shielding and structural properties of PbO – SiO2 glasses”, Nuclear Instruments and Methods in Physics Research B, 266 (2008) 944 – 948.
[7] KulwinderKaur, K. J. Singh, VikasAnand, “Structural properties of Bi2O3 – B2O3 – SiO2 – Na2O glasses for gamma ray shielding applications”, Radiation Physics and Chemistry, 120 (2016) 63 – 72.
[8] G. Upender, S. Ramesh, M. Prasad, V. G. Sathe, V. C. Mouli, “Optical band gap, glass transition temperature and structural studies of (100-2x) TeO2 – xAg2O – xWO3 glass system”, Journal of Alloys and Compounds, 504 (2010) 468-474.
[9] M.I. Sayyed, S.I. Quashu, Z.Y. Khattari, “Radiation shielding competence of newly developed TeO2-WO3 glasses”, Journal of Alloys and Compounds, S0925-8388(16)33640 – 4.
[10]Ashok Kumar, Sukhpal Singh, Gurmel S. Mudahar, Kulwant Singh Thind, “Studies on Effective Atomic Numbers and Electron Densities in Some Commonly Used Solvents”, Nuclear Science and Engineering, 155 (2007) 102 – 108.
[11]M. G. Dong, R. El – Mallawany, M. I. Sayyed, H. O. Tekin, “Shielding properties of 80TeO2-5TiO2-(15-x)WO3-xAnOm glasses using WinXcom and MCNP code”, Radiation Physics and Chemistry, S0969-806X(17)30139-1.
[12]S Singh, A Kumar, K SThind, G. S. Mudahar, “Measurements of linear attenuation coefficients of irregular shaped samples by two media method”, Nuclear Instruments and Methods in Physics Research Section B: Beam interactions with materials and atoms, 266 (2008) 1116 – 1121.
[13]Ashok Kumar, “Gamma ray shielding properties of PbO – Li2O – B2O3 glasses”, Radiation Physics and Chemistry, 136 (2017) 50 – 53.
[14]Sukhpal Singh, Ashok Kumar, Devinder Singh, Kulwant Singh Thind, Gurmel S. Mudahar, “Barium – borate – flyash glasses: As radiation shielding materials”, Nuclear Instruments and Methods in Physics Research B, 266 (2008) 140 – 146.
[15]Mengge Dong, XiangxinXue, Ashok Kumar, He Yang, M.I. Sayyed, Shan Liu, Erjun Bu, “A novel method of utilization of hot dip galvanizing slag using the heat waste from itself for protection from radiation”, Journal of Hazardous Materials, S0304-3894(17)30821-X.