Virus Quantification
Veronique Descamps, Elodie Martin, Virginie Morel, Catherine François, François Helle, Gilles Duverlie, Sandrine Castelain, Etienne Brochot
Department of Virology, Amiens University Medical Center, Amiens, France; Virology Research Unit, EA 4294, Jules Verne University of Picardie, Amiens, France
With the growing importance of BK virus (BKV), effective and efficient screening for BKV replication in plasma and urine sam-ples is very important for monitoring renal transplant and hematopoietic stem cell transplant recipients, who are at increased risk of BKV-associated diseases. However, recent assays proposed by many manufacturers have not been tested, and the avail-able tests have not been standardized. The aim of the present study was to evaluate and compare the performances of three com-mercially available kits, R-gene, GeneProof, and RealStar, on plasma and urine specimens from patients infected with various genotypes and to determine the correlations with the results from a reference laboratory. A qualitatively excellent global agree-ment (96.8%) was obtained. RealStar PCR tended to give a higher sensitivity, especially for subtype Ib1 samples. Comparison of 30 plasma samples and 53 urine samples showed a good agreement between the three assays, with Spearman’s Rho correlation coefficient values falling between 0.92 and 0.98 (P<0.001). Moreover, a perfect correlation was obtained for comparison of the assay performances with the AcroMetrix BKV panel (P<0.001 for all comparisons). According to Bland-Altman analysis, more than 95% (240/249 comparisons) of sample comparisons were situated in the range of the meanⴞ2 standard deviations (SD). The greatest variability between assays was observed for 10.2% of subtype Ib2 samples, with differences of>1 log10copies/ml. In
conclusion, this study demonstrated the reliable and comparable performances of the R-gene, GeneProof, and RealStar real-time PCR systems for quantification of BKV in urine and plasma samples. All three real-time PCR assays are appropriate for screen-ing of BKV replication in patients.
B
K virus (BKV) is a double-stranded DNA virus belonging to the Polyomaviridae family that causes chronic and usually asymptomatic infections in immunocompetent individuals. Dur-ing initial infection, virions infect urothelial cells and establish latent infection. BKV reactivation in renal transplant recipients (RTR) is increasingly recognized as an opportunistic infection, particularly with the introduction of more potent immunosup-pressive agents (1). Typically, viral particles are first detected in the urine, and this may be followed by viremia. High levels of BKV reactivation can lead to BKV-associated nephropathy (BKVAN), leading to graft failure in 20 to 80% of affected patients (2). In bone marrow transplant recipients, BKV reactivation may result in hemorrhagic cystitis. Molecular analyses of numerous isolates have led to the classification of the BKV genus into several sub-types (Ia, Ib1, Ib2, Ic, II, III, IVa, IVb, and IVc), based on phylo-genetic analyses of full-genome viral DNA sequences (3,4). The various genotypes have a specific geographic distribution in the population (5). Genotype I is widespread, genotype IV is predom-inant in East Asia, and genotypes II and III are rarely detected (6). Accurate monitoring of BKV DNA loads is essential for a suc-cessful transplant program, and BKV DNA loads could also be surrogate markers for adjustment of immunosuppressive therapy. The diagnosis of BKV infection is based on blood or urine screen-ing. BKV VL testing to predict BKVAN has greatly improved pa-tient management, and renal transplant societies have instituted BKV screening protocols. Guidelines currently recommend that all RTR be screened regularly for BKV replication in plasma or urine (7,8).RTR are screened every 3 months for up to 2 years posttrans-plantation or in the context of allograft dysfunction (9). With the growing importance of BKV in the management of immunocom-promised patients over recent years, several manufacturers have
developed commercial blood and urine BKV DNA quantification assays based on real-time PCR technology. Our knowledge of BKV genomic diversity has also improved considerably (4, 10), as a large number of studies of full-genome BKV DNA have been pub-lished over the last decade (3,11). However, it is very difficult to provide clinicians with accurate data, because most methods are in-house methods and no international standards have yet been established to allow comparisons between different tests. In addi-tion, not all of the tests recently developed by manufacturers have been evaluated and compared, and measurements of BKV loads by real-time PCR assays have also been shown to vary according to BKV subtype (12,13).
The aim of the present study was to evaluate and compare the performances of three commercially available kits, R-gene (Argene, France), GeneProof (GeneProof, Czech Republic), and RealStar (Altona Diagnostics, Germany), on plasma and urine specimens from various patients infected with genotypes I and IV. The three PCR assays were also tested on the AcroMetrix BKV panel and by longitudinal monitoring of patients. These three assays were found to be broadly comparable, providing reliable
Received6 August 2015 Returned for modification25 August 2015
Accepted23 September 2015
Accepted manuscript posted online30 September 2015
CitationDescamps V, Martin E, Morel V, François C, Helle F, Duverlie G, Castelain S,
Brochot E. 2015. Comparative evaluation of three nucleic acid-based assays for BK virus quantification. J Clin Microbiol 53:3822–3827.doi:10.1128/JCM.02116-15.
Editor:A. M. Caliendo
Address correspondence to Etienne Brochot, [email protected].
Copyright © 2015, American Society for Microbiology. All Rights Reserved.
on May 16, 2020 by guest
http://jcm.asm.org/
results regardless of the type of sample and viral genotype and providing additional testing options for clinical laboratories.
MATERIALS AND METHODS
Clinical sample.A total of 94 urine and plasma samples, collected from 56 RTR, were selected for this study and were analyzed with the three real-time PCR assays. Among these patients, 5 were negative for BKV DNA. Epidemiological and BKV genotype data for each positive BKV DNA pa-tient are shown inTable 1. Five samples of the AcroMetrix BKV panel (Thermo Fisher Scientific) were also tested by the three assays. This study was approved by the Institution Review Board of Amiens University Hos-pital.
Nucleic acid extraction.Viral DNA was extracted from 200l of urine or plasma. A specific internal inhibition control (IC) was added to the lysis buffer (10l of IC for the R-gene test, 20l of IC for the GeneProof test, and 5l of IC for the RealStar test) and simultaneously purified with viral DNA by using specific protocol B of the NucliSENS easyMAG system (bioMérieux, France). The extracted DNA was eluted with 50l of elution buffer and frozen at⫺80°C before use.
Real-time PCR.BKV DNA was amplified on an ABI Prism 7500 SDS machine (Life Technologies, France). All three quantitative PCR (qPCR) assays used 5=nuclease TaqMan technology and comprised multiplex PCRs for simultaneous amplification of the internal control, which was used to verify the absence of PCR inhibitors in the amplification process and to ensure the quality of DNA extraction. Viral DNA quantification was determined by standard curve analysis, using a standard curve gener-ated by amplification of specific quantification standards (QS). A BKV-negative control was added to each run. The characteristics of each PCR are as follows.
(i) R-gene test.BKV sequences from the small t antigen (t-Ag) gene were amplified with a 6-carboxyfluorescein (FAM)-labeled probe, and a VIC-labeled probe was used for internal control DNA amplification. PCR was performed in a 25-l volume containing 15l of amplification pre-mix and 10l of standard or sample DNA, using the following amplifica-tion profile: 1 cycle of 15 min at 95°C followed by 45 two-step cycles of 95°C for 10 s and 60°C for 40 s. The dynamic quantification range was 2.14 to 11.00 log10copies/ml.
(ii) GeneProof test.BKV sequences overlapping the boundary be-tween the genes for the VP1 and VP2 proteins were amplified with a FAM-labeled probe, and a HEX-labeled probe was used for internal con-trol DNA amplification. PCR was performed in a 40-l volume contain-ing 30l of amplification premix and 10l of standard or sample DNA, using the following amplification profile: 1 cycle of 2 min at 37°C and 10 min at 95°C followed by 45 cycles of 95°C for 5 s, 60°C for 40 s, and 72°C for 20 s. The dynamic quantification range was 2.17 to 7.00 log10copies/ml.
(iii) RealStar test.BKV sequences from two regions, in the large T antigen (T-Ag) and small t antigen (t-Ag) genes, were coamplified with a dual FAM-labeled probe, and a JOE-labeled probe was used for internal
control DNA amplification. PCR was performed in a 30-l volume con-taining 20l of amplification premix and 10l of standard or sample DNA, using the following amplification profile: 1 cycle of 10 min at 95°C followed by 45 two-step cycles of 95°C for 15 s and 58°C for 60 s. The dynamic quantification range was 2.25 to 9.00 log10copies/ml.
None of the samples inhibited the internal positive control. For Gene-Proof and RealStar PCRs, a high BKV load in the sample could lead to a reduced internal control signal.
Genotyping.BKV subtyping was based on the amplification and se-quencing of a fragment within the VP-1 gene, from nucleotides 1480 to 2246 (DUN [Dunlop strain of BKV] numbering system). A fragment within the T-Ag gene, from nucleotides 2993 to 3738, was amplified and sequenced only for subtyping of genotype IV samples. DNA was amplified with Hot Start PCR master mix (Biotech Rabbit), using the published primer pairs VP1-3 plus SeqB-11 and SeqB-16 plus SeqB-19 (3,14). Cycle sequencing of the purified amplicons was performed using an Ap-plied Biosystems BigDye Terminator v1.1 kit according to the manufac-turer’s instructions. Sequences obtained were purified and read by use of an Applied Biosystems 3500 genetic analyzer. PCR primers were used as sequencing primers.
Statistical analysis.Statistical analysis was performed using R and GraphPad Prism software. The BKV load measurements were expressed in log10copies per milliliter. Samples were included in the statistical cal-culations if BKV DNA was detected by the three assays. Negative and discordant results were not included in the statistical calculations. Corre-lation coefficients were calculated using the Spearman test. The agreement between VL obtained with each assay is presented on a Bland-Altman graph. Only VL positive in all three assays are presented on Bland-Altman graphs. Results were considered to be quantitatively discordant if the re-sults of Bland-Altman analysis were located outside the range of the mean⫾1.96 standard deviations (SD), and results were considered to be qualitatively discordant if one BKV load measurement was positive by one method and negative by another method.
RESULTS
Patient characteristics and technical data for the three BKV quantification methods.The characteristics of the three commer-cial tests evaluated are presented inTable 2. The technical param-eters for these three tests are substantially similar, except for the locations of the primers. The primers of the R-gene test target a portion of the t-Ag gene, the primers of the GeneProof test target the junctional region of the genes encoding capsid proteins VP1 and VP2, and the primers of the RealStar test bind to two regions of the genome: within the genes encoding T-Ag and t-Ag. Ninety-four clinical specimens from 56 RTR, sent to the laboratory for routine polyomavirus measurements, were analyzed by these three real-time PCR assays. Among the 94 samples, 83 (53 urine and 30 plasma samples) were positive for BKV by the three PCR techniques. Eight specimens (6 urine and 2 plasma samples) were negative by the three methods, and 3 blood samples were qualita-tively discordant. The characteristics of the 56 patients are pre-sented inTable 1. The VL range for the positive samples was 2.30 to 10.59 log10copies/ml. Not surprisingly, mean VL were much
higher for urine specimens than for blood samples (6.36 versus 4.22 log10copies/ml). For the three qualitatively discordant
re-sults, two samples negative by the R-gene test were positive by the GeneProof and RealStar PCRs (BKV loads of⬍3.0 log10copies/ml
with these two techniques). One sample positive by RealStar PCR (BKV load of 2.7 log10copies/ml) was negative by the R-gene and
[image:2.585.40.287.77.214.2]GeneProof PCRs. The viral genotypes were determined for pa-tients with positive BKV PCR results: 39 papa-tients harbored geno-type I (for subgeno-type Ia,n ⫽2; for subtype Ib1,n⫽15; and for subtype Ib2,n⫽22), 11 harbored genotype IV, and 1 harbored
TABLE 1Characteristics of renal transplant recipients
Parameter Value
Age (yr) (median⫾SD) 52⫾14
Gender (no. of males/no. of females) 40/16
BKV load (mean log10copies/ml⫾SD)
Urine 6.36⫾2.01
Plasma 4.22⫾0.87
No. of patients with BKV genotype
I 39
II 1
III 0
IV 11
on May 16, 2020 by guest
http://jcm.asm.org/
genotype II. The three qualitatively discordant results between BKV quantitative assays concerned genotype Ib1 in blood sam-ples.
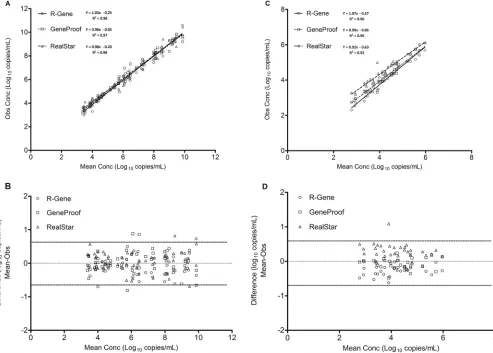
Comparison of the three BKV quantitation methods for use on clinical samples.Quantitative results for the 83 samples that were positive by the three assays were compared. Analysis of BKV loads obtained by the three assays showed a linear BKV correlation between the log10BKV loads for urine and plasma samples (Fig.
[image:3.585.39.550.78.202.2]1AandC). The Spearman correlation coefficients ranged from 0.97 to 0.98 (P⬍0.0001) for urine specimens (Fig. 1A) and from 0.92 to 0.96 (P⬍0.0001) for plasma specimens (Fig. 1C). How-ever, a more heterogeneous distribution of the results was ob-served for plasma samples, depending on the technology used (Fig. 1C). Values obtained with the RealStar technique were fre-quently higher than the observed mean, and those obtained with the R-gene technique were frequently lower than the observed
TABLE 2Main characteristics of BKV DNA quantification assays
Parameter
Value or description
R-gene GeneProof RealStar
Target t-Ag VP1/VP2 T-Ag and t-Ag
Fluorescence label on probe FAM FAM FAM
No. of PCR cycle steps (cycle steps) 2 (95°C, 60°C) 3 (95°C, 60°C, 72°C) 2 (95°C, 58°C)
Final vol (l) of assay mixture 25 40 30
Volume (l) of extracted DNA 10 10 10
No. of quantification standards 4 4 4
Range of standard curve (copies/ml) 1,250–1,250,000 2,500–2,500,000 2,500–2,500,000
Quantification range (log copies/ml) 2.14–11.0 2.17–7.0 2.25–9.0
Simultaneous amplification of internal control Yes Yes Yes
FIG 1Comparison of positive BKV loads in urine samples (A and B) and plasma samples (C and D) by the R-gene, RealStar, and GeneProof assay techniques. (A and C) Correlations between BKV loads obtained with the three assays. (B and D) Bland-Altman analysis of the mean viral load (log10copies per milliliter)
compared to the observed values for each assay. The solid lines represent the mean differences, and the dashed lines represent the means⫾1.96 SD.
on May 16, 2020 by guest
http://jcm.asm.org/
[image:3.585.46.539.340.693.2]mean. These differences between the three techniques were not observed for urine samples (Fig. 1A). Results from each commer-cial assay were then compared by plotting differences against the mean values obtained according to the Bland-Altman method for urine (Fig. 1B) and plasma (Fig. 1D) samples. Bland-Altman anal-ysis of the 83 samples positive by the three tests showed that more than 95% (240/249 comparisons) of sample comparisons relative to the mean were situated in the range of the mean⫾2 SD (Fig. 1B andD). Comparison of the results revealed eight values (with six values corresponding to genotype Ib2 samples) situated outside the range of the mean⫾2 SD for urine samples and one value (also corresponding to genotype Ib2) situated outside the range of the mean⫾2 SD for plasma samples. For the eight differences outside the range of the mean⫾2 SD, four were found with the GeneProof assay (4/83 samples [4.8%]), two with the RealStar assay (2/83 samples [2.4%]), and two with the R-gene technique (2/83 samples [2.4%]). The Bland-Altman plots did not indicate any significant differences between the three assays for urine and plasma specimens (Fig. 1BandD). The mean differences between BKV loads (log10copies per milliliter) obtained by the three
meth-ods, irrespective of sample type, were⫺0.08⫾0.46 for the R-gene and GeneProof tests,⫺0.27⫾0.48 for the R-gene and RealStar tests, and⫺0.19⫾0.51 for the GeneProof and RealStar tests ( Ta-ble 3). As indicated inFig. 1, differences between methods were more pronounced for plasma samples, as the only significant dif-ference (P⬍0.05) observed between these groups and subgroups concerned plasma samples assayed by the R-gene and GeneProof tests. Analysis of the results according to genotype did not reveal any significant differences between the three tests for genotypes I and IV (Table 3). More detailed results of the differences between two techniques for the 83 positive samples, according to genotypes and subtypes, revealed differences of⬎0.5 log10for 76 of the 249
comparisons (30.5%) and of⬎1 log10for 14 comparisons (5.6%).
No difference of⬎0.5 log was observed for genotype Ia sample comparisons (0/6 comparisons [0%]), and differences of⬎0.5 log were observed for 16 genotype Ib1 sample comparisons (16/51 comparisons [31.4%]), 40 genotype Ib2 sample comparisons (40/
117 comparisons [34.2%]), 1 genotype II sample comparison (1/9 comparisons [11.1%]), and 19 genotype IV sample comparisons (19/66 comparisons [28.7%]). Twelve of the 14 differences of⬎1 log concerned genotype Ib2 sample comparisons.
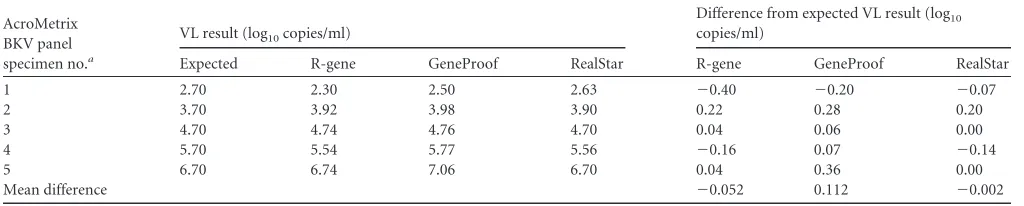
Results for the AcroMetrix BKV panel.Table 4depicts the BKV load results for the 5 samples of the AcroMetrix BKV panel tested with the three assays. The results of the three assays were highly concordant, with mean differences from the expected VL of ⫺0.002 log10copies/ml for the RealStar assay,⫺0.052 log10
cop-ies/ml for the R-gene assay, and 0.112 log10copies/ml for the
Ge-neProof assay. As observed with qualitative evaluation, for low viral loads, the R-gene technique underestimates the VL (⫺0.4 log10copies/ml between the R-gene value and the expected value),
which may lead to negative results for patients with very low VL (⬍3 log10copies/ml). For each point, all differences remained at
⬍0.5 log10copies/ml. A perfect correlation was obtained for
com-parison of the assays of the AcroMetrix BKV panel (r⫽0.991 for R-gene PCR,r⫽0.996 for GeneProof PCR, andr⫽0.997 for RealStar PCR;P⬍0.001 for all).
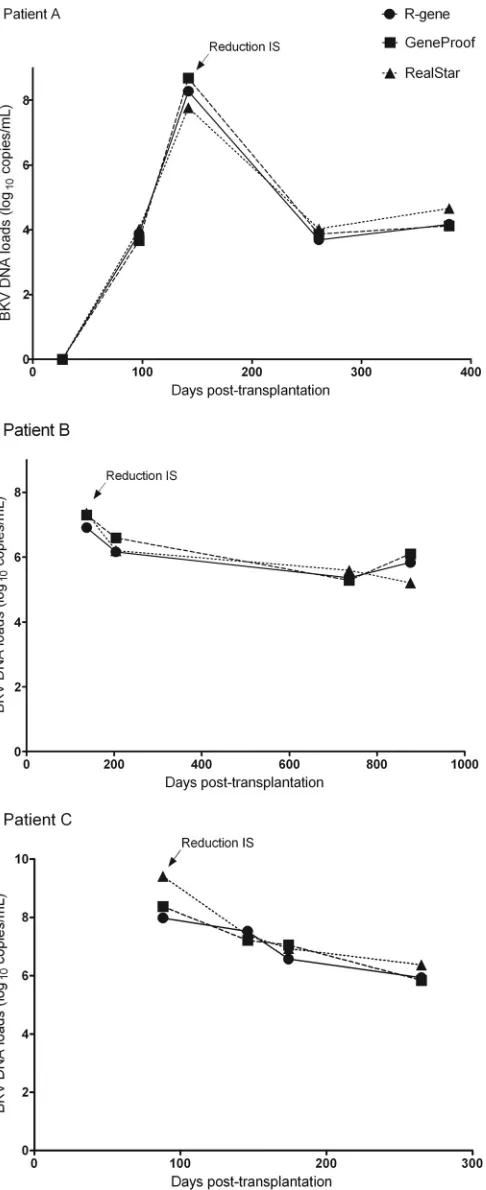
Follow-up of BKV loads in renal transplant recipients.We conducted a longitudinal study to investigate the performances of the three commercial assays for the follow-up assessment of RTR (Fig. 2). Two patients infected by BKV genotype I and one patient infected by BKV genotype IV were selected. Immunosuppressive therapy was decreased in these three patients during the first 6 months posttransplantation in order to reduce viral replication. As expected, the three assays demonstrated identical time courses of BKV VL during follow-up. All VL fluctuations in these patients were detected by these three techniques. Altogether, these data suggest that these BKV quantification assays are equally suitable for BKV monitoring.
DISCUSSION
[image:4.585.42.547.78.142.2]Molecular biology may allow early detection of BKV, allowing clinicians to rapidly modify a patient’s immunosuppressive ther-apy, potentially avoiding the onset of nephropathy (15). The pri-mary objective of this study was to evaluate the performances of
TABLE 3Differences between BKV DNA loads measured by the three methods according to sample type and viral genotype
Method comparison
Mean (SD) difference between BKV DNA loads (log10copies/ml)
All samples Plasma samples Urinary samples Genotype I Genotype IV
R-gene vs GeneProof ⫺0.08 (0.46) ⫺0.17 (0.25) ⫺0.03 (0.54) ⫺0.05 (0.46) ⫺0.12 (0.44) R-gene vs RealStar ⫺0.27 (0.48) ⫺0.55 (0.36)a ⫺0.12 (0.47) ⫺0.25 (0.53) ⫺0.33 (0.38) GeneProof vs RealStar ⫺0.19 (0.51) ⫺0.38 (0.34) ⫺0.09 (0.56) ⫺0.20 (0.52) ⫺0.22 (0.49)
[image:4.585.39.551.613.716.2]aP⬍0.05.
TABLE 4Quantification of BKV DNA loads of AcroMetrix BKV panel specimens
AcroMetrix BKV panel specimen no.a
VL result (log10copies/ml)
Difference from expected VL result (log10
copies/ml)
Expected R-gene GeneProof RealStar R-gene GeneProof RealStar
1 2.70 2.30 2.50 2.63 ⫺0.40 ⫺0.20 ⫺0.07
2 3.70 3.92 3.98 3.90 0.22 0.28 0.20
3 4.70 4.74 4.76 4.70 0.04 0.06 0.00
4 5.70 5.54 5.77 5.56 ⫺0.16 0.07 ⫺0.14
5 6.70 6.74 7.06 6.70 0.04 0.36 0.00
Mean difference ⫺0.052 0.112 ⫺0.002
aThree samples of each specimen were tested.
on May 16, 2020 by guest
http://jcm.asm.org/
three different real-time PCR assays that use different gene targets for detection and quantification of BKV loads. The three PCR methods (R-gene, GeneProof, and RealStar) were compared on the same amplification platform (ABI Prism 7500 SDS) after independent extraction on a NucliSENS easyMAG system. The main advantages of commercial kits are that they provide stan-dards and reagents produced according to good manufacturing practice. Commercial kits also present a number of other advan-tages: they are ready to use and very robust, with high repeatability and reproducibility, are easy to perform for nonspecialized labo-ratories, and can theoretically provide comparable results between different laboratories (16). The three kits used in this study are based on 5=nuclease TaqMan technology and contain a specific amplification premix, four quantification standards (QS), and an inhibition control. The R-gene test comprises two additional con-trols: a sensitivity control and a negative control.
Most in-house quantitative PCR tests for BKV developed sev-eral years ago used the Dunlop strain (genotype I) as a reference sequence for the selection of primers and probes (13). Real-time PCR determination of VL is based on the primer amplification efficiency, the efficiency of hybridization of the primers and probes for the enzymatic cleavage, and finally the amplification efficiency relative to the target in the reference material. Since BKV shares 75% sequence homology with JC virus, the locations of the primers and real-time PCR probes in the well-conserved genomic regions are extremely important. By cloning and se-quencing the amplicons obtained for these three tests, we deter-mined the target areas for defining different primers in the BKV genome (Table 2). Specifically, the R-gene test targets a 158-bp region in the T-Ag gene, while the GeneProof test targets 123 bp in the overlap region of the genes for the VP1 and VP2 proteins. The RealStar test targets two regions, an 82-bp region in the T-Ag gene and an 83-bp region in the t-Ag gene. The t-Ag gene is described as displaying the least variability compared to the genes encoding the VP1 capsid protein and the large T antigen (17). Thus, despite the different strategies for positioning of the primers, the results of these tests from three different manufacturers are very satisfac-tory. Overall, for the 86 positive clinical specimens, the correlation between the various PCR assays was good (r⬎0.94;P⬍0.0001). In this study, the best correlation was observed for the R-gene and GeneProof PCRs, although these two assays target distinct genes (T-Ag versus VP1/VP2).
In addition, the results of BKV quantification were not influ-enced by the various BKV genotypes or subtypes, with mean dif-ferences remaining lower than 0.5 log10 copies/ml. We mostly
evaluated patients with genotypes Ib1, Ib2, and IV, the most prev-alent genotypes in our center and in Europe. It has been demon-strated clearly that some BKV quantification assays present de-creased sensitivity for detection of less common subtypes of BKV, including genotypes II and Ic (12,13). It may therefore be useful to conduct further investigations with these rarer genotypes. The three assays were compared by using urine and plasma samples. At this time, BKV genome quantitation is preferentially performed on plasma. Whole-blood and plasma samples were previously compared and showed a perfect correlation in terms of VL (18). In our study, a more marked difference in terms of VL was observed between these tests on plasma samples. This more marked vari-ability may be due to the significantly lower VL in blood than in urine, such that a slight difference in absolute values in blood samples resulted in a greater impact on the results. Longitudinal
FIG 2Follow-up of three RTR by use of the three different BKV DNA quan-tification kits. BKV loads were measured and compared for longitudinal urine samples by using the R-gene, GeneProof, and RealStar quantification tests. Patient A had BKV genotype IV, and patients B and C had genotype I. IS, immunosuppressive drugs.
on May 16, 2020 by guest
http://jcm.asm.org/
[image:5.585.44.287.65.660.2]analysis of the patients (Fig. 2) did not reveal any major differ-ences in the same patient, regardless of the test used. This obser-vation is consistent with the reported stability of BKV sequences in renal transplant recipients over time (19). The agreement in terms of qualitative results between the three assays was very good (96.8%). The few discordant results (3/94 samples [3%]) con-cerned low BKV loads (⬍3.4 log10copies/ml) in plasma samples
and corresponded to episodes of transient viremia with negative results on subsequent tests (data not shown). These discordant results had no significant impact in terms of viral diagnosis or therapeutic management of the patients.
Expressing the results in international units according to a WHO international standard would provide a better uniformity of results. It is increasingly recognized that the availability of ap-propriate reference material is needed to ensure consistent quan-titative results for virological tests performed in different labora-tories. For example, guidelines from various scientific societies and the availability of international standards for HIV, hepatitis A virus, hepatitis B virus, hepatitis C virus, cytomegalovirus (CMV), and human parvovirus B19 have allowed more standardized prac-tices (20). A close correlation between different BKV quantifica-tion assays is therefore important for many reasons, including the possibility to switch from one test to another without the need to recalculate VL values each time.
In conclusion, this study demonstrates the good performances of three real-time PCR systems for BKV quantification in urine and plasma samples. All three real-time PCR assays are reliable for measuring BKV loads to allow identification of patients with viral replication.
ACKNOWLEDGMENT
We have no conflicts of interest to declare.
REFERENCES
1.Barri YM, Ahmad I, Ketel BL, Barone GW, Walker PD, Bonsib SM, Abul-Ezz SR.2001. Polyoma viral infection in renal transplantation: the role of immunosuppressive therapy. Clin Transplant15:240 –246.http: //dx.doi.org/10.1034/j.1399-0012.2001.150404.x.
2.Bonvoisin C, Weekers L, Xhignesse P, Grosch S, Milicevic M, Krzesinski JM.2008. Polyomavirus in renal transplantation: a hot problem. Transplan-tation85:S42–S48.http://dx.doi.org/10.1097/TP.0b013e318169c794. 3.Sharma PM, Gupta G, Vats A, Shapiro R, Randhawa P.2006.
Phyloge-netic analysis of polyomavirus BK sequences. J Virol80:8869 – 8879.http: //dx.doi.org/10.1128/JVI.00510-06.
4.Luo C, Bueno M, Kant J, Martinson J, Randhawa P.2009. Genotyping schemes for polyomavirus BK, using gene-specific phylogenetic trees and single nucleotide polymorphism analysis. J Virol83:2285–2297.http://dx .doi.org/10.1128/JVI.02180-08.
5.Zheng HY, Nishimoto Y, Chen Q, Hasegawa M, Zhong S, Ikegaya H, Ohno N, Sugimoto C, Takasaka T, Kitamura T, Yogo Y.2007. Rela-tionships between BK virus lineages and human populations. Microbes Infect9:204 –213.http://dx.doi.org/10.1016/j.micinf.2006.11.008. 6.Wang YT, von Zychlinski A, McCormick SP.2009.
Dimyristoylphos-photidylcholine induces conformational changes in apoB that lowers li-poprotein(a). J Lipid Res 50:846 – 853.http://dx.doi.org/10.1194/jlr .M800428-JLR200.
7.Hirsch HH, Babel N, Comoli P, Friman V, Ginevri F, Jardine A, Lautenschlager I, Legendre C, Midtvedt K, Munoz P, Randhawa P,
Rinaldo CH, Wieszek A.2014. European perspective on human polyo-mavirus infection, replication and disease in solid organ transplantation. Clin Microbiol Infect 20(Suppl 7):S74 –S88.http://dx.doi.org/10.1111 /1469-0691.12538.
8.Kasiske BL, Zeier MG, Chapman JR, Craig JC, Ekberg H, Garvey CA, Green MD, Jha V, Josephson MA, Kiberd BA, Kreis HA, McDonald RA, Newmann JM, Obrador GT, Vincenti FG, Cheung M, Earley A, Raman G, Abariga S, Wagner M, Balk EM. 2010. KDIGO clinical practice guideline for the care of kidney transplant recipients: a summary. Kidney Int77:299 –311.http://dx.doi.org/10.1038/ki.2009.377.
9.Hirsch HH, Brennan DC, Drachenberg CB, Ginevri F, Gordon J, Limaye AP, Mihatsch MJ, Nickeleit V, Ramos E, Randhawa P, Shapiro R, Steiger J, Suthanthiran M, Trofe J. 2005. Polyomavirus-associated nephropathy in renal transplantation: interdisciplinary analyses and rec-ommendations. Transplantation79:1277–1286.http://dx.doi.org/10.1097 /01.TP.0000156165.83160.09.
10. Krumbholz A, Bininda-Emonds OR, Wutzler P, Zell R.2009. Phyloge-netics, evolution, and medical importance of polyomaviruses. Infect Genet Evol9:784 –799.http://dx.doi.org/10.1016/j.meegid.2009.04.008. 11. Ikegaya H, Saukko PJ, Tertti R, Metsarinne KP, Carr MJ, Crowley B,
Sakurada K, Zheng HY, Kitamura T, Yogo Y.2006. Identification of a genomic subgroup of BK polyomavirus spread in European populations. J Gen Virol87:3201–3208.http://dx.doi.org/10.1099/vir.0.82266-0. 12. Hoffman NG, Cook L, Atienza EE, Limaye AP, Jerome KR. 2008.
Marked variability of BK virus load measurement using quantitative real-time PCR among commonly used assays. J Clin Microbiol46:2671–2680. http://dx.doi.org/10.1128/JCM.00258-08.
13. Randhawa P, Kant J, Shapiro R, Tan H, Basu A, Luo C.2011. Impact of genomic sequence variability on quantitative PCR assays for diagnosis of polyomavirus BK infection. J Clin Microbiol49:4072– 4076.http://dx.doi .org/10.1128/JCM.01230-11.
14. Bohl DL, Storch GA, Ryschkewitsch C, Gaudreault-Keener M, Schnit-zler MA, Major EO, Brennan DC.2005. Donor origin of BK virus in renal transplantation and role of HLA C7 in susceptibility to sustained BK viremia. Am J Transplant5:2213–2221.http://dx.doi.org/10.1111/j.1600 -6143.2005.01000.x.
15. Bechert CJ, Schnadig VJ, Payne DA, Dong J.2010. Monitoring of BK viral load in renal allograft recipients by real-time PCR assays. Am J Clin Pathol133:242–250.http://dx.doi.org/10.1309/AJCP63VDFCKCRUUL. 16. Ito Y, Takakura S, Ichiyama S, Ueda M, Ando Y, Matsuda K, Hidaka E,
Nakatani K, Nishioka J, Nobori T, Kajiyama N, Kimura H. 2010. Multicenter evaluation of prototype real-time PCR assays for Epstein-Barr virus and cytomegalovirus DNA in whole blood samples from transplant recipients. Microbiol Immunol54:516 –522.http://dx.doi.org/10.1111/j .1348-0421.2010.00243.x.
17. Randhawa PS, Khaleel-Ur-Rehman K, Swalsky PA, Vats A, Scantlebury V, Shapiro R, Finkelstein S.2002. DNA sequencing of viral capsid protein VP-1 region in patients with BK virus interstitial nephritis. Transplanta-tion73:1090 –1094.http://dx.doi.org/10.1097/00007890-200204150-00013. 18. Sueur C, Solis M, Meddeb M, Soulier E, Domingo-Calap P, Lepiller Q,
Freitag R, Bahram S, Caillard S, Barth H, Stoll-Keller F, Fafi-Kremer S.
2014. Toward standardization of BK virus monitoring: evaluation of the BK virus R-gene kit for quantification of BK viral load in urine, whole-blood, and plasma specimens. J Clin Microbiol52:4298 – 4304.http://dx .doi.org/10.1128/JCM.02031-14.
19. Takasaka T, Goya N, Ishida H, Tanabe K, Toma H, Fujioka T, Omori S, Zheng HY, Chen Q, Nukuzuma S, Kitamura T, Yogo Y. 2006. Stability of the BK polyomavirus genome in renal-transplant patients without nephropathy. J Gen Virol87:303–306.http://dx.doi.org/10.1099 /vir.0.81368-0.
20. Madej RM, Davis J, Holden MJ, Kwang S, Labourier E, Schneider GJ.
2010. International standards and reference materials for quantitative mo-lecular infectious disease testing. J Mol Diagn12:133–143.http://dx.doi .org/10.2353/jmoldx.2010.090067.