A Framework for Uncertainty-Aware Visual
Analytics in Big Data
Amin Karami1,2
1 Computer Architecture Department (DAC), Universitat Polit`ecnica de Catalunya
(UPC), Campus Nord, C. Jordi Girona 1-3, 08034 Barcelona, Spain
Abstract. Visual analytics has become an important tool for gaining insight on big data. Numerous statistical tools have been integrated with visualization to help analysts understand big data better and faster. How-ever, data is inherently uncertain, due to sampling error, noise, latency, approximate measurement or unreliable sources. It is very important and vital to quantify and visualize uncertainties for analysts to improve the results of decision making process and gain valuable insights during analytic process on big data. In this paper, we propose a new frame-work to support uncertainty in the visual analytics process through a fuzzy self-organizing map algorithm running in MapReduce framework for parallel computations on massive amounts of data. This framework uses an interactive data mining module, uncertainty modeling and knowl-edge representation that supports insertion of the user’s experience and knowledge for uncertainty modeling and visualization in the big data.
1
Introduction
minimize misleading results and interpretations [7]. A challenging and key ques-tion is how users can effectively and efficiently understand the uncertain data in the big data sets and interact with them through the user interface. Inter-action and user interface challenges are critical aspects of extreme-scale visual analysis to understand and cope with uncertainties. Adapting and applying vi-sual analytics to the big data problems presents new challenges and opens new research questions [18]. Visual analytics is a relatively new field of study that aims at bridging this gap by integrating visualization and analytics in order to turn the information overhead into an opportunity [12]. Contributions in this area integrate information visualization, interaction and computational analysis by data mining techniques in order to transform massive data into knowledge. There have been several researches about visual analytics in the big data such as [18][3][13]. The disadvantages of the existing works are their inability to quantify and visualize uncertainty accurately.
The main contribution of this paper is a novel prototype system embracing un-certainty in the big data through the visual analytics. This system can provide valuable guidance through a close interaction between human operators, pre-processing data, refining model’s parameters, building model, visualizing and understanding uncertainty in the data through the visual interface where op-erators are able to interact and provide desired inputs and configurations. For uncertainty modeling in the big data, we extend our previous work in [8] -a mechanism for mining and visualizing uncertainty in a centralized-batch data processing- through the MapReduce framework. MapReduce [5] is a program-ming model for executing distributed computations on massive amounts of data in order to model a decentralized-batch data processing. This system leads to an appropriate uncertainty-aware visualization in a massive amounts of data to help both experienced and novice users understand hidden knowledge through mini-mizing misleading interpretations. In section 2 we present background material related to uncertainty modeling, visual analytics and MapReduce framework. Section 3 presents our designed prototype for uncertainty visualization in the big data. Section 4 discusses proposed interface design suitability from a visual analytics perspective. Finally, section 5 concludes this paper and outlines future work.
2
Background
2.1 Uncertainty modeling
where objects belong to sets (clusters) with certain degree of membership rang-ing [0..1]. In this paper, we use fuzzy sets theory as a mean to measure and quantify uncertainty.
2.2 Visual analytics process model
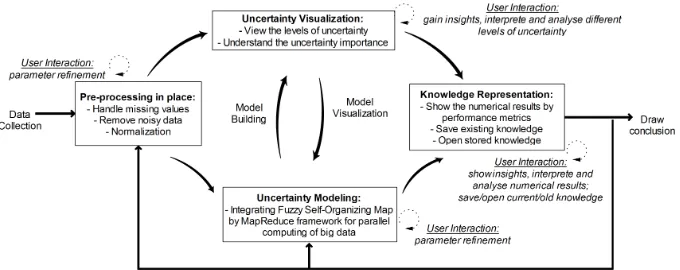
[image:3.612.198.422.423.553.2]Visual analytics is defined as analytical reasoning supported by highly interac-tive visual interfaces that involves information gathering, data pre-processing, knowledge representation, interaction and decision making. A process model of visual analytics by Keim et al. [11] is illustrated in Fig. 1. According to Fig. 1, the first step is pre-processing such as data cleaning and data transformation over input data to be able to use it in the desired format for further inves-tigations. After the pre-processing step, visualization methods and automated analysis methods are applied to the data. Afterward, automated analysis meth-ods using data mining methmeth-ods are applied to generate models. These models can be evaluated and refined by the user through a modification of initial pa-rameters or selecting other type of analysis algorithms. User interaction with the visualization is needed to reveal information by applying different visualization techniques on the data such as descriptive analysis, graphical representations etc. Based on this interaction, the user can conduct the model building and refine-ment in the automatic analysis. Furthermore, knowledge can be gained during mentioned different types of user interaction. Finally, the feedback loop stores this knowledge of insightful analyses in the system and enables the analyst to draw faster and better conclusions in the future.
Fig. 1: The visual analytics process model (adapted from [11])
2.3 MapReduce framework for big data processing
low-end computing nodes [14]. It is a scalable, fault-tolerant, and ubiquitous data processing tool gaining significant attention from both industry and academia. The main idea of the MapReduce is to hide details of parallel execution and allow users to focus only on data processing strategies [6]. The MapReduce model is composed of two procedures: Map and Reduce, written by the user. The Map function computes a set of intermediate key/value pairs (i.e. a list of (key, value)) from the input. The intermediate key/value pairs are then grouped together on the key-equality basis as (key, list(value)). The Reducer function performs a summary operation on the list of all values based on each unique key. This allows us to handle lists of values that are too large to fit in memory. The reduce function finishes the computation started by the map function, and outputs the final answer.
[image:4.612.139.479.344.479.2]3
Proposed method: A Framework for Uncertainty-Aware
Visual Analytics in Big Data
Fig. 2: The proposed model for visual analytics
graph-ical representation to support uncertainty visualization as well as a descriptive analysis for knowledge representation to draw conclusion.
3.1 Uncertainty modeling
Our proposed uncertainty modeling is derived from our previous work in [8], called Fuzzy Self-Organizing Map (FSOM). In [8], we proposed a fuzzy self-organizing map algorithm using fuzzy c-mean (FCM) to model uncertainties based on a centralized-batch processing framework. FSOM works in three phases. In the first phase (we called it fuzzy competition), FCM technique has been employed to assign a membership degree in clusters’ centers in terms of the input data. Then in the second phase (we called itfuzzy cooperation), all the clusters’ centers cooperate by a Gaussian function with their neighbors in terms of the membership degree. Finally at the third phase (we called it fuzzy adaption), all the centers’ positions are updated. These three phases are repeated, until the maximum number of iterations is reached or the changes become smaller than a predefined threshold.
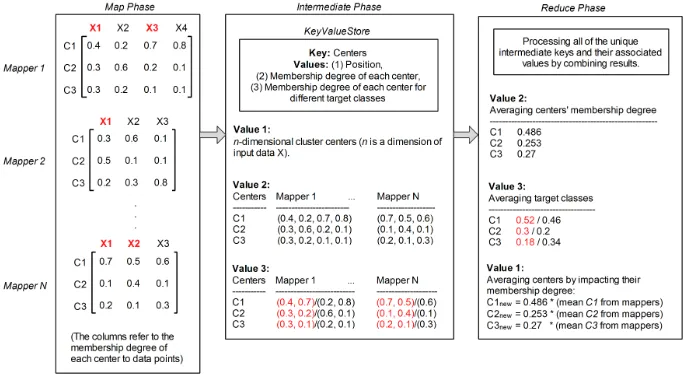
[image:5.612.136.478.420.607.2]First, in this section we present the main design for parallel FSOM based on MapReduce framework for a decentralized-batch processing which is depicted in Fig. 3. Then we explain how the necessary computations can be formalized as map and reduce operations in detail.
Fig. 3: The schematic of the MapReduce framework.C1, C2, C3 refer to cluster centers,
According to Fig. 3, The map phase applies FSOM algorithm from [8] per-forming the procedure of defining the membership degree of cluster centers from corresponding uncertain data points while the reducer phase performs the pro-cedure of updating the new centers.
Map Function:The input data set is stored in Hadoop Distributed File System (HDFS) [2]. Data in HDFS is broken down into smaller pieces (called chunks) and distributed throughout the cluster. In this way, the map and reduce func-tions can be executed on smaller subsets of larger data sets, and this provides the scalability that is needed for the big data processing. MapReduce reads a single chunk of data on the input datastore, then call the map function to work on the chunk. The map function then works on the individual chunk of data and adds one or more key-value pairs to the intermediate KeyValueStore ob-ject. MapReduce repeats this process for each of the chunks of data, so that the total number of calls to the map function is equal to the number of chunks of data. Each mapper runs FSOM algorithm from [8]. The result of this phase is a KeyValueStore object that contains all of the key-value pairs added by the map function. The key is the cluster centers and the corresponding values are the position of centers in each mapper, the membership degree of each center, and the membership degree of each center for different target classes. After the map phase, MapReduce prepares for the reduce phase by grouping all the values in theKeyValueStore object by unique key in the intermediate phase.
Reduce Function: The reduce function scrolls through the values from the KeyValueStore to perform a summary calculation. We calculate the average of aggregated values to sum up the results (see Fig. 3).
The MapReduce framework is repeated until the clusters’ centers do not change any more in the predefined number of iteration (we set 500 iterations) or a max-imum purity has been reached. It is highly probable that the formed clusters containing normal data (correct classification) will have a number of abnormal data (incorrect classification) and vice versa. Therefore, we assigned a good-ness value in range of [0..1] for each cluster by purity metric. The purity metric determines the frequency of the most common category/class into each cluster:
P urity= 1
n
k
X
q=1
max
1≤j≤ln j
q (1)
Where,nis the total number of samples;lis the number of categories,nj q is the number of samples in clusterqthat belongs to the original classj(1≤j≤l). A large purity (close to 1) is desired for a good clustering. If the all data samples in a cluster have the same class, the purity value set to 1 as a pure cluster.
3.2 Case study
set was labeled as either normal or as exactly one specific kind of attack. Attack labels are classified as DOS (denial-of-service, e.g. syn flood), R2L (unauthorized access from a remote machine, e.g. guessing password), U2R (unauthorized ac-cess to local superuser (root) privileges, e.g., various buffer overflow attacks), and probing (surveillance and other probing, e.g., port scanning). These differ-ent attacks are considered as a single attack by same labeling in our study. This data set consists of 41 features and 494021 records. In the experiments, 75% of data set is used as training and the rest is considered as testing in order to validate the functionality of the proposed method. To add uncertainty in the considered data set, we add a Gaussian white noise with a zero mean and the standard deviation with the normal distribution [0,2∗f], where,f is an integer parameter from the set of{1, 2, 3}to define different uncertain levels for some features randomly.
[image:7.612.135.482.382.602.2]This example helps security data analysts to monitor computer network traffic for security purposes. The challenge for an analyst is the discrimination between real attacks and normal traffic, where the nature of the traffic data is uncertain. The proposed framework for uncertainty-aware visual analytics enables insight-ful analyses in the system and allows the analyst to understand uncertainty for drawing faster and more accurate conclusions.
3.3 Performance measurement
To evaluate the results by the proposed algorithm, we apply several criteria including detection rate (DR), false positive rate (FPR), F-measure, accuracy and specificity (true negative rate) which are frequently used measures in the classification problems [10].
4
Prototype system design for visualizing uncertain
clusters
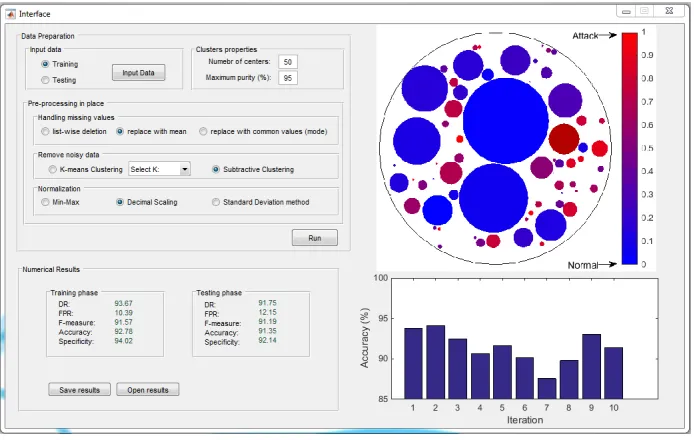
[image:8.612.224.394.427.577.2]The prototype design is depicted in Fig. 4 to provide an useful and effective uncertainty visualization of KDD-CUP’99 traffic data. This prototype was im-plemented by the MATLAB R2014b. The graphical user interface is designed to allow users for visual analytics through the embedded modules. The graph-ical interface has been divided into three main modules: data preparation (top left: input data, model properties and pre-processing), numerical results (bottom left: performance metrics for knowledge representation), and graphical represen-tation (right: uncertainty visualization in the top and history of the training in the bottom). The operators can consistently train and test the data, then save the results for further usage or open preexisting results. To visualize the uncertainty, we map the magnitude of the propagated uncertainty to the size (to visualize the volume of the clusters) and the color (to encode the purity of the clusters) of nodes in a 2D plot defined as the projection of the 41 variables from the uncertain input big data. This projection is shown in Fig. 5.
Fig. 5: Uncertainty visualization in the big data
attack clusters. The more uncertain a cluster is, the more impure is its visual representation. For instance, the purple color denotes a 100% uncertainty in a formed cluster (purity = 0.5), neither completely normal nor attack traffic. This is useful for discovering the sources of uncertainty. This visualizes the effect of uncertainty and steers the user’s attention towards the most reliable clusters over uncertain data points so that only the most reliable clusters are highlighted to the user. On the other hand, a large size of a node denotes the more uncertain data involved while a small size of a node denotes the less uncertain data in-volved which can be interpreted as outliers. As a consequence, these small nodes steer the user’s attention visually towards the most unreliable nodes as outliers. This prototype design displays a high-level view of entire uncertain big data together with the numerical results. Preliminary results show that the designed prototype produces satisfactory outcomes. Users can steer and control uncer-tainty based on their own practices or analytic needs in the data preparing step, find outliers visually as well as distinguish visually reliable and unreliable clus-ters. User evaluations by zooming into sub-regions of clusters and reveal more details (i.e., details on demand) will be carried out in the future.
5
Conclusion
In this paper, we propose a framework for uncertainty-aware visual analytics in the big data. We integrated a fuzzy self-organizing map algorithm with MapRe-duce framework in order to execute a parallel computing on big data.
The prototype system includes a set of interactive visual representations that supports the analysis of the uncertain data and user interaction. We believe that this prototype system is useful when the analyst wants to extract a model that explains the behavior of uncertain data, find outliers visually and makes insight-ful decisions. The future work is needed by more user evaluations: zooming into sub-regions of uncertain clusters and reveal more details.
6
Acknowledgment
This work was partially supported by projects TIN2013-47272-C2-2 and SGR-2014-881.
References
1. Bendler, J., Wagner, S., Brandt, T., Neumann, D.: Taming uncertainty in big data. Business & Information Systems Engineering 6(5), 279–288 (2014)
2. Borthakur, D.: The hadoop distributed file system: Architecture and design. Hadoop Project Website 11(2007), 21 (2007)
4. Correa, C.D., Chan, Y.H., Ma, K.L.: A framework for uncertainty-aware visual an-alytics. In: IEEE Symposium on Visual Analytics Science and Technology (VAST). pp. 51–58 (2009)
5. Dean, J., Ghemawat, S.: Mapreduce: Simplified data processing on large clusters. In: Proceedings of the 6th Symposium on Operating System Design and Imple-mentation (OSDI). pp. 137–150 (2004)
6. Grolinger, K., Hayes, M., Higashino, W.A., L’Heureux, A., Allison, D.S., Capretz, M.: Challenges for mapreduce in big data. In: IEEE World Congress on Services (SERVICES). pp. 182–189 (2014)
7. J¨ackle, D., Senaratne, H., Buchm¨uller, J., Keim, D.A.: Integrated spatial uncer-tainty visualization using off-screen aggregation (2015)
8. Karami, A., Guerrero-Zapata, M.: Mining and visualizing uncertain data objects and network traffics by fuzzy self-organizing map. In: Proceedings of the AIC workshop on Artificial Intelligence and Cognition. pp. 156–163 (2014)
9. Karami, A., Guerrero-Zapata, M.: An anfis-based cache replacement method for mitigating cache pollution attacks in named data networking. Computer Networks 80, 51–65 (2015)
10. Karami, A., Guerrero-Zapata, M.: A fuzzy anomaly detection system based on hybrid pso-kmeans algorithm in content-centric networks. Neurocomputing 149, Part C, 1253–1269 (2015)
11. Keim, D.A., Bak, P., Bertini, E., Oelke, D., Spretke, D., Ziegler, H.: Advanced visual analytics interfaces. In: Proceedings of the International Conference on Ad-vanced Visual Interfaces. pp. 3–10 (2010)
12. Keim, D.A., Mansmann, F., Schneidewind, J., Thomas, J., Ziegler, H.: Visual an-alytics: Scope and challenges. Springer Berlin Heidelberg (2008)
13. LaValle, S., Lesser, E., Shockley, R., Hopkins, M.S., Kruschwitz, N.: Big data, analytics and the path from insights to value. MIT sloan management review 21 (2013)
14. Lee, K.H., Lee, Y.J., Choi, H., Chung, Y.D., Moon, B.: Parallel data processing with mapreduce: a survey. In: AcM sIGMoD Record 40. pp. 11–20 (2012) 15. Qian, H.: Pivotalr: A package for machine learning on big data. R Foundation for
Statistical Computing 6(1), 57–67 (2014)
16. Riveiro, M.: Evaluation of uncertainty visualization techniques for information fu-sion. In: 10th International Conference on Information Fufu-sion. pp. 1–8 (2007) 17. Zadeh, A.L.: Fuzzy sets. Information Control 8, 338–353 (1965)
![Fig. 1: The visual analytics process model (adapted from [11])](https://thumb-us.123doks.com/thumbv2/123dok_us/429227.1042564/3.612.198.422.423.553/fig-visual-analytics-process-model-adapted.webp)