scroll down to view the document itself. Please refer to the repository record for this item and our policy information available from the repository home page for further information.
To see the final version of this paper please visit the publisher’s website. Access to the published version may require a subscription.
Author(s): Zainorabidin, Adnan; Wijeyesekera, D.Chitral
Article title: Shear Modulus and Damping Properties of Peat Soils Year of publication: 2009
Citation: Zainorabidin, A; Wijeyesekera, D.C. (2009) ‘Shear Modulus and Damping Properties of Peat Soils’Proceedings of the AC&T, pp 61 -67.
Link to published version:
SHEAR MODULUS AND DAMPING PROPERTIES OF PEAT
SOILS
Adnan Zainorabidin
1and D.C Wijeyesekera
2School of Computing, Information Technology & Engineering, University of East London
email: 1 adnan@uel.ac.uk, 2 D.C Wijeyesekera @uel.ac.uk
Abstract:Soils are subjected to dynamic loading of various forms. Some of these result from sources
such as earthquakes, traffic loads and tidal action. To assess the level of the consequent ground motion of the soil, two parameters those are vital in dynamic analysis; shear modulus (G) and damping ratio (D) properties (Adnan et. al, 2007, Adnan and Wijeyesekera, 2008). Dynamic properties of soils such as sand, silt and clay have been studied for more time in the past (Chen et al., 2007, Hyde and Ward, 1985). However only a insignificant amount of work has been done on the dynamic properties of peat. This paper presents experimental results based on the undrained cyclic tests on different peats. Samples were collected from Holme Fen Post, Cambridgeshire and Solway Post, Carlisle. VJTech Cyclic Triaxial Testing Apparatus was used to measure these parameters. The significance of peat type, microstructure, loading frequency, confining pressure and index properties are also discussed.
1. Introduction:
The response of geomaterials to dynamic loading has been of interest to geotechnical engineers and geophysicists for many years. These depend on the dynamic characteristics of the load that are a consequence of sources such as earthquakes, construction operations, traffic and wheel loads, wind, machinery, or the tidal action of water. Majority of previous research has paid attention primarily to the dynamic response of the inorganic soils such as clay, sand and clayey soils. Previous research on cyclic properties of peat is limited to only a few investigations (Stokoe et al., 1994; Kramer, 1996; Boulanger et al. 1998; Kramer, 2000 and Wehling et al., 2001). The repeated or cyclic nature of the loading arises from the dynamics of the slipping elements of crust and the surrounding rock at soil deposits; a single blow to any flexible system causes a series of waves in the material. Normally the loading pattern is highly complex and
unpredictable. This is vital in the understanding of the prime factors that will control structural damage due to the dynamic loadings.
Design of structure that involve dynamic loading of the soil foundation requires the determination of the shear modulus and the damping ratio of the foundation soils. Zhou (2005) stated that adequate information on dynamic soil properties, especially dynamic shear modulus (G) and damping ratio (D), is essential for accurate prediction of ground response and soil interaction problems. Evaluating the seismic behaviour of peat requires addressing the potential for significant strains or strength loss that can contribute to ground deformations or instability during or following the occurrence of cyclic loading. In peat layers, low frequencies (with higher energy capacities) can be transmitted due to low wave velocities.
extreme points on a hysteresis loop at a given shear strain. As the strain level increases, the shear modulus decreases.
Figure 1: The nature of a hysteresis loop obtained from a cyclic triaxial test.
When cyclic triaxial tests are performed, a similar hysteresis loop will be formed by plotting deviator stress, sd, versus axial
strain, e. Figure 1 shows the relationship
between deviator stress and axial strain to determine the G and D parameters. The graph also can be plotted with axial load versus axial deformation. The slope of the secant line connecting the extreme points on the hysteresis loop is the elastic modulus, E where;
E = sd,/e (1)
g = (1 + m) (2)
G = E / 2 (1 + m) (3)
Where m is passion ratio and may be estimated as 0.5 for saturated, undrained specimens. The damping ratio, D, is a measure of dissipated energy, DW, versus elastic energy, We and may be computed as;
D = DW / We (4)
= AL / (4pAT) * 100 (5)
DW is proportional to the entire area enclosed inside the hysteresis loop, and We
is proportional to 4p times the triangular area below the loop.
2. Characteristics of Tested Peat:
The term PEAT actually represents an accumulation of disintegrated and composition of plant remains, which have been preserved under condition of incomplete aeration and high water content. It is formed when organic (usually plants) matter accumulates more quickly than it humifies below high water table as in swamps or wetlands (Bujang, 2004).
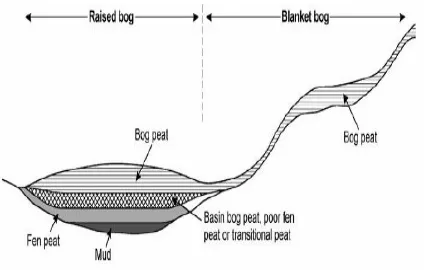
In terms of geotechnical engineering, peat is commonly recognised as a material with high compressibility and low bearing capacity and therefore being unsuitable as foundation materials for any, construction works (Adnan et al., 2007). Peat deposits found in temperate regions such as in Britain are bog and fen peat. Figure 2 shows the layers for different deposit of peat in Britain. The composition of these peats consists normally of remains from the grasses, sedges and bog mosses. The morphological differences between fen and bog peats are attributed to the types of plant remains that occur in the peat and their mode of origin.
[image:3.595.310.522.552.687.2]The main differences in characteristics between bog and fen peat are; bog receives water solely from rain and/or snow falling on its surface meanwhile fen receives water and nutrients from the soil, rock and groundwater as well as rain and/or snow. In this research, the peat samples were obtained from two different sites viz; Holme Fen Post, Cambridgeshire and Solway Post, Carlisle. In Holme Post site, two different depths of sampling were chosen; 1.5m and 2.0m. Meanwhile for Solway Post samples only 1.0m depth was collected. Macrostructure tests in laboratory showed that samples from Holme Post are categorized as bog peat for sample 1.5m depth and fen peat for 2.0m depth. Meanwhile, sample from Solway Post is categorized as bog peat.
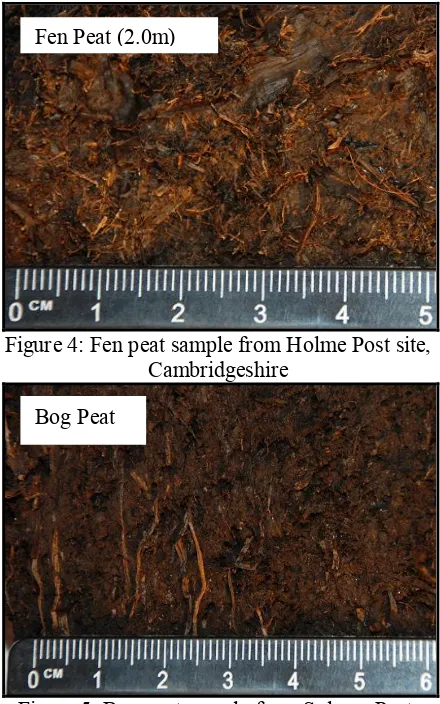
[image:4.595.306.526.107.459.2]Figures 3, 4 and 5 show the photograph of three types of peat. The photos were captured in laboratory using the highresolution digital camera. Observation shows the fibres size for each type of samples were very different. Bog peat from Holme Post shows a structure and size of fibres that are more homogeneous compared to the others sample.
Figure 3: Bog peat sample from Holme Post site, Cambridgeshire
Figure 4: Fen peat sample from Holme Post site, Cambridgeshire
[image:4.595.74.293.486.659.2]Figure 5: Bog peat sample from Solway Post, Carlisle
Figure 6: SEM photo for Bog peat (Holme Post site)
Fen Peat (2.0m)
Bog Peat
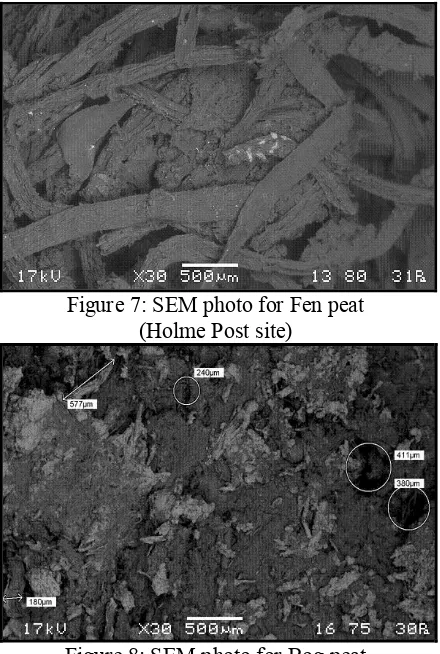
[image:4.595.306.527.490.646.2]Figure 7: SEM photo for Fen peat (Holme Post site)
Figure 8: SEM photo for Bog peat (Solway Post site)
To verify the clearly fibres structure in each type of peat, Scanning Electron Microscopy (SEM) was used. Figures 6, 7 and 8 shows the SEM photo and the differences of the samples. Observation shows that the fibres for bog peat is denser compare to the fen peat.
Table 1 show the comparison physical properties for samples tested.
Samples Designated/ Parameters
Bog Peat (Holme
Post) (RbP)
Fen Peat (Holme Post)
(FP)
Bog Peat (Solway Post) (BP) Water
Content (%) 300500 500700 500750
Organic Content (%)
91 96 92
Liquid Limit (%)
350 600 650
Specific Gravity
1.25 1.17 1.21
Unit Weight (kN/m 3 )
8.511.0 9.510.5 7.510.2
Review of literature indicates that peat soil is very variable in its properties, both from one deposit to another and from point to point in the same deposit (Zainorabidin and Wijeyesekera, 2008). The moisture content for bog peat from Holme Post ranged between 300% to 500%. However, the moisture content from Fen Peat (Holme Post) and Bog Peat (Solway Post) were slightly higher and in the range 500750. Compared with the moisture content for Malaysian peat (200500%), investigated by other researchers (Zainorabidin and Ismail, 2003; AlRaziqi et al., 2003), these results are slightly higher. Hobbs (1980), explained these differences depend on the type of plant detritus, the degree of humidification and ground water table effect. Further reasons are the influence of different agricultural history of the area and rainfall intensity. As for organic content, all samples have values that are similar and more than 90%. Accordingly, the liquid limit for the both Bog peats from Holme Post and Solway Post, are much less than that reported by Hobbs (1986), with 8001500% values for bog peat. However, the fen peat results contradict that reported by Hobbs (1986), ranged between 200600%. Edil (2003) and Hobbs (1986) reported that the specific gravity for peats were varies in the range of 1.1 to 1.9. The specific gravity values are within an anticipated range.
3. Testing Methodology:
stresses were chosen based on the depth for effective consolidation stress.
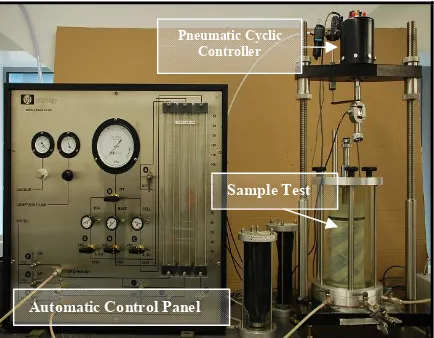
[image:6.595.306.556.154.298.2]All the samples in cyclic tests were subjected to oneway cyclic loading with peak stresses exceeding or remaining half of the monotonic strength. VJ Tech Cyclic Triaxial Machine was used for this research (Refer Figure 9). This testing machine was control with the automatic valve and used CATTS Software programmed. The cyclic controller was high operated based on air pressure supply by centralized high air compressor. Sinusoidal cyclic axial loads was chosen to apply for three different frequencies; 0.5Hz, 1.0Hz and 2Hz.
Figure 9: VJTech Cyclic Triaxial Machine
The purpose of choosing these different frequencies was to simulate the different dynamic response. All the tests were stopped when the cycles reach to 500 cycles.
4. Test Results:
Figures 10 and 11 illustrate the typical results from the cyclic tests.
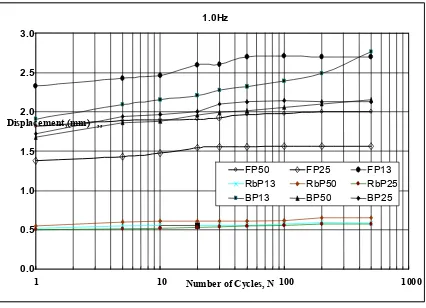
Figures 12, 13 and 14 illustrate a comparison of displacement response observed during all the tests. It is seen that at 1.0 Hz the displacement response is uniformly increased for all samples. The
[image:6.595.74.291.328.497.2]displacement increased maximum until it reached 40 cycles.
[image:6.595.308.554.331.482.2]Figure 10: Axial deformation response to cyclic deviator stress application on peat sample
Figure 11: Pore water response to cyclic deviator stress application on peat sample.
Figure 12: Displacement response to number of cycles on peat sample for 0.5Hz. 0.5Hz 0.0 0.5 1.0 1.5 2.0 2.5 3.0 3.5 4.0
1 10 100 1000
Number of Cycles, N Displacement,(mm) ,,
FP13 FP25 FP50 RbP13 RbP25 RbP50 BP13 BP25 BP50 0 2 4 6 8 10 12 14 16 18 20 22
0 5 10 15 20 25 30 35 40
Time (sec) Deviator Stress (kPa) 175 176 177 178 179 180 181 182 183 184 185 Pore Pressure (kPa) Deviator Stress Pore Pressure 0 2 4 6 8 10 12 14 16 18 20 22
0 5 10 15 20 25 30 35 40
[image:6.595.307.523.532.693.2]Figures 15 and 16 show he results for the dynamic shear modulus and damping ratio. Kramer (2000), described the plastic inorganic soils to often exhibit rate dependency that manifested itself under dynamic loading conditions in the form of frequencydependent stiffness and damping.
Figure 13: Displacement response to number of cycles on peat sample for 1.0Hz.
He also stated soils exhibit a viscous component of resistance that caused the measured shear modulus and damping ratio to increase with increasing frequency.
The tests results indicate that the dynamic shear modulus increases with increasing frequencies meanwhile damping ratio decreased with increasing frequencies. This compared well with previous research by Boulanger (1998), where similar trends were reported. Nevertheless, the influence of changes in effective confining pressure makes these parameters slightly inconsistent with scatter of results.
[image:7.595.306.522.306.478.2]These results illustrate the complex nature of the behaviour of these materials, and point out the need to consider a wide range of frequencies to characterize the effects of rate dependence on their response.
[image:7.595.308.523.523.692.2]Figure 14: Displacement response to number of cycles on peat sample for 2.0Hz.
Figure 15: Observation dynamic shear modulus, (MPa) for different frequencies (Hz).
Figure 16: Observation damping ratio, (%) for different frequencies (Hz).
0 0.2 0.4 0.6 0.8 1 1.2 1.4 1.6 1.8
0 0.5 1 1.5 2 2.5
Frequencies, (Hz) Dynamic Shear Modulus, G (MPa) ,
FP13 FP25 FP50 RbP13 RbP25
RbP50 BP13 BP25 BP50
0 5 10 15 20 25
0 0.5 1 1.5 2 2.5
Frequencies, Hz Damping Ratio, (%) ,
FP13 FP25 FP50 RbP13 RbP25
RbP50 BP13 BP25 BP50
2.0Hz
0.0 0.5 1.0 1.5 2.0 2.5 3.0
1 10 Number of Cycles,N 100 1000
Displacement,(mm) ,,
FP50 FP25 FP13 RbP13 RbP50 RbP25 BP13 BP50 BP25
1.0Hz
0.0 0.5 1.0 1.5 2.0 2.5 3.0
1 10 Number of Cycles, N 100 1000
Displacement,(mm) ,,
7. Conclusion:
In this paper, some pertinent matters are presented and discussed and these are summarised as follows:
§ Different geographical locations in different climates will generate different characteristics.
§ Variation of Dynamic shear modulus and damping ratio for the peat with frequency are established
§ Research leading to a better understanding of the performance of peat especially in dynamic response is urgently desired for better geotechnical design.
8. References:
Adnan, Z. and Wijeyesekera, D.C. (2007) Geotechnical Challenges With Malaysian Peat. In Proceedings of The Advances Computing and Technology 2007 Conference, 23 January 2007, ed. Stephen et al., 252261. London, United Kingdom.
Adnan, Z, Wijeyesekera, D.C and Masirin, M.I.M. (2007) Comparative Study of Malaysian Peat and British Peat Pertaining to Geotechnical Properties. In Proceedings of Sri Lankan geotechnical Society’s First International Conference on Soil and rock Engineering, 511 August 2007, ed. Pinnaduwa H.S.W, Colombo, Sri Lanka.
Adnan, Z. and Wijeyesekera, D.C. (2008) Geotechnical Characteristics of Peat. In Proceedings of The Advances Computing and Technology 2008 Conference, 24 January 2008, ed. Stephen et al., London, United Kingdom.
Boulanger, R.W., Leslie F., R.A., Harder Jr.,Raphael A. Torress, Micheal W.Driller (January 1998). "Dynamic Properties of Sherman Island Peat." Journal of Geotechnical and Environmental Engineering 124(1): 1220.
Bujang, B.K. (2004) Organic and peat soils engineering. Universiti Putra Malaysia Press.
Edil, T. B. (2003) Recent advances in geotechnical characterization and construction over peats and organic soils, In Proceedings of 2 nd International Conference on Advances in Soft Soil Engineering and Technology 24 July 2003,ed. Huat et al, 3 25, Putra Jaya, Malaysia.
Hobbs, N.B. (1986) Mire morphology and the properties and behaviour of some British and foreign peats, Quart. J. of Eng. Geol., (19), 780.
Wehling, T.M, R. W. B., L.F. Harder, JR., M.W. Driller (2001). Confinement and Disturbance Effects on Dynamic Properties of Fibrous Organic Soil. XV ICSMGE Satellite Conference on "Lessons Learned from Recent Strong Earthquakes", Istanbul,Turkey.