An Analysis of Vertical Splitting Algorithm
Ruchika Bhaskar
Research Student Computer Science DepartmentRajasthan Technical University Jaipur, Rajasthan, India
Rakesh Sharma
Associate Professor Computer Science DepartmentRajasthan Technical University, Jaipur, Rajasthan, India
ABSTRACT
Distribution design involves making decisions on the fragmentation and allocation of data across the sites of a computer network. Vertical splitting is the process of subdividing the attributes of a relation to generate fragments. In this paper, we propose an analysis for vertical splitting algorithm using prototype approach. This approach starts from the attribute affinity matrix and generates initial clusters based on the affinity values between attributes. Then, it uses the database according to optimal splitting solution to produce final groups that will represent the fragments. Then we analysed these fragments according to their contribution level. The result is generated that shows how to find optimal solutions.
Keywords
BEA, Distributed Database, Vertical Fragmentation.
1.
INTRODUCTION
Distributed and parallel processing on database management systems (DBMS) is an efficient way of enhancing performance of applications that work on large volumes of data. This may be accomplished by eliminating irrelevant data accessed during the execution of queries and by reducing the data exchange among sites, which are the two main goals of the design of distributed databases [2].
The primary concern of distributed database systems is to design the fragmentation and allocation of the underlying database. The designing of distribution involves making decisions on the fragmentation and placement of data across the sites of a computer network. The first phase of the distribution design in a top-down approach is the fragmentation phase, which is the process of clustering into fragments the data accessed simultaneously by applications. The fragmentation phase is then followed by the allocation phase, which handles the physical storage of the generated fragments among the nodes of a computer network, and the replication of fragments.
2.
RELATED WORK
Most of the vertical splitting algorithms have started from constructing an attribute affinity matrix from the attribute usage matrix: the Attribute affinity matrix is an m x m matrix for the m-attribute problem whose (i, j) element equals the “between attributes” affinity which is the total number of accesses of transactions referencing both attributes i and j. An iterative binary partitioning method has been used in [8] and [5] based on first clustering the attributes and then applying empirical objective functions or mathematical cost functions to perform the fragmentation. The concept of using fragmentation of data as a means of improving the performance of a database management system has often appeared in the literature on file design and optimization. Attribute partitioning and attribute clustering have been
studied earlier by [4], [3], [6], [8], [9] has discussed the implementation of a self-reorganizing database management system that carries out attribute clustering. They also show that in a database management system where storage cost is low compared to the cost of accessing the sub files, it is beneficial to cluster the attributes, since the increase in storage cost will be more than offset by the saving in access cost. Hoffer [6] developed a non-linear, zero-one program, which minimizes a linear combination of storage, retrieval and update costs, with capacity constraints for each file.
Navathe et al [8] used a two-step approach for vertical partitioning. In the first step, they used the given input parameters in the form of an attribute usage matrix to construct the attribute affinity matrix on which clustering is performed. After clustering, an empirical objective function is used to perform iterative binary partitioning. In the second step, estimated cost factors reflecting the physical environment of fragment storage are considered for further refinement of the partitioning scheme. Cornell and Yu [5] proposed an algorithm, as an extension of Navathe et al [8] approach, which decreases the number of disk accesses to obtain an optimal binary partitioning. This algorithm uses specific physical factors such as number of attributes, their length and selectivity, cardinality of the relation etc.
Navathe and Ra have developed a new algorithm based on a graphical technique [7]. This algorithm starts from the attribute affinity matrix by considering it as a complete graph called the “affinity graph” in which an edge value represents the affinity 1-4244-1364-8/07/$25.00 ©2007 IEEE between the two attributes, and then forms a linearly connected spanning tree. The algorithm generates all meaningful fragments in single iteration by considering a cycle as a fragment. A linearly connected tree has only two ends. By a “linearly connected tree” we imply a tree that is constructed by including one edge at a time such that only edges at the “first” and the “last” node of the tree would be considered for inclusion. We then form “affinity cycles” in this spanning tree by including the edges of high affinity value around the nodes and “growing” these cycles as large as possible. After the cycles are formed, partitions are easily generated by cutting the cycles apart along “cut-edges”. In this paper we will use an algorithm to cluster the database i.e. Bond Energy Algorithm (BEA). And use these cluster affinity as input to find final fragments using PARTITION algorithm. Then using prototypes we reach to the goal of reducing response time of query using fragmentation and show the mathematical result for proof.
3.
BACKGROUND OF SPLITTING
ALGORITHM
(when the client is far away and communication is very frequent in between the client & server), unavailability in case of system failure and a single source bottleneck [3].
Research conducted in 1991 for distributed databases predicted a huge shift from traditional databases to distributed databases in the coming arena, due to organizational needs to manage huge amounts of data [11]
The telecommunication sector also wants to embrace this technology of data distribution. But before distribution of data, fragmentation is a very important and critical task that needs to be done.
Most of the telecom industries are using centralized technique in storage of their database. Centralized database has its disadvantage of high communication cost. Some data is unavailable due to problem in server. To resolve these issues we are moving from centralized database to distribution of the database.
4.
ANALYSIS OF ALGORITHM USED
FOR SPLITTING THE DATABASE
The vertical fragmentation proposed in this paper is executed in following manner. (1) When a query uses attribute from a relation its value is true (2) Information about databases and query are notified before fragmentation process. (3)Query consists of attributes. The use of attribute means accessing to the value of an existing attribute without any side-effect. Our fragmentation is composed of attribute fragmentation. A set of attributes defined in a relation is vertically partitioned into attribute fragments on basis of application queries like
1. Normal
Find subscriber via peer_id and area Find Narrative
2. Recharge
Find subscriber via peer_id and area Find subscriber_id
Find Narrative(units) Update Narrative(units)
Update subscriber (Sub_Param1, 2, 3) 3. Balance Inquiry
Find subscriber via peer_id and area Find Narrartives etc.
Figure 1: Sample Queries of experiment
After, the attribute fragments are generated, the attribute fragmentation is executed on basis of queries .Also, a query can access attributes of other relation on a database hierarchy. To reflect these characteristics of queries, we calculate QA(query access) matrix, FA(site access) matrix and AU(attribute usage) matrix. In FA matrix, QA matrix contains all explanation in of attribute used by Sites of different relations and to represent attributes usage by different queries.
4.1
QA matrix:
QA (Query Access) matrix represents the use of attributes in application queries. Figure 2 and Figure 3 is an example of the QA matrix for subscriber relation and Narrative relation used as database in this paper.
1 1 1 1 0 1 1 1 0 1 0 1 1 0 1 0 0 0 0 0 0 0 1 1 0 1 1 0 0 0 0 0 0 1 1 1 1 0 0 0 0 0 0 0 1 1 1 0 1 0 0 0 0 0 0 1 1 0 1 0 0 0 0 1 0 0 1 1 1 0 0 0 0 0 0 0 0 1 0 1 0 0 0 0 0 0 0 0 1 0 1 0 0 0 0 0 0 0 0
Figure 2: SUBSCR QA Matrix
1 1 1 1 1 1 1 1 1 1 1 0 1 1 1 0 1 0 1 1 1 1 0 0 0 0 0 0 0 0 0 0 0 0 0 0 0 1 1 1 1 0 0 0 0 0 0 0 0 1 0 1 0 0
Figure 3: NARRATIVE QA Matrix
Each row represents queries and each column represents attributes Q1-A1, Q1-A2, Q1-A3……Q1-A11 are queries about SUBSCR relation. And in the similar manner for NARRATIVE relation (in Figure 3). The entry "1" indicates that the query uses the corresponding attributes. Attributes of other relation accessed by query can be represented in QA matrix. For example, Q1 accesses to not only sub_id, peer_id, status, language of its own relation SUBSCR but also narrative_id, sub_id, narrative_type, and unit_type of relation NARRATIVE.
Combined AQ matrix (CAQ)
1 1 1 1 0 1 1 1 0 1 0 1 1 1 1 1 1 1 0 1 0 0 0 0 0 0 0 1 1 1 1 0 1 1 0 1 1 0 0 0 0 0 0 1 1 0 1 0 1 1 1 1 0 0 0 0 0 0 0 1 1 1 0 0 1 1 1 0 1 0 0 0 0 0 0 0 0 0 0 0 1 1 0 1 0 0 0 0 1 0 0 0 0 0 0 0 1 1 1 0 0 0 0 0 0 0 0 0 1 1 1 0 1 0 1 0 0 0 0 0 0 0 0 0 0 0 0 0 1 0 1 0 0 0 0 0 0 0 0 0 0 1 0 0
Figure 4: Combined AQ matrix (CAQ)
4.2
FA Matrix:
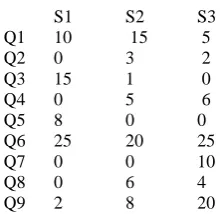
The access frequency represents the sum of number of accesses about query generated in one or more sites.
Figure 5 shows the access frequency of different queries by different sites In QA matrix, A usage value of attribute Aj for a query qi is defined as:
S1 S2 S3
Q1 10 15 5
Q2 0 3 2
Q3 15 1 0
Q4 0 5 6
Q5 8 0 0
Q6 25 20 25
Q7 0 0 10
Q8 0 6 4
[image:3.595.63.174.69.176.2]Q9 2 8 20
Figure 5: Access Frequency Matrix(FA)
The AA (attribute affinity) matrix is generated from the AQ matrix using the same technique as relational vertical fragmentation approach.
Attribute Affinity Matrix aff(Ai, Aj)
The attribute affinity represents the strength of bond between the two attributes. The attribute affinity for two attributes Ai and Aj defined as
aff(Ai, Aj)=k | use(qk, Ai) =1^ use(qk,Aj) =1acc (qk)
where aff(Ai, Aj) is affinity value between Ai and Aj, acc(qk) is the total number of access of query qk generated in multiple sites. Figure 6 and Figure 7 shows an example of AA matrix.
The AA matrix is needed to be clustered, and then becomes to divide into attribute fragments. Bond Energy Algorithm (BEA) is used to cluster the AA matrix. The algorithm is as following:
Algorithm: BEA
Input: AA attribute affinity matrix Output: CA clustered affinity matrix Begin
{Initialize; remember that AA is an n x n Matrix} CA(R∙ ,1) ←AA(R,1)
CA(R ,2) ←AA(R,2) index←3
while index≤n do {choose the “best” location for attribute AAindex}
begin
for I from 1 to index-1 by 1 do
calculate cont(Aindex-1, Aindex, Aindex+1) end-for
calculate cont(Aindex-1, Aindex, Aindex+1) {boundary condition}
location←placement given by maximum cont value
for j from index to location by -1 do {shuffle the two matrices}
CA(R ,j) ←AA(R,j-1) end-for
CA(R ,location) ←AA(R,index) index←index+1
end-while
order the rows according to the relative ordering of columns end.{BEA}
The purpose of clustering is to combine large affinity value of AA matrix with large affinity values, and the small one with small ones.
5.
IMPLEMENTATION AND
COMPARISION
We have implemented the vertical class fragmentation proposed in this paper using JAVA programming language on an IBM-PC. The implementation was executed in the following procedures.
First, establish the example structure of class schema and example queries with the access frequency.
Second, generate the QA, AU matrix for all tables. Third, for each table, generate AA and CA matrixes.
Fourth, partition the CA matrixes and make the attribute fragments.
When we apply both BEA algorithm [16] and vertical Partition algorithm [16] according to the Attribute usage matrix and Attribute Affinity matrix we conclude to the fragment results and selected one of the optimal solutions available.
5.1
Testing Results
In this section we analysed the result. After applying algorithm we find following result.
Query : Sum of Attribute access
q1: 30
q2: 5
q3: 16
q4: 11
q5: 8
q6: 70
q7: 10
q8: 10
q9: 30
Figure 6: Query Total Access Frequency
q1: A1 A10 A11 A2 A3 A4 A6 A7 A8 30 q2: A1 A2 A9 5
q3: A1 A2 A9 16 q4: A1 A2 A3 A9 11 q5: A1 A2 A3 A9 8 q6: A1 A2 A8 A9 70 q7: A1 A2 A3 10 q8: A1 A3 10 q9: A1 A3 30
Figure 7: Attribute Usage with frequency
A1 A10 A11 A2 A3 A4 A6 A7 A8 A9 A1 190 30 30 150 99 30 30 30 100 110 A10 30 30 30 30 30 30 30 30 30 0 A11 30 30 30 30 30 30 30 30 30 0 A2 150 30 30 150 59 30 30 30 100 110 A3 99 30 30 59 99 30 30 30 30 19 A4 30 30 30 30 30 30 30 30 30 0 A6 30 30 30 30 30 30 30 30 30 0 A7 30 30 30 30 30 30 30 30 30 0 A8 100 30 30 100 30 30 30 30 100 70 A9 110 0 0 110 19 0 0 0 70 110
Figure 8: Attribute Affinity Matrix Subscr
In Figure 8, A10 comes after A1 it depends upon the bond energy which can be calculated for individual column randomly.
5.1.1
Place attributes:
place A1
contribution at pos 0 = 20670 contribution at pos 1 = 85841 contribution at pos 2 = 83441
attribute A1 is placed at pos 1: [A4, A1, A2]
place A10
contribution at pos 0 = 8100 contribution at pos 1 = 8100 contribution at pos 2 = -44501 contribution at pos 3 = 18270
attribute A10 is placed at pos 3: [A4, A1, A2, A10]
place A11
contribution at pos 0 = 8100 contribution at pos 1 = 8100 contribution at pos 2 = -44501 contribution at pos 3 = 8100 contribution at pos 4 = 8100
attribute A11 is placed at pos 0: [A11, A4, A1, A2, A10]
place A3
contribution at pos 0 = 13110 contribution at pos 1 = 18120 contribution at pos 2 = 39491 contribution at pos 3 = 2741 contribution at pos 4 = 33971 contribution at pos 5 = 13110
attribute A3 is placed at pos 2: [A11, A4, A3, A1, A2, A10]
place A6
contribution at pos 0 = 8100 contribution at pos 1 = 8100 contribution at pos 2 = 8100 contribution at pos 3 = -13271 contribution at pos 4 = -44501 contribution at pos 5 = 8100 contribution at pos 6 = 8100
attribute A6 is placed at pos 0: [A6, A11, A4, A3, A1, A2, A10]
place A7
contribution at pos 0 = 8100 contribution at pos 1 = 8100 contribution at pos 2 = 8100 contribution at pos 3 = 8100 contribution at pos 4 = -13271 contribution at pos 5 = -44501 contribution at pos 6 = 8100 contribution at pos 7 = 8100
attribute A7 is placed at pos 0: [A7, A6, A11, A4, A3, A1, A2, A10]
place A8
contribution at pos 0 = 14400 contribution at pos 1 = 20700 contribution at pos 2 = 20700 contribution at pos 3 = 20700 contribution at pos 4 = 28890 contribution at pos 5 = 39719 contribution at pos 6 = 29699 contribution at pos 7 = 50100 contribution at pos 8 = 14400
attribute A8 is placed at pos 7: [A7, A6, A11, A4, A3, A1, A2, A8, A10]
place A9
contribution at pos 0 = 9270 contribution at pos 1 = 10440 contribution at pos 2 = 10440 contribution at pos 3 = 10440 contribution at pos 4 = 19611 contribution at pos 5 = 34781 contribution at pos 6 = 28161 contribution at pos 7 = 36521 contribution at pos 8 = 32140 contribution at pos 9 = 9270
attribute A9 is placed at pos 7: [A7, A6, A11, A4, A3, A1, A2, A9, A8, A10]
The order below leads to the highest bond energy.
resulting order: [A7, A6, A11, A4, A3, A1, A2, A9, A8, A10]
There are now several possibilities to split the table:
split quality (sq) = accesses(fragment 1) * accesses(fragment 2) - accesses(fragment 1 AND fragment 2)^2
5.1.2
Find fragments:
split at [A1, A10, A11, A2, A3, A4, A7, A8, A9] | [A6] accesses frag1 alone: 160
accesses frag2 alone: 0 accesses frag1 and frag2: 30 split quality = -900
split at [A1, A10, A2, A3, A4, A7, A8, A9] | [A11, A6] accesses frag1 alone: 160
accesses frag2 alone: 0 accesses frag1 and frag2: 30 split quality = -900
split at [A1, A10, A2, A3, A7, A8, A9] | [A11, A4, A6] accesses frag1 alone: 160
accesses frag2 alone: 0 accesses frag1 and frag2: 30 split quality = -900
split at [A1, A10, A2, A7, A8, A9] | [A11, A3, A4, A6] accesses frag1 alone: 91
accesses frag2 alone: 0 accesses frag1 and frag2: 99 split quality = -9801
split at [A10, A2, A7, A8, A9] | [A1, A11, A3, A4, A6] accesses frag1 alone: 0
accesses frag2 alone: 40 accesses frag1 and frag2: 150 split quality = -22500
split at [A10, A7, A8, A9] | [A1, A11, A2, A3, A4, A6] accesses frag1 alone: 0
accesses frag2 alone: 50 accesses frag1 and frag2: 140 split quality = -19600
split at [A10, A7, A8] | [A1, A11, A2, A3, A4, A6, A9] accesses frag1 alone: 0
accesses frag2 alone: 90 accesses frag1 and frag2: 100 split quality = -10000
accesses frag2 alone: 160 accesses frag1 and frag2: 30 split quality = -900
split at [A7] | [A1, A10, A11, A2, A3, A4, A6, A8, A9] accesses frag1 alone: 0
accesses frag2 alone: 160 accesses frag1 and frag2: 30 split quality = -900
split at [A1, A10, A2, A3, A4, A6, A7, A8, A9] | [A11] accesses frag1 alone: 160
accesses frag2 alone: 0 accesses frag1 and frag2: 30 split quality = -900
split at [A1, A10, A2, A3, A6, A7, A8, A9] | [A11, A4] accesses frag1 alone: 160
accesses frag2 alone: 0 accesses frag1 and frag2: 30 split quality = -900
split at [A1, A10, A2, A6, A7, A8, A9] | [A11, A3, A4] accesses frag1 alone: 91
accesses frag2 alone: 0 accesses frag1 and frag2: 99 split quality = -9801
split at [A10, A2, A6, A7, A8, A9] | [A1, A11, A3, A4] accesses frag1 alone: 0
accesses frag2 alone: 40 accesses frag1 and frag2: 150 split quality = -22500
split at [A10, A6, A7, A8, A9] | [A1, A11, A2, A3, A4] accesses frag1 alone: 0
accesses frag2 alone: 50 accesses frag1 and frag2: 140 split quality = -19600
split at [A10, A6, A7, A8] | [A1, A11, A2, A3, A4, A9] accesses frag1 alone: 0
accesses frag2 alone: 90 accesses frag1 and frag2: 100 split quality = -10000
split at [A10, A6, A7] | [A1, A11, A2, A3, A4, A8, A9] accesses frag1 alone: 0
accesses frag2 alone: 160 accesses frag1 and frag2: 30 split quality = -900
split at [A6, A7] | [A1, A10, A11, A2, A3, A4, A8, A9] accesses frag1 alone: 0
accesses frag2 alone: 160 accesses frag1 and frag2: 30 split quality = -900
split at [A1, A10, A11, A2, A3, A6, A7, A8, A9] | [A4] accesses frag1 alone: 160
accesses frag2 alone: 0 accesses frag1 and frag2: 30 split quality = -900
split at [A1, A10, A11, A2, A6, A7, A8, A9] | [A3, A4] accesses frag1 alone: 91
accesses frag2 alone: 0
accesses frag1 and frag2: 99 split quality = -9801
split at [A10, A11, A2, A6, A7, A8, A9] | [A1, A3, A4] accesses frag1 alone: 0
accesses frag2 alone: 40 accesses frag1 and frag2: 150 split quality = -22500
split at [A10, A11, A6, A7, A8, A9] | [A1, A2, A3, A4] accesses frag1 alone: 0
accesses frag2 alone: 50 accesses frag1 and frag2: 140 split quality = -19600
split at [A10, A11, A6, A7, A8] | [A1, A2, A3, A4, A9] accesses frag1 alone: 0
accesses frag2 alone: 90 accesses frag1 and frag2: 100 split quality = -10000
split at [A10, A11, A6, A7] | [A1, A2, A3, A4, A8, A9] accesses frag1 alone: 0
accesses frag2 alone: 160 accesses frag1 and frag2: 30 split quality = -900
split at [A11, A6, A7] | [A1, A10, A2, A3, A4, A8, A9] accesses frag1 alone: 0
accesses frag2 alone: 160 accesses frag1 and frag2: 30 split quality = -900
split at [A1, A10, A11, A2, A4, A6, A7, A8, A9] | [A3] accesses frag1 alone: 91
accesses frag2 alone: 0 accesses frag1 and frag2: 99 split quality = -9801
split at [A10, A11, A2, A4, A6, A7, A8, A9] | [A1, A3] accesses frag1 alone: 0
accesses frag2 alone: 40 accesses frag1 and frag2: 150 split quality = -22500
split at [A10, A11, A4, A6, A7, A8, A9] | [A1, A2, A3] accesses frag1 alone: 0
accesses frag2 alone: 50 accesses frag1 and frag2: 140 split quality = -19600
split at [A10, A11, A4, A6, A7, A8] | [A1, A2, A3, A9] accesses frag1 alone: 0
accesses frag2 alone: 90 accesses frag1 and frag2: 100 split quality = -10000
split at [A10, A11, A4, A6, A7] | [A1, A2, A3, A8, A9] accesses frag1 alone: 0
accesses frag2 alone: 160 accesses frag1 and frag2: 30 split quality = -900
split at [A11, A4, A6, A7] | [A1, A10, A2, A3, A8, A9] accesses frag1 alone: 0
split quality = -900
split at [A10, A11, A2, A3, A4, A6, A7, A8, A9] | [A1] accesses frag1 alone: 0
accesses frag2 alone: 0 accesses frag1 and frag2: 190 split quality = -36100
split at [A10, A11, A3, A4, A6, A7, A8, A9] | [A1, A2] accesses frag1 alone: 0
accesses frag2 alone: 0 accesses frag1 and frag2: 190 split quality = -36100
split at [A10, A11, A3, A4, A6, A7, A8] | [A1, A2, A9] accesses frag1 alone: 0
accesses frag2 alone: 21 accesses frag1 and frag2: 169 split quality = -28561
split at [A10, A11, A3, A4, A6, A7] | [A1, A2, A8, A9] accesses frag1 alone: 0
accesses frag2 alone: 91 accesses frag1 and frag2: 99 split quality = -9801
split at [A11, A3, A4, A6, A7] | [A1, A10, A2, A8, A9] accesses frag1 alone: 0
accesses frag2 alone: 91 accesses frag1 and frag2: 99 split quality = -9801
split at [A1, A10, A11, A3, A4, A6, A7, A8, A9] | [A2] accesses frag1 alone: 40
accesses frag2 alone: 0 accesses frag1 and frag2: 150 split quality = -22500
split at [A1, A10, A11, A3, A4, A6, A7, A8] | [A2, A9] accesses frag1 alone: 40
accesses frag2 alone: 0 accesses frag1 and frag2: 150 split quality = -22500
split at [A1, A10, A11, A3, A4, A6, A7] | [A2, A8, A9] accesses frag1 alone: 40
accesses frag2 alone: 0 accesses frag1 and frag2: 150 split quality = -22500
split at [A1, A11, A3, A4, A6, A7] | [A10, A2, A8, A9] accesses frag1 alone: 40
accesses frag2 alone: 0 accesses frag1 and frag2: 150 split quality = -22500
split at [A1, A10, A11, A2, A3, A4, A6, A7, A8] | [A9] accesses frag1 alone: 80
accesses frag2 alone: 0 accesses frag1 and frag2: 110 split quality = -12100
split at [A1, A10, A11, A2, A3, A4, A6, A7] | [A8, A9] accesses frag1 alone: 50
accesses frag2 alone: 0 accesses frag1 and frag2: 140 split quality = -19600
split at [A1, A11, A2, A3, A4, A6, A7] | [A10, A8, A9] accesses frag1 alone: 50
accesses frag2 alone: 0 accesses frag1 and frag2: 140 split quality = -19600
split at [A1, A10, A11, A2, A3, A4, A6, A7, A9] | [A8] accesses frag1 alone: 90
accesses frag2 alone: 0 accesses frag1 and frag2: 100 split quality = -10000
split at [A1, A11, A2, A3, A4, A6, A7, A9] | [A10, A8] accesses frag1 alone: 90
accesses frag2 alone: 0 accesses frag1 and frag2: 100 split quality = -10000
split at [A1, A11, A2, A3, A4, A6, A7, A8, A9] | [A10] accesses frag1 alone: 160
accesses frag2 alone: 0 accesses frag1 and frag2: 30 split quality = -900
optimal split(s) (sq = -900):
[A1, A10, A11, A2, A3, A4, A7, A8, A9] | [A6] [A1, A10, A2, A3, A4, A7, A8, A9] | [A11, A6] [A1, A10, A2, A3, A7, A8, A9] | [A11, A4, A6] [A10, A7] | [A1, A11, A2, A3, A4, A6, A8, A9] [A7] | [A1, A10, A11, A2, A3, A4, A6, A8, A9] [A1, A10, A2, A3, A4, A6, A7, A8, A9] | [A11] [A1, A10, A2, A3, A6, A7, A8, A9] | [A11, A4] [A10, A6, A7] | [A1, A11, A2, A3, A4, A8, A9] [A6, A7] | [A1, A10, A11, A2, A3, A4, A8, A9] [A1, A10, A11, A2, A3, A6, A7, A8, A9] | [A4] [A10, A11, A6, A7] | [A1, A2, A3, A4, A8, A9] [A11, A6, A7] | [A1, A10, A2, A3, A4, A8, A9] [A10, A11, A4, A6, A7] | [A1, A2, A3, A8, A9] [A11, A4, A6, A7] | [A1, A10, A2, A3, A8, A9] [A1, A11, A2, A3, A4, A6, A7, A8, A9] | [A10]
Similar approach can be used for NARRATIVE relation and we find the following solution. The following order leads to highest bond energy
resulting order: [A6, A5, A3, A2, A4, A1]
and optimal split(s) (sq = 13180): [A6] | [A1, A2, A3, A4, A5]
So following fragments has been selected with primary key [16].
Fragments of Subscr
[A1,A11, A6, A7] | [A1, A10, A2, A3, A4, A8, A9]
Fragments of Narrative [A1,A6] | [A1, A2, A3, A4, A5]
6.
CONCLUSION
Distributed databases have many aspects and every organization has certain preferences. For the telecom sector, the response time is prioritized.
Our experiment showed that the how to calculate the fragments for different criteria used. In the distributed database, data is fragmented. These fragments are short compared to the full database (centralized database contains maximum columns). However, when we need data from multiple sites for a query (report queries), the response time is increased. Accessing data from multiple remote sites and then joining those takes long time. But in the centralized database since data is at one place so, it is easy and fast to search it. The purpose of conducting this study is to know the distributed databases using vertical fragmentation. How to do attribute distribution in vertical fragmentation?
Answer: This question is depending upon the data available and algorithms available. Anyone can choose its data according to heuristic approach. Based on algorithms available for vertical fragmentation both type of databases, and experiment was performed. Experiment results are discussed in section 5 .We found that the response time is decreased in distributed databases. Because, due to fragmentation data set for single site contains less records than centralized database, so response time is less.
7.
REFERENCES
[1] Ceri, S. and Pelagatti, G. Distributed DatabasesPrinciples and Systems. NY, McGraw Hill, 1984. .
[2] Ezeife, C. I. and Barker, K. Vertical Class Fragmentation in a Distributed Object Based Svstem. TR 94-03, Univ. of Manitoba DeRt. ofCbmputer Science, 1993.
[3] H.o ffer. 1. A.. and Severance. D. G. The Use of Cluster Analysis in Physical Database Design.In Proceedings of 1st VLDB Conference, Mass., 1975.
[4] Karlapalem, K. and Li, 8. Partitioning Schemes for Object Oriented Database. In 5th InternationalWorkshop on Research Issues on Data Engineering: Distributed Object Management, 1995.
[5] Karlapalem, K., Li, 8. and Vieweg,, S. Method Induced Partitioning Schemes in Object OrientedDatabases. In
16th intemational conference on Distributed Computing System, Hong Kong, 1996.
[6] Karlapalem, K., Navathe, S. B. and Morsi, M. M.A. Issues in Distribution design. of object-oriented databases, in Distributed Object Management, Morgan Kaufmann Publishers, 1994.
[7] Lee, S. and Lim, H., Extension of Vertical Technical Conference on Circuits/systems, Computers And Communications, Japan, 1997.
[8] Navathe, S. B., Ceri, S. Wiederhold, G. and Dou, J.Vertical partitioning algorithms for database design.in ACM TODS 9(4), 1984.
[9] Farhi Marir, Yahiya Najjar, Mahmoud Y. AlFaress, Hassan I. Abdalla, “An Enhanced Grouping Algorithm for Vertical Partitioning Problem in DDBs
[10]Adrian Runceanu, Towards Vertical Fragmentation in Distributed Databases
[11]Ashraf, Imran And Khokhar, A.S. 2010. Principles for Distributed Databases in Telecom Environment., Sweden.
[12]Huang, Y.-F. And Chen, J.-H. 2001. Fragment Allocation in Distributed Database Design.
[13]Mitchell , C. Components of a Distributed Database.
[14]Jonker, W. 2000. Databases in telecommunications: international workshop co-located with VLDB-99, Edinburgh, Scotland, UK, September 6th 1999: proceedings. Springer, Berlin.
[15]Hvasshovd, S.-O. 1995. the clustRa telecom database: high availability high throughput and real-time response Proceedings of 21st VLDB Conference.