http://dx.doi.org/10.4236/ojs.2014.45040
How to cite this paper: Mwangi, C., Islam, A. and Orawo, L. (2014) Efficiency of the Adaptive Cluster Sampling Designs in Estimation of Rare Populations. Open Journal of Statistics, 4, 412-418. http://dx.doi.org/10.4236/ojs.2014.45040
Efficiency of the Adaptive Cluster Sampling
Designs in Estimation of Rare Populations
Charles Mwangi*, Ali Islam, Luke OrawoDepartment of Mathematics, Egerton University, Nakuru, Kenya Email: *[email protected]
Received 2 July 2014; revised 3 August 2014; accepted 11 August 2014
Copyright © 2014 by authors and Scientific Research Publishing Inc.
This work is licensed under the Creative Commons Attribution International License (CC BY).
http://creativecommons.org/licenses/by/4.0/
Abstract
Adaptive cluster sampling (ACS) has been a very important tool in estimation of population para-meters of rare and clustered population. The fundamental idea behind this sampling plan is to de-cide on an initial sample from a defined population and to keep on sampling within the vicinity of the units that satisfy the condition that at least one characteristic of interest exists in a unit se-lected in the initial sample. Despite being an important tool for sampling rare and clustered pop-ulation, adaptive cluster sampling design is unable to control the final sample size when no prior knowledge of the population is available. Thus adaptive cluster sampling with data-driven stop-ping rule (ACS’) was proposed to control the final sample size when prior knowledge of population structure is not available. This study examined the behavior of the HT, and HH estimator under the ACS design and ACS’ design using artificial population that is designed to have all the characte-ristics of a rare and clustered population. The efficiencies of the HT and HH estimator were used to determine the most efficient design in estimation of population mean in rare and clustered popu-lation. Results of both the simulated data and the real data show that the adaptive cluster sam-pling with stopping rule is more efficient for estimation of rare and clustered population than or-dinary adaptive cluster sampling.
Keywords
Adaptive Cluster Sampling with Stopping Rule (ACS’), Ordinary Adaptive Cluster Sampling (ACS), Horvitz Thompson Estimator (HT), Hansen-Hurwitz Estimator (HH), Relative Efficiency
1. Introduction
In ecology, most of the species are sparse and they tend to be found in clusters. In geology, most of the minerals
are found in clusters. Thus there is a need for a good estimation design for all characteristics of interest of these minerals for commercial purpose. Adaptive cluster sampling is a sampling design that can be used to estimate the population parameters of interest for rare, clustered and endangered populations [1]. The sampling design is termed as adaptive if the sampling procedure depends on the selection rather than the assumption of the popula-tion. The basic idea behind this sampling plan is to decide on an initial sample from a defined population by some probability sampling methods such as simple random sampling and to keep on sampling within the vicini-ty of the units that satisfy the conditions that are defined previously. The requisites of adaptive cluster sampling design comprise of an initial selection of units, a condition that determines when additional units should be added to the sample from the neighborhood of that unit and a clear definition of the neighborhood of every unit.
There is an increase in sampling efficiency under ACS resulting in more precise estimates of the population parameter, that is, the ACS leads to an increase in the number of observation of the target species that may result in more reliable estimates of other population parameters such as species richness in information, population composition and relative abundance [2]. These advantages are more evident in rare and clustered populations [3].
The major disadvantage of adaptive cluster sampling in estimation of population parameters is the uncertainty of the final sample size. Much attention has been focused to limit the size of the final sample in ACS [4]. How-ever, prior knowledge of the population is required to limit the final sample [5].
Adaptive Cluster Sampling Designs
Adaptive cluster was initiated by [1] for sampling the population that exhibits rare and clustering characteristics. We consider a study region divided into M units (networks). Let y y1, 2,,yM be the values of the variables
observed, that is yi, is the number of observed offspring or children in every network. The mean
1
1 M
i i y
M
µ=
∑
= is the parameter of the observed offspring in every unit.The adaptive design usually starts by an initial sample of unit n1 selected by some convectional design such
as simple random sampling and to continue sampling within the neighborhood of the units that satisfy the condi-tions that are defined previously. The basic essentials of adaptive cluster sampling design consist of an initial selection of units, a condition that determines when additional units should be added to the sample from the neighborhood of that unit and a clear definition of the neighborhood of every unit. This design was introduced by Thompson (1990) for estimation of population parameter of rare and clustered populations. Since the intro-duction of this design many researchers have had a lot of interest in the use of this design in estimation of para-meters of highly clustered and rare populations [6].
Two design-unbiased estimators were introduced by [4] based on the Horvitz-Thompson (HT) and the Han-sen-Hurwitz (HH) estimators. Since the study area is divided into networks, the HT estimator uses the inclusion probability while the HH estimator uses the draw by draw probability.
Because controlling the final sample size in ACS design is a big challenge, a variant to the original ACS de-sign was proposed by introducing a stopping rule at each aggregative step and for each unit in the initial sample [7]. Once the th
K step of the aggregative procedure has been completed, further units will be sampled if and only if ( ) ( ) ( ) ( ) 2 1 1 1 1 1 1 1 1 K k i k i k i k i
S s m
s m − − − −
= > (1.1.1)
where si2( )K is the within-network variance estimate for the
th
K step for the ith initial unit and mi( )k is the
cardinality of the set of units adaptively sampled after the kth step. The condition shows how the with-in-network variance and the final sample size determine the efficiency of the adaptive design.
2. Estimators
2.1. The Hansen-Hurwitz Estimator
The Hansen-Hurwitz estimator is based on draw-by-draw selection probability of selecting a primary sampling unit on any given draw. Since draw-by-draw selection probability cannot be known for all primary units in the sample but can be established for the networks, the HH estimator can be modified to use the unit that do not sa-tisfy the condition when they are selected in the initial sample. The modified Hansen-Hurwitz estimator is ex-pressed as 1 HH 1 1 1 n i i v n µ =
=
∑
(2.1.1)where vi is the average of the yi values in the network
( )
Ai that include the thi unit of the initial sample of size n1. If miis the number of units in the network Ai, then.
1 i i i i A i v y m ∈
=
∑
(2.1.2)The sampling variance of the Hansen-Hurwitz estimator is expressed as
(
)
(
1)
2HH
1
var N N n
n
µ = − σ
(2.1.3)
where,
(
)
22 1 1 1 1 N i i v n σ µ = = − −
∑
(2.1.4)2.2. Horvitz-Thompson Estimator
The Horvitz-Thompson estimator is based on inclusion probabilities
( )
πi , but on application of ACS theinclu-sion probabilities for every sampling unit selected in the sample cannot be established. Nevertheless, it is possi-ble to establish the probability of including a network in the sample selected. A network is a subset of distinct units within a cluster, such that selection of any unit within the network would lead to the inclusion of all other units in the network. Units that fail to satisfy C but are in the neighborhood of one that satisfy are referred to as edge units. Thus, all units selected in the initial sample and fail to satisfy C will be considered to be networks of size one. On partitioning the adaptive cluster sample into distinct networks rather than basic sampling units, the HT estimators for the population mean can be expressed as
HH 1 1 N k k y N µ =
=
∑
(2.2.1)where yk
∗
is total number of individuals in the th
k network, k is the number of distinct networks in the sample, and the πk is the probability of including any unit in the network k. If there are mk units in the
th
k network, then the inclusion probability can be expressed as
1 1
1 k
k
N m N
n n
π − −
=
(2.2.2)
The sampling variance of the estimator is expressed as
(
HT)
2(
)
1 1 1 var
N N
k h kh k h k h
k h
y y N
µ π π π π π
= =
=
∑∑
− (2.2.3)where πkh is the probability of including both network k and h in the adaptive sample and is expressed as
1 1 1 1
1 h k k h
kh
N m N m N m m N
n n n n
π − − + − − − − =
(2.2.4)
3. Methods
simulated on a relatively larger area while the offspring were simulated on a smaller study area to avoid the edge effect. The position of the offspring relative to their parents was independently distributed. Only the offspring was retained in the final population pattern. The study area was divided into 40 40× =N units. For control of the edge effect of Poisson cluster process a 20 20× unit was selected as the study area. Each population was sampled 100 times with SRS, ordinary ACS and ACS with data driven stopping rule.
The efficiency of the designs was determined using relative efficiency, that is,
( )
(
)
HT
var HT va .E
S R
r SR
= , and
( )
(
)
HH
var HH va .E
S R
r SR
= , under both the adaptive cluster sampling designs.
4. Results and Discussion
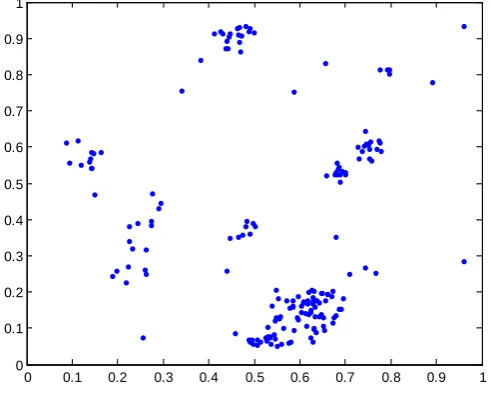
For the two populations examined forFigure 1and Figure2 in this study there were multiple conditions under which one or both design based estimators were relatively more efficient than the classical estimator given an equal final sample size. The Hansen-Hurwitz estimator performed uniformly worse than the Horvitz-Thompson estimator and rarely better than the SRS mean. Complete tables of the relative efficiencies of both the HT and HH estimators under all conditions are presented in Table 1 and Table 2.
Some interesting characteristics were observed across increasing final sample size. The efficiency of both adaptive cluster sampling estimators in ACS and ACS’ increased as the initial sample size increased. Interes-tingly, the HT estimators showed intense increase in efficiency with only modest increase in the sample size. For example the efficiency of the HT estimator at sampling of the population 1, that is Figure 1, from results in
Table 1 increases by 0.1413 folds for ACS and by 0.0505 for ACS’ as the final sample size increases from 20 to 90. The above results are caused by the increase of the final sample size as the probability of including the large networks increases and hence resulting into low variances.
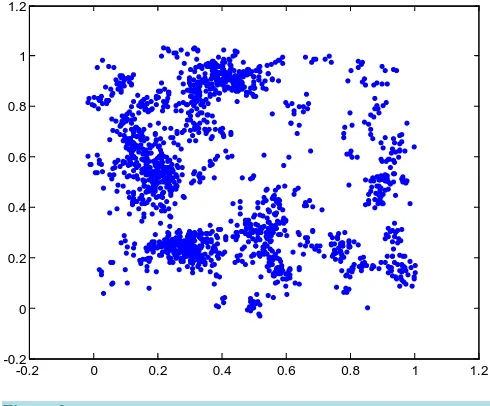
As the rarity and the clustering of the population decreases, the efficiency of design based estimators (HT and HH estimators) relative to classical estimator (SRS mean) reduces. The results of the efficiency of the HT and HH estimators from population 2 that is for Figure 1as show in Table 2 indicate a reduction in efficiency. This indicates that the design based estimators are only efficient for population that is rare and clustered. The classic-al estimator perform better than the design base estimators (HT and HH estimators) for population 2 which was not rare and clustered.
Example of Fridge Oryx (A Species of Gazelle in Amboseli National Park)
[image:4.595.189.435.512.710.2]The fridge-eared Oryx is a species of the gazelle. It is mostly found in the Amboseli National Park reserve in
Figure 1.The spatial point pattern for a rare population.
0 0.1 0.2 0.3 0.4 0.5 0.6 0.7 0.8 0.9 1
Figure 2. The spatial point pattern for general population.
Table 1.Relative efficiency for rare and clustered population.
N
ACS ACS’
HT
R.E HT
SRS
= R.EHH
HH SRS
= R.EHT
HT SRS
= R.EHH
HH SRS =
20 0.2780 0.8034 0.0963 0.3635
30 0.2683 0.5435 0.1642 0.3246
40 0.2242 0.4206 0.1478 0.2412
50 0.2163 0.2946 0.1326 0.1466
60 0.1733 0.1509 0.0867 0.1211
70 0.1633 0.1372 0.0739 0.1088
80 0.1592 0.1093 0.0604 0.0662
[image:5.595.89.537.510.660.2]90 0.1367 0.0851 0.0458 0.0838
Table 2. Relative efficiency for a general population that is not rare and clustered.
N
ACS ACS’
HT
R.E HT
SRS
= R.EHH
HH SRS
= R.EHT
HT SRS
= R.EHH
HH SRS =
20 2.1604 1.6723 2.781 2.6636
30 2.7464 1.9659 2.4570 2.4736
40 2.3546 2.0001 2.3622 2.3339
50 3.6010 3.5232 2.1110 2.1954
60 3.9401 2.4648 2.2970 2.2682
70 3.6765 3.7524 1.948 1.9059
80 3.4817 3.9153 1.8689 1.7907
90 4.8170 4.1216 1.6294 1.7907
Kenya. The fridge-eared Oryx live in clusters that vary in different sizes. According to the Amboseli National park the species are sparsely distributed in the study of Amboseli National park. The study area was Amboseli- West Kilimanjaro/Magadi-Natorn Landscape covers portions of Southern Kenya and Northern Tanzania be-tween 1˚37' and 3˚13' South and 35˚49' and 38˚00' East. This ecosystem comprises Amboseli and Namanga-
-0.2 0 0.2 0.4 0.6 0.8 1 1.2
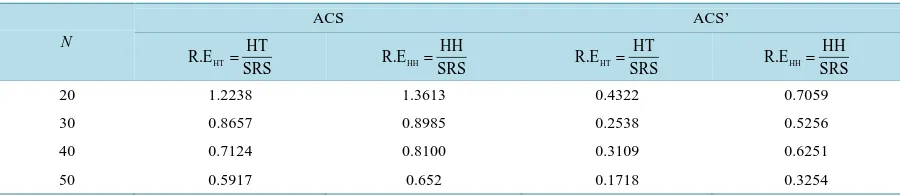
Table 3. Relative efficiency of the fridged-eared Oryx.
N
ACS ACS’
HT
R.E HT
SRS
= R.EHH
HH SRS
= R.EHT
HT SRS
= R.EHH
HH SRS =
20 1.2238 1.3613 0.4322 0.7059
30 0.8657 0.8985 0.2538 0.5256
40 0.7124 0.8100 0.3109 0.6251
50 0.5917 0.652 0.1718 0.3254
Magadi area in southern Kenya, and West Kilimanjaro and Natron in northern Tanzania. The survey covered approximately 24,000 km2 and extended from the foot of Chyulu hills to the east, Arusha National Park to the south, Lake Natron to the west and Lake Magadi to the north. Mt. Kilimanjaro lies to the south eastern boundary of the survey area. For purposes of this census, the survey area has been divided into four broad areas namely: Namanga-Magadi area, Amboseli area, Natron area and West Kilimanjaro area.
The number of initial sample plots was 5. Many of the initial units fell into damage class zero and no adaptive units were added from their neighborhood; however, a total of 56 units were added to the sample. The mean size of the adaptively sampled networks was 11 units of which the largest network had a total of 35 units. The HT, HH and SRS estimators for population mean and variance were calculated for the samples obtained under ACS and ACS’. The relative efficiency of the HT and HH estimators under the ACS and ACS’ designs were obtained and recorded in theTable 3. With the ACS’ there is higher efficiency that the ACS estimators under the same final sample. The HT estimator has higher efficiency by approximately 0.3 than the HH estimator under the ACS’ design. Under the ACS the HT estimator report an efficiency of less than 0.4322 when the final sample is 20 to a relative efficiency of 0.1718 when the final sample is 50. The HH estimator also reports a relative effi-ciency of 0.7059 when the final sample is 20 to 0.3254 when the final sample is 50. This clearly indicates that the relative efficiency of the estimator under the ACS’ increases as the final sample increases. It also indicates that the HT estimator is better in estimation of the rare and clustered population.
5. Conclusions
The efficiency of the adaptive cluster sampling depends on a number of factors. According to [6] it was argued that the efficiency of an adaptive cluster sample is a function of the interaction between the within-network va-riance and final sample size and ultimately depends upon the spatial distribution of the target population.
This study shows that, for different populations, at appropriate sample size and any given condition for adap-tive cluster sample designs, the populations can be sampled more efficiently with both ACS and ACS’. The most importance is to be able to determine what the sample size is, and the condition to adaptively add units to the sample is suitable. The results of this study also indicate that there should be no question that the HT estimator is superior to the HH estimator for use in both ACS and ACS’ settings. Although the HH estimator uses the adap-tively added units to adjust the values of the initially sampled units to network means, it does not explicitly in-corporate any of these additional unit values directly into the estimate.
The choice of condition C is very important. A highly restrictive condition will result in lower final sample sizes and less empty edge units being sampled, but for some populations it may result in little additional infor-mation being added to the sample and the full benefit of an adaptive cluster design may be lost. However, for populations that seem not to exhibit the appropriate level of geographical rarity for the practical implementation of ACS, the choice of a restrictive condition can result in geographically rare networks that will add information and precision to the sample without the danger of an exorbitant final sample size. This study showed that even the smallest change in the condition to adaptively add units to the sample can have strong effects on both the ef-ficiency of ACS and the final size of the sample. A less restrictive condition results in sampling of higher pro-portion of population, but results in final sample size that is much higher and costly to implement. Hence, the choice of the condition C must be made in reference to sampling time, and cost of implementing the study.
References
http://dx.doi.org/10.1002/env.838
[2] Turki, P. and Barkowski, J.J. (2005) A Review of Adaptive Cluster Sampling: 1990-2003. Environmental and Ecolog-ical Statistics, 12, 55-94.http://dx.doi.org/10.1007/s10651-005-6818-0
[3] Thompson, S.K. (1990) Adaptive Cluster Sampling. Journal of American Statistical Association, 85, 1054-1059. http://dx.doi.org/10.1080/01621459.1990.10474975
[4] Noon, B.R., Ishwar, N.M. and Vasudevan, K. (2006) Efficiency of Adaptive Cluster and Random Sampling in Detect-ing Terrestrial Herpetofauna in a Tropical Rainforest. Wildlife Society Bulletin, 34, 59-68.
http://dx.doi.org/10.2193/0091-7648(2006)34[59:EOACAR]2.0.CO;2
[5] Philippi, T. (2005) Adaptive Cluster Sampling for Estimation of Abundances within Local Populations of Low Abun-dance Plants. Ecology, 86, 1091-1100.http://dx.doi.org/10.1890/04-0621
[6] Kenya Wildlife Service (2010) Aerial Total Count: Amboseli-West Kilimanjaro/Magadi-Natron Cross Border Land Scape.
http://www.kws.org/export/sites/kws/info/publications/census_reports/Amboseli_West_kili_Magadi_Natron_2010_ces us_report.pdf
[7] Smith, D.R., Brown, J.A. and Lo, N.C.H. (2004) Application of Adaptive Cluster Sampling to Biological Populations. In: Thompson, W.L., Ed., Sampling Rare or Elusive Species, Island Press, Covelo, 93-152.