Attack Detection over Network based on
C45 and RF Algorithms
Sushil Kumar Chaturvedi
M-tech Research ScholarLNCT,Bhopal
Vineet Richariya
Department of CSELNCT,Bhopal
ABSTRACT
In this paper, Intrusion detection is to detect attacks(Intrusions) against a computer system. In the highly networked modern world, conventional techniques of network security such as cryptography, user authentication and intrusion prevention techniques like firewalls are not sufficient to detect new attacks. In this paper, we perform experiments on the kddcup99 data set. We perform dimensionality reduction of the data set using PCA (principal Component Analysis) and clear distinction between normal and anomalous data is observed by using supervised data mining techniques. Primarily experiments with kddcup99 network data show that the supervised techniques such as Naïve Bayesian, C4.5 can effectively detect anomalous attacks and achieve a low false positive rate. In this thesis optimization technique such as Random Forest has applied to improve the efficiency of detection rate and achieve a low false positive rate. This mechanism can effectively tolerate intrusion.
Keywords-
Data Mining; Naive Bayes Classifier; classification Tree; Anomaly Detection Systems (ADS); PCA, kddcup991.
INTRODUCTION
Data is very vital to an organization. Organizations usually wish to preserve the confidentiality of their data. With the widespread use of the internet, it has become a key challenge to maintain the secrecy and integrity of organization’s vital data. The goal of attack detection is to build a system which would automatically scan network activity and detect such intrusion attacks. Once an attack is detected, the system administrator could be informed and thus take corrective action.Traditional security such as firewall, VPN and data encryption is insufficient to detect against attacks by crackers. However, intrusion detection is a dynamic one, which can give dynamic protection to the network security in monitoring, attack and counterattack [1]. For collecting the data set, Anomaly Detection System (ADS) can be classified as host-based and network-based [2].
Host Based ADS: -these types of systems actually run on the system being monitored. These data come from the records of different host system activities, including appraisal records of OS, system logs, application program information, and so on.
Network Based ADS: -these types of system are placed on the network, near the system or system
being monitored. They examine the network traffic and determine whether it falls within acceptable boundaries. These data come through network segments, such as : Internet packets.
Attack detection techniques are classified into two categories [3]:
1. Anomaly Detection: Anomaly detection refers to storing features of user’s usual behaviors into a database, then comparing user’s current behavior with those in the database. If the deviation is huge enough, we can say that there is something abnormal.
2. Misuse/Signature Detection: Misuse Detection refers to confirming attack incidents by matching features through the attacking feature library.
We decided to use data mining in solving the problem of network attack because of following reasons [1, 4, 5, 6,]:
Data mining can process huge amounts of data.
It is more useful to find out the ignored and hidden information.
Data mining algorithms are used to perform data summarization and visualization that help the security analysis in various areas. [7].
2.
RELATED WORK
K-nearest neighbor (K-NN) classifiers as an intrusion detection model[9]. Mohammadreza Ektefa,Sara Memar,Fatimah Sidi and Lilly Suriani Affendey use C4.5 and SVM(support vector machine) for detecting attacks. They calculate the detection rate (percentage of detecting attacks among all attack data) and false alarm rate (percentage of normal data which is wrongly recognized as an attack) and compare both algorithm result and find C4.5 has better performance than SVM in both detection and false alarm rate[10].
[image:2.595.44.287.188.625.2]3.
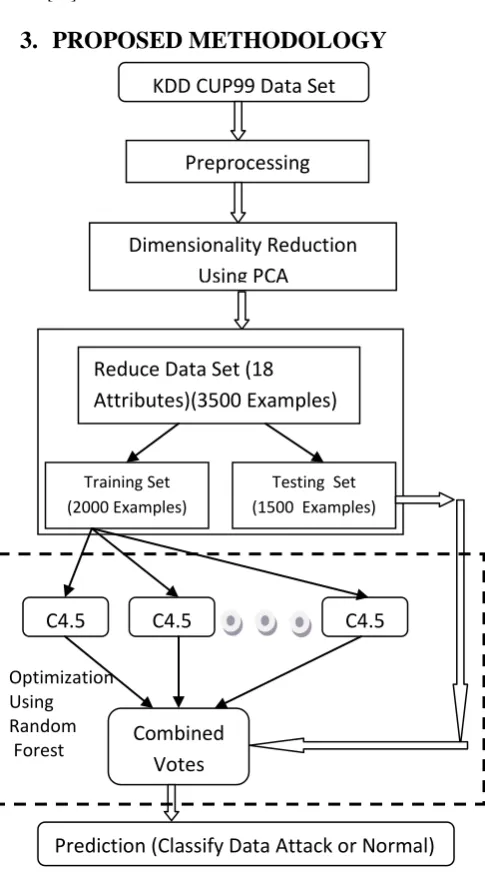
PROPOSED METHODOLOGY
Fig.1 The Complete Proposed Model
In this paper attacks are detected using C4.5 classification algorithm then apply optimization technique such as Random Forest to improve the result of C4.5 algorithm. I have also used PCA (Principal Component analysis) to reduce the dimensionality of datasets required to detect attacks. The feature reduction process can be viewed as a preprocessing step which removes distracting variance from a data set, so that classifiers can perform better and gives better results. In
our proposed algorithm PCA (principal Component Analysis) transform used for dimensionality reduction which is commonly used step, especially when dealing with the high dimensional space of features. PCA-based approaches improve system performances. In this thesis comparison of existing algorithms (Naïve Bayes and C4.5) with proposed Classifier is used to classify any unknown attacks and result of the proposed algorithms is compared with Naïve Bayes and C4.5 to show which one is the best algorithm to classify new kind of attacks.
Following are the steps used in our algorithm:
1. Data preprocessing –Data preprocessing comprises following components including document conversion and feature weighting. The functionality of each component is described as follows:
(a) Dataset prepared with DoS, r2l, u2r and Probe attacks.
(b) Document conversion- converts different types of documents such as gz, Tcpdump to csv file and arff (Attribute-Relation File Format) data file format.
2. Dimensionality Reduction (Feature selection) – It reduces the dimensionality of the data space by removing irrelevant or less relevant feature selection criterion. Principal component Analysis (PCA) is used for dimensionality reduction. The goal of PCA is to reduce the dimensionality of the data while retaining as much as possible of the variation present in the original dataset.
3. Classification using C4.5 Decision Tree algorithm
-Decision Trees (DT) tree learning algorithms work based on processing and deciding upon attributes of the data. Attributes in DT are nodes and each leaf node is representing a classification. C4.5 is an algorithm used to generate a decision tree developed by Ross Quinlan. C4.5 is an extension of Quinlan's earlier ID3 algorithm. The decision trees generated by C4.5 can be used for classification, and for this reason, C4.5 is often referred to as a statistical classifier.C4.5 uses information entropy concept [11]. C4.5 builds decision trees from a set of training data in the same way as ID3, using the concept of information entropy.
4. Optimization Through Random Forest: The random forests [13] is an ensemble of unpruned classification or regression trees. Random forest generates many classification trees. Each tree is constructed from a different bootstrap sample from the original data using a tree classification algorithm (Like C4.5). After the forest is formed, a new object that needs to be classified is put down each of the trees in the forest for classification. Each tree gives a vote that indicates the tree’s decision about the class of the object. The forest chooses the class with the most votes for the object [12].
KDD CUP99 Data Set
Preprocessing
Dimensionality Reduction
Using PCA
Reduce Data Set (18
Attributes)(3500 Examples)
Training Set (2000 Examples)
Testing Set (1500 Examples)
C4.5
C4.5
C4.5
Combined
Votes
Prediction (Classify Data Attack or Normal)
Optimization Using Random4.
CLASSIFIER FOR ATTACK
DETECTION
4.1
Principal Component Analysis(PCA):
PCA is a useful statistical technique that has found application in fields such as face recognition and image compression, and is a common technique for finding patterns in data of high dimension. The entire subject of statistics is based on around the idea that you have this big set of data, and you want to analyze that set terms of the relationships between the individual points in that set [16].
Algorithm:
Suppose x1, x2,……….xm are N x 1 vectors
Step 1: find mean of input matrix
mi i
x
m
x
1
1
Step 2: Normalize data by subtracting mean
y
i
x
i
x
Step 3: find covariance matrix C=cov(y)
Step 4: compute the eigenvectors (V) or eigenvalues (D) of the covariance matrix
[V,D]=eig(C)
Step5: sort eigenvalues in descending order by first diagonalising eigen value matrix, idx stores order to use when ordering eigenvectors.
S
tep6: put eigenvectors in order corresponding with eigen values.Step 7: (dimensionality reduction step) keep only the terms corresponding to the k largest eigenvalues where k=no of dimensions after reduction of data set.
How to choose the principal components:- To choose k, use the following criterion.
) 93 . 89 . . . (
1
1 threshold ego oro
D D
N
i i k
i i
After applying above steps using MATLAB tools. 18 attributes are relevant out of 42 attributes for attack detection. Selected attribute names are Duration,protocol_type, Service, Flag, src_bytes, dst_bytes, logged_in, count, Srv_count, Serror_rate, Same_srv_rate, Diff_srv_rate, Dst_host_count,
Dst_host_same_srv_rate,Dst_host_diff_srv_rate,Dst_host_sa me_src_port_rate,Dst_host_srv_diff_host_rate,Dst_host_serro r_rate.
4.2
Naive Bayesian Classifier(NBC)
Bayesian classifiers are statistical classifiers. They can predict class membership probabilities, such as the probability that a given sample belongs to a particular class. Bayesian classification is based on Bayes theorem. Studies comparing classification algorithms have found a simple Bayesian classifier known as the naïve Bayesian classifier to be comparable in performance with decision tree and neural network classifiers. Bayesian classifiers have also exhibited high accuracy and speed when applied to large databases. [17].
Naïve Bayesian classifiers assume that the effect of an attribute value of a given class is independent of the values of the other attributes. This assumption is called class conditional independence. It is made to simplify the computations involved and, in this sense, is considered “naive”.
Algorithm steps are as follows:-
Input: - Training data samples having attribute set A={A1,A2,…….,An},Unknown data sample X={x1,x2,…….,xn} , suppose there are m classes C= {C1, C2,……,Cn } Output: - Predict the class label of
unknown data sample X.
Step1: calculate prior probability of class label.
S S C
P i
i) (
, where Si is the number of training samples of class Ci , and S is the total number of training samples.
Step2: Compute the probability of unknown data sample with respect to class label.
) | ( ) | (
1 i n
k k
i Px C
C X
P
The probability P(x1|Ci),P(x1|Ci),...,P(xn|Ci) can be estimated from the training samples.
If Ak is categorical then, i ik i k
S S C x P( | )
where Sik is the number of training samples of class Ci having the value xk for Ak , and Si is the number of training samples belonging to Ci .
If Ak is continuous valued, then the attribute is typically assumed to have a Gaussian distribution so that
2 2
2 ) (
,
2 1 ) , ( ) |
( i
i k
c c x
i i
i k i
k e
c c
c x g C x
P
Where
g
(
x
k,
c
i,
c
i)
is the Gaussian(normal) densityfunction for attribute Ak , while
c
i and
c
i are the mean and standard deviation, respectively,given the values for attribute Ak for training samples of class Ci .Step3:- compute P(X|Ci)P(Ci) for each class Ci.
Step4:- Sample X is belong to the class Ci if and only if
) ( ) | ( ) ( ) |
(X Ci PCi P X Cj PCj
P
for
1
j
m
,
j
i
,
Or we can say it is assign to class Ci for which) ( ) | (X Ci PCi P
is the maximum.
4.3
C45(Decision Tree)
C4.5 is a suite of algorithms for classification problems in machine learning and data mining. It is targeted at supervised learning: Given an attribute value data set where instances are described by collections of attributes and belong to one of a set of mutually exclusive classes, C4.5 learns a mapping from attribute values to classes that can be applied to classify new, unseen instances.[21] All tree induction methods begin with a root node that represents the entire, given data set and recursively split the data into smaller subsets by testing for a given attribute of each node. The sub trees denote the partitions of the original dataset that satisfy specified attribute value tests. This process typically continues until the subsets are ‘’pure’’ that is, all instances in the subset fall in the same class, at which time the tree growing is terminated[18]. This algorithm can be used to generate a decision tree that can be used to classify data instances in different classes which helps in further analysis detecting valid results. This algorithm made a number of improvements on ID3 algorithm. These are: It can handle both continuous and discrete attributes. For continuous attributes, it creates a threshold and then splits the list into those whose attribute value is above the threshold and those that are less than or equal to it.
Missing attribute values are simply not used in gain and entropy calculations.
It can handle attributes with different costs. Proposed Algorithm steps are as follows:
Input: an attribute-valued dataset D (after apply Dimensionality reduction method PCA)
1: Tree = {}
2: if D is “pure” OR other stopping criteria met then 3: terminate
4: end if
5: for all attribute a € D do
6: Compute information-theoretic criteria if we split on a 7: end for
8: abest = Best attribute according to above computed criteria
9: Tree = Create a decision node that tests abest in the root 10: Dv = Induced sub-datasets from D based on abest 11: for all Dv do
12: Treev = C4.5(Dv)
13: Attach Treev to the corresponding branch of Tree 14: end for
15: return Tree
4.4
Random Forest(RF)
The main features of the random forests algorithm are listed as follows:
It is unsurpassable in accuracy among the current data mining algorithms.
It runs efficiently on large data sets with many features.
It can give the estimates of what features are important.
It has no nominal data problem and does not over-fit.
It can handle unbalanced data sets.
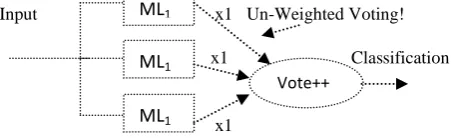
In random forests, there is no need for cross-validation or a test set to get an unbiased estimate of the test error. There are two ways to evaluate the error rate. One is to split the dataset into training part and test part. We can employ the training part to build the forest, and then use the test part to calculate the error rate. Another way is to use the oob error estimate. Because random forests algorithm calculates the oob error during the training phase, we do not need to split the training data. We choose the oob error estimate, since it is more effective by learning from the whole training dataset [13]. Fig.2 below is a visual representation of the un-weighted random forest algorithm.
Input x1 Un-Weighted Voting! x1 Classification
x1
Fig.2 Meta Learner[14]
Random Forest algorithm steps are as follows:
1. Build bootstrapped sample Bi from the original dataset D, where |Bi| = |D| and examples are chosen at random with replacement from D.
2. Construct a tree Ti using Bi as the training dataset using the standard decision tree algorithm(C4.5) with the following modifications:
a) At each node in the tree , restrict the set of candidate attributes to a randomly selected subset (x1, x2, x3, … , xk), where k = no. of features.
b) Do not prune the tree.
3. Repeat steps (1) and (2) for i = 1, … , no. of trees, creating a forest of trees Ti derived from different bootstrap samples.
4. When classifying an example x, aggregate the decisions (votes) over all trees Ti in the forest. If Ti (x) is the class of x as determined by tree Ti , then the predicted class of x is the class that occurs most often
ML1
ML1
ML1
[image:4.595.316.542.452.521.2]in the ensemble, i.e. the class with the majority votes[15].
5.
EXPERIMENTS
In this paper our work is tested using the 1999 KDD cup network anomaly data set [19]. It originated from the 1998 DARPA Intrusion Detection Evaluation Program managed by MIT Lincoln Labs.
The first stage is pre-processing. Data in this phase is reduced to lower dimensionality (18 attributes)then partition into training and testing. In the next step, we applied C4.5 and NBC on the training dataset in order to build and train the models.
Finally trained models are evaluated on the testing dataset to calculate the efficiency of the models.
The training data set consists of seven weeks of traffic with around 5 million connections and the testing data consists of two weeks of traffic with around 300,000 connections. The data contains four main categories of attacks:
Denial-of-service (Dos) such as smurf, apache2, pod, etc.
Remote-to-local (R2L) like imap, worm, phf, etc..
User to root (U2R) such as perl, rootkit and so on.
PROBING such as nmap, portsweep, etc.
Mining algorithms can lead to better results if data under analysis have been normalized [20].
Detection of attack can be measured by following metrics:
False positive (FP): Or false alarm, Corresponds to the number of detected attacks but it is in fact normal.
False negative (FN): Corresponds to the number of detected normal instances but it is actually attack, in other words these attacks are the target of intrusion detection systems.
True positive (TP): Corresponds to the number of detected attacks and it is in fact attack.
[image:5.595.297.561.300.514.2] True negative (TN): Corresponds to the number of detected normal instances and it is actually normal. The accuracy of an intrusion detection system is measured regarding to detection rate and false alarm rate. In this work, we use 1999 KDD cup Dataset which consist of (3500 records). Table 1 given below shows the percentage of the data. Then, 15% of the data is extracted by sampling. 70% of this new set belonged to training set, and 40% dedicated to test data.
Table 1 percentage of data
Attack Name
Quantity (Anomaly)
Percentage( anomaly)
Normal 2,872 82.05
Dos 378 10.80
U2r 46 1.31
Probe 144 4.11
R2l 60 1.71
5.1
Detection rate comparison
Detection rate refers to the percentage of detected attacks among all attack data, and is defined as follows:
Data Attack All
Attack Detected ate
DetectionR
_ _
100
_
OR
TN TP TP ate DetectionR
100
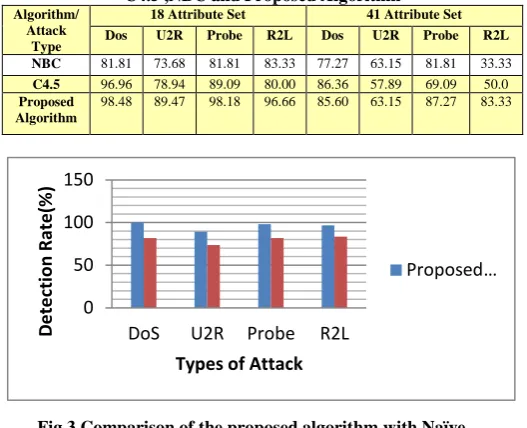
The results of detection rate for different types of attacks are shown in Table 2. As statistical results indicate, the average detection rate for NBC (Naïve Bayes Classifier), C4.5 and Proposed algorithm are 81.35, 91.52 and 97.45 respectively. Furthermore, the detection rate for proposed algorithm is better than NBC and C4.5. For each attack, the proposed algorithm is also better than NBC except R2L attack. It seems it is because of the limited amount of R2L attacks in our data sample.
Table 2
Detection Rate Comparison of Different Attacks Through C4.5 ,NBC and Proposed Algorithm
Algorithm/ Attack
Type
18 Attribute Set 41 Attribute Set Dos U2R Probe R2L Dos U2R Probe R2L
NBC 81.81 73.68 81.81 83.33 77.27 63.15 81.81 33.33
C4.5 96.96 78.94 89.09 80.00 86.36 57.89 69.09 50.0
Proposed Algorithm
98.48 89.47 98.18 96.66 85.60 63.15 87.27 83.33
Fig.3 Comparison of the proposed algorithm with Naïve Bayes Classifier
Fig. 4 Comparison of proposed algorithm with C4.5
5.2
False Alarm Rate Comparison
False alarm rate refers to the percentage of normal data which is wrongly recognized as an attack, and is defined as follows:
FN FP FP Rate FalseAlarm
100
0 50 100 150
DoS U2R Probe R2L
D
e
te
ction
R
ate
(%
)
Types of Attack
Proposed … 0
50 100 150
DoS U2R Probe R2L
D
e
te
ction
R
ate
(%
)
Types of Attack
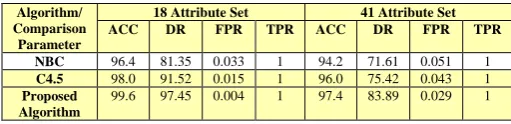
[image:5.595.46.287.620.705.2]The false positive rate in our experiment is 3.38 for NBC, 1.56 for C4.5 and 0.47 for Proposed Algorithm. As the results show, proposed algorithm also performs better in false positive rate than NBC and C4.5.
Table 3 Comaprison of False Positive Rate
Algorithm/ Comparison
Parameter
18 Attribute Set 41 Attribute Set ACC DR FPR TPR ACC DR FPR TPR
NBC 96.4 81.35 0.033 1 94.2 71.61 0.051 1
C4.5 98.0 91.52 0.015 1 96.0 75.42 0.043 1
Proposed Algorithm
99.6 97.45 0.004 1 97.4 83.89 0.029 1
6.
CONCLUSION
If any one try to use the network then detecting attack is an important need in network systems, in this paper data mining techniques namely C4.5 and NBC and RF are used to detect anomaly in the network. Experiment results show, proposed algorithm has better results than NBC and C45 in both detection and false alarm rate in our data set.
There are some challenges faced by the IDS. Like other supervised learning algorithms, the new type of attack cannot be easily discovered by these IDS. If new attack is found in the testing data it is detected as a normal data however, users’ behaviors change from time to time. The static training data might become outdated and deficient for prediction as time goes by. Thus, it suggests a periodic update to the training sets and profiles. This process could be done off-line without affecting the on- line detection system. The accuracy of classification is not 100 percent. Many times normal processes get declared as malicious.
To improve the usability of the IDS, the future work can be done as follows: the algorithm that has features of supervised and unsupervised technique will be developed.by using a supervised technique known type of attacks will be discovered and by using unsupervised technique unknown type or new type attacks will be detected. For dimensionality reduction a hybridized Rough-PCA Approach of Attribute Reduction will be used so high dimensionality of the data set is reduced to lower dimension with most relevant attribute set.
7.
REFERENCES
[1] M. Xue, C. Zhu, "Applied Research on Data Mining Algorithm in Network Intrusion Detection," jcai, pp. 275-277, 2009 International Joint Conference on Artificial Intelligence, 2009.
[2] D. E. Denning, “An intrusion detection model,” IEEE Transaction on Software Engineering, 1987.
[3] T. Bhavani et al., “Data Mining for Security Applications,” Proceedings of the 2008 IEEE/IFIP International Conference on Embedded and Ubiquitous Computing - Volume 02, IEEE Computer Society, 2008. [4] T. Lappas and K. P. ,"Data Mining Techniques for
(Network) Intrusion Detection System," January 2007.
[5] S. Sun, Y. Wang, "A Weighted Support Vector Clustering Algorithm and its Application in Network Intrusion Detection," etcs, vol. 1, pp. 352-355, 2009 First International Workshop on Education Technology and Computer Science, 2009.
[6] S. Wu, E. Yen. “Data mining-based intrusion detectors,” Elsevier Computer Network, 2009.
[7] E. Bloedorn et al, ”Data Mining for Network Intrusion Detection: How to Get Started,” Technical paper, 2001. [8] Dorothy E. Denning. “An Intrusion-Detection Model”
1986 IEEE Computer Society Symposium on Research in Security and Privacy , pp 118-31
[9] M.Govindarajan and RM. Chandrasekaran “Intrusion Detection using K-Nearest Neighbor” ICAC 2009 978-1-4244-4787-9/09 © 2009 IEEE
[10] Mohammadreza Ektefa , Sara Memar, Fatimah Sidi ,Lilly Suriani Affendey “Intrusion Detection Using Data Mining Techniques” 978-1-4244-5651-2/10 © 2010 IEEE.
[11] Michael D. Alder “ An Introduction to Pattern Recognition: Statistical,Neural Net and Synthetic Methods of getting robots to see and hear”, September19,1997http://ciips.ee.uwa.edu.au/mike/PatRe c
[12] J. Zhang, and M. Zulkernine, 2006. A Hybrid Network Intrusion Detection Technique Using Random Forests.In Proceedings of the IEEE First International Conference on Availability, Reliability and Security(ARES’06). [13] L. Breiman, “Random Forests”, Machine Learning
45(1):5–32, 2001.
[14] White, Mark ECE591Q-Machine Learning – Lecture slides, Fall 2005
[15] T.M. Khoshgoftaar, M. Golawala and J. Van Hulse, “An Empirical Study of Learning from Imbalanced Data Using Random Forest." Proceedings of the 19th. IEEE Conference on Tools with Artificial Intelligence. 2007, pp. 310-317.
[16] Nebu Varghese, Vinay Verghese, Prof. Gayathri. P and Dr. N. Jaisankar “A SURVEY OF DIMENSIONALITY REDUCTION AND CLASSIFICATION METHODS” International Journal of Computer Science & Engineering Survey (IJCSES) Vol.3, No.3, June 2012 [17] J. Han, and M. Kamber, “Data mining: concepts and
techniques’”(2nd ed.). Morgan Kaufmann Publishers, 2006.
[18] Naren Ramakrishnan “C4.5” © 2009 by Taylor & Francis Group, LLC 2009.
[19] http://kdd.ics.uci.edu/databases/kddcup99/
[20] J. Han, and M. Kamber, “Data mining: concepts and techniques’” (2nd ed.). Morgan Kaufmann Publishers, 2006.