© 2018, IRJET | Impact Factor value: 6.171 | ISO 9001:2008 Certified Journal
| Page 1593
Identification of Technologies for Improving Logistics Performance
Using Causal Loop Diagram
Dr. Amrita Jhawar
11
Associate Professor, HMR Institute of Technology and Management, New Delhi, India.
---***---Abstract -
In this era of globalization, adoption ofinformation technology (IT) is one of the critical contributing factors of logistics companies’ competitiveness and growth. This paper proposes the investment in IT for improving the logistics performance. Technologies like RFID, EDI, GPS/GIS and ERP are chosen for improving processes like tracking and tracing, planning and forecasting, transportation automation, coordination with suppliers and customers and decision optimization and the effects of investment are discussed in detail using causal loop diagramming approach.
Key Words
:
Causal Loop Diagram, RFID, ERP, EDI, GPS, GIS
1.
Introduction
Logistics is as much about the management and movement of information as it is about management and movement of physical goods. Information is a valuable logistics resource and information technology (IT) plays a very important role
to enhance logistics competitiveness. Logistics
competitiveness is an important factor in determining the competitiveness of nations and industries and to compete in todays’ environment IT tools are a necessity, no matter the size of the organization.
Many studies since 1990s suggests the important role information technology play in enhancing the effectiveness and efficiency of logistics management in a supply chain context. Hammant (1995) suggests that the pressure to invest in information technology is high and will increase with increase in profits and the penalties of under investment or of poorly-thought-through investment is also very high.
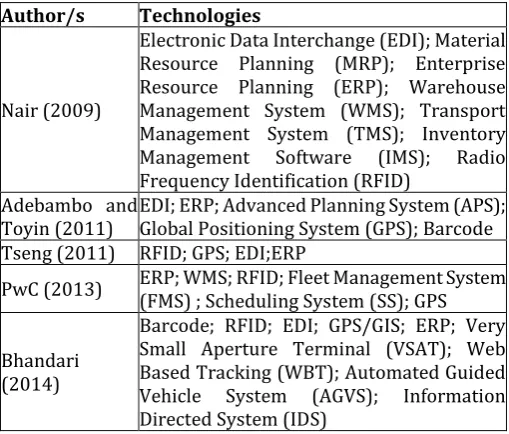
[image:1.595.308.563.214.431.2]Table 1 discusses the various technologies used in the last ten years. EDI and RFID emerged as the two technologies that were addresses most often in SCM literature accounting 32% of all the articles in which IT is the primary focus (Hazen and Byrd, 2012). The other technologies which are used most often are ERP, GPS with Geographic Information System (GIS). Also, these are independent technologies which can be combined with other technologies to get customized solutions. Therefore, the author has selected these four technologies for investment in information technology. For a consistent and superior logistics performance, the need of the hour is that organizations should invest heavily in information technology and make it an integral part of the logistics process. This paper tries to identify technologies for logistics improvement and using causal loop diagram (CLD) explains their effect on logistics performance.
Table-1: Identification of technologies for improving logistics processes
Author/s Technologies
Nair (2009)
Electronic Data Interchange (EDI); Material Resource Planning (MRP); Enterprise Resource Planning (ERP); Warehouse Management System (WMS); Transport Management System (TMS); Inventory Management Software (IMS); Radio Frequency Identification (RFID)
Adebambo and
Toyin (2011) EDI; ERP; Advanced Planning System (APS); Global Positioning System (GPS); Barcode Tseng (2011) RFID; GPS; EDI;ERP
PwC (2013) ERP; WMS; RFID; Fleet Management System (FMS) ; Scheduling System (SS); GPS
Bhandari (2014)
Barcode; RFID; EDI; GPS/GIS; ERP; Very Small Aperture Terminal (VSAT); Web Based Tracking (WBT); Automated Guided Vehicle System (AGVS); Information Directed System (IDS)
1.1 Identification of Technologies for Investment
One of the utmost critical factors of effective logistics service is adequate information technology systems support, which changes the nature of operations performed by logistics organizations. The concept, purpose and numerous benefits which can be achieved by adopting these technologies is discussed as follows.
a. RFID
It is a term used for technologies utilizing radio waves for identifying individual items automatically and is designed to track items in the supply chain without requiring a line of sight (Mehrjerdi, 2010). It is an automatic identification method to keep track and trace of moving objects within the logistics network (Lee et al., 2011). It is used in the planning and operation of supply chain processes in the manufacturing, distribution and retail industries, and has helped move its adoption into services such as security and access control, tracking, monitoring, and management (Cheung et al., 2008). Walmart believes RFID system can help in reducing labour costs, inventory costs, reduce human errors, increasing revenues by limiting shortages, increasing overall efficiency and productivity of the supply chain (Mehrjerdi, 2013).
© 2018, IRJET | Impact Factor value: 6.171 | ISO 9001:2008 Certified Journal
| Page 1594
It is defined as the business to business transfer of repetitive business processes involving direct routing of information from one computer to another without human interference, according to predefined information formats and rules (Hazen and Byrd, 2012). It enhances efficient coordination of logistics systems and facilitates logistical integration (Larson and Kulchitsky, 1998). The main advantages of using EDI are to enter only informative needs on the computer system once, and then it is able to speed of transaction and to reduce cost and error rates, better customer service, reduced paper work, increased productivity, improved tracing and expediting, cost efficiency and improved billing (Nair, 2009).
c. GPS/GIS
GPS/GIS provide the service of vehicles positioning. It could help the control centres to monitor and dispatch trucks. GPS/GIS technology has provided major breakthroughs in transportation management by vehicle tracking, determination of speed and waiting time (Prasanna and Hemalatha, 2012). It increases service quality, relevance of information, traceability of products and also improves productivity (Saidi and Hammami, 2011).
d. ERP
ERP systems are software packages that integrate a number of business processes, such as manufacturing, supply chain, sales, finance, human resources, budgeting and customer service activities (Schniederjans, 2013). ERP is generally referred to as a cutting edge information technology that helps the firm coordinate and integrate company-wide
business processes including sales, marketing,
manufacturing, logistics, purchasing, accounting, and human resources management using a common database and shared management reporting tools (Hwang, 2013). The most significant benefits are cycle time reduction, faster information transactions, better financial management, laying the groundwork for electronic commerce, making tacit process knowledge explicit (transferring knowledge from an aging workforce into the ES) (Adebambo and Toyin, 2011).
1.2 METHODOLOGY
The causal loop diagram in system dynamics focuses on the structure and behaviour of the systems composed of interacting feedback loops (Kiani et al., 2009). It is an important tool which helps the modeller to conceptualize the real-world system in terms of feedback loops (Sachan et al., 2004). It is a very effective systems thinking tool which shows relationships between variables and also help to convert mental model into systems model. Variables are connected to each other with the help of arrows, to which polarity either negative or positive is assigned. A positive sign ‘+’ means that if the cause increases or decreases, then the effect will also increase or decrease in the same direction. It is also known as reinforcing loop, which is denoted by ‘R’. A negative sign ‘-’ means that if the cause
increases or decreases, then the effect will increase or decrease in the opposite direction. It is also known as balancing loop, which is denoted by ‘B’.
In other words, the arrows indicate the direction of influence, and the plus or minus sign the type of influence. All other things being equal, if a change in one variable generates a change in the same direction in the second variable, relative to its prior value, the relationship between the two variables is referred to as positive and the loop is known as reinforcing loop. If the change in the second variable takes place in the opposite direction, the relationship is negative and the loop is known as balancing loop.
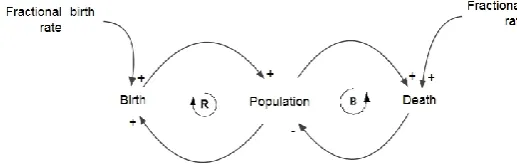
Fig -1: Causal Loop Diagram of Population Model
For example, figure 1 shows a causal loop model for a simple population model. As the number of birth increases, the population will increase. The increase in population will leads to further increase in the number of births, as more people are available for reproduction. Therefore, the loop between birth and population is reinforcing loop. Now, as population increases, death will also increase and an increase in death will reduce the population. Therefore, the loop between population and death is balancing loop. Fractional birth rate represents the number of births that occur per unit population per unit time and fractional death rate represents the number of deaths that occur per unit population per unit time. Both are exogenous variables.
2.1 Causal Loop Diagram for Investment in IT
a. RFID
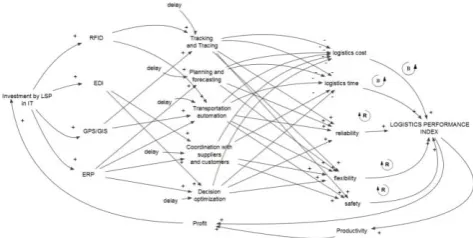
RFID will help in tracking and tracing of pallets and shipments (Cheung et al., 2008); reduce amount of potential error and diminishes losses (Ginters and Martin-Gutierrez, 2013); enhances speed and accuracy (Bhandari, 2014); improvement in responsiveness; lean and agile logistics workflow (Lee et al., 2011); helps in order fulfilment and efficient WMS leading to reduction in cost, reduction in time and improvement in safety (Mehrjerdi, 2013). Therefore from figure 2, the loop between investment in IT by LSP, RFID, tracking and tracing, logistics cost/ logistics time, LPI, productivity and profit are balancing loops and the loop between investment in IT by LSP, RFID, tracking and tracing, safety/reliability/flexibility, LPI, productivity and profit are reinforcing loops.
[image:2.595.307.566.257.340.2]© 2018, IRJET | Impact Factor value: 6.171 | ISO 9001:2008 Certified Journal
| Page 1595
2008) leading to transportation automation is efficient fleet management system which can be created by integrating RFID with ERP (PwC, 2013). Thus, the loop between investment in IT by LSP, RFID and ERP, transportation automation, logistics time, LPI, productivity and profit is a balancing loop and the loop between investment in IT by LSP, RFID and ERP, transportation automation, reliability, LPI, productivity and profit is a reinforcing loop.
b. EDI
[image:3.595.58.295.449.568.2]EDI can be defined as the computer to computer exchange of business information electronically in a structured format between business trading partners (Murphy, 1998). It helps companies to exchange commercial documents without human intervention (PwC, 2013). It enhances efficient coordination (Larson and Kulchitsky, 1998), which enhances decision making and communication felicitating better planning and forecasting leading to reduction in cost (Lewis, 2004), reduction in error, improvement in transaction, speed, better customer service and achieving cost efficiency (Nair et al., 2009); improvement in flexibility (Hazen and Byrd, 2012). Therefore the loop between investments in IT, EDI, coordination with suppliers and customers/ decision optimization, logistics cost/ logistics time, LPI, productivity, profit and investment in IT by LSP are balancing loops. Also, the loop between investment in IT, EDI, coordination with suppliers and customers/ decision optimization, reliability/flexibility/safety, LPI, productivity, profit and investment in IT by LSP is reinforcing loop.
Fig -2: Causal loop diagram for investment in IT its effect on LPI
c. GPS and GIS
GPS device transmits data on the status of the vehicle including its position, speed and direction helping MNCs to detect the exact position of a vehicle anywhere in the world (Saidi and Hammami, 2011). GIS store information such as maximum speed on certain roads, maximum allowed height due to bridges and ducts, allowed axle weight, driving directions, etc. in digital maps (Steffanson, 2009). GPS and GIS helps in supporting route scheduling and visualization (Hu and Sheng, 2014) leading to transportation automation and tracking and tracing. GPS tracking and IT enabling of vehicles no doubt will help in tracking, but tracking the
welfare of human being who do this arduous work is undoubted more critical (Sethi, 2013). Use of GPS and GIS with RFID will lead to reduction in cost, delivery time and errors; vehicle and driver management; efficient warehouse management; improvement in delivery reliability (Steffanson, 2009) and unlimited flexibility (Jones, 2010). The loop between investment in IT, GPS/GIS, tracking and tracing/ transportation automation, logistics cost/ logistics time, LPI, productivity, profit and investment in IT by LSP are balancing loops. Also, the loop between investment in IT, GPS/GIS, tracking and tracing/ transportation automation, reliability/flexibility/safety, LPI, productivity, profit and investment in IT by LSP are reinforcing loops.
d. ERP
ERP improves operational decision making (Reddy, 2012), coordination, better planning and forecasting (Razi, 2003) leading to reduction in cost (Burca, 2005); reduction in cycle time (Yang, 2009), reduction in uncertainty (Lewis, 2004) leading to improvement in reliability and improvement in responsiveness (Closs, 2003) leading to improvement in flexibility and improvement in safety due to the reduced opportunity for human error. Therefore the loop between investment in IT, ERP, planning and forecasting/ coordination with suppliers and customers/ decision optimization, logistics cost/ logistics time, LPI, productivity, profit and investment in IT by LSP are balancing loops. Also, the loop between investment in IT, ERP, planning and forecasting/ coordination with suppliers and customers/ decision optimization, reliability/flexibility/safety, LPI, productivity, profit and investment in IT by LSP are reinforcing loops.
3. CONCLUSIONS
© 2018, IRJET | Impact Factor value: 6.171 | ISO 9001:2008 Certified Journal
| Page 1596
REFERENCES
1. S. Adebambo and A. Toyin, “Analysis of Information and
Communication Technologies (ICT) Usage on Logistics Activities of Manufacturing Companies in Southwestern Nigeria”, Journal of Emerging Trends in Economics and Management Sciences (JETEMS), Vol. 2, No. 1, 2011, pp. 68-74.
2. R. Bhandari, “Impact of Technology on Logistics and Supply Chain Management”, IOSR Journal of Business
and Management, 2014, http://www
.iosrjournals.org/iosr-jbm/papers/7th-ibrc-volume-2/17.pdf Accessed 10 July 2014
3. S. Burca, B. Fyne and and D. Marshall, “Strategic
technology adoption: extending ERP across the supply chain”, The Journal of Enterprise Information Management, Vol. 18, no. 4, 2005, pp. 427-440.
4. Y. Cheung, K. Choy and W. Lau, “The Impact of RFID Technology on the Formulation of Logistics Strategy”, PICMET Proceedings, Cape Town, 2008, pp. 1673-1680.
5. D. Closs and K. Savitskie, “Internal and External Logistics Information Technology Integration”, International Journal of Logistics Management, Vol. 14, No. 1, 2003, pp. 63-76.
6. E. Ginters and J. Martin-Gutierrez, “Low cost augmented
reality and RFID application for logistics items visualization”, Procedia Computer Science, Vol. 26, 2013, pp. 3-13.
7. J. Hammant, “Information technology trends in logistics”,
Logistics Information Management, Vol.8, No. 6, 1995, pp. 32-37.
8. B. Hazen and T. Byrd “Toward creating competitive
advantage with logistics information technology”, International Journal of Physical Distribution & Logistics Management, Vol. 42, No. 1, 2012, 8-35.
9. Z. Hu and Z. Sheng “A decision support system for public
logistics information service management and optimization”, Decision Support Systems, Vol. 59, 2014, pp. 219-229.
10. W. Hwang and H. Min (2013) “Assessing the impact of
ERP on supplier performance”, Industrial Management & Data Systems, Vol. 113, No. 7, 2013, pp. 1025 – 1047.
11. E. Jones and C. Chung “RFID in logistics: a practical introduction”, CRC press, 2010.
12. B. Kiani et al. “System dynamics approach to analysing
the cost factors effects on cost of quality”, International
Journal of Quality & Reliability Management, Vol. 26, No.7, 2009, pp. 685-698.
13. P. Larson and J. Kulchitsky, “Logistics improvement programs the dynamics between people and performance”, International Journal of Physical Distribution & Logistics Management, Vol. 29, No. 2, 1998, pp. 88-102.
14. C. Lee, W. Ho, G. Ho and H. Lau “Design and development
of logistics workflow systems for management with RFID”, Expert Systems with Applications, Vol. 38, 2011, pp. 5428-5437.
15. I. Lewis and A. Talalayevsky, “Improving the
interorganizational supply chain through optimization of information flows”, The Journal of Enterprise Information Management, Vol. 17, No. 3, 2004, pp. 229-237.
16. Z. Mehrjerdi, “Coupling RFID with supply chain to
enhance productivity”, Business Strategies Series, Vol. 11, No. 2, 2010, pp. 107-123.
17. Z. Mehrjerdi “A framework for Six-Sigma driven
RFID-enabled supply chain systems”, International Journal of Quality & Reliability Management, Vol. 30, No. 2, 2013, pp. 142 - 160.
18. P. Murphy and J. Daley, “EDI benefits and barriers comparing international freight forwarders and their customers”, International Journal of Physical Distribution & Logistics Management, Vol. 29, No. 3, 1998, pp. 207-216.
19. P. Nair, R. Venkitaswamy and S. Anbudayashankar,
“Overview of Information Technology Tools for Supply Chain Management”, CSI Communications, Vol. 33, No. 9, 2009, pp. 20-27.
20. E. W.T. Ngai, K.L.K Moon, F.J. Riggins and C.Y. Yi, “RFID research: An academic literature review (1995 -2005) and future research directions”, International Journal of Production Economics, Vol. 112, 2008, pp. 510-520.
21. K. Prasanna and M. Hemalatha, “RFID GPS and GSM based logistics vehicle load balancing and tracking mechanism”, Procedia Engineering, Vol. 30, 2012, pp. 726-729.
22. PwC, “Leveraging IT Transforming the T&L sector”, http://www.pwc.in/en_IN/in/assets/pdfs/publications /2013/it-print.pdf. 2013.
23. M. Razi and M. Tarn, “An applied model for improving
© 2018, IRJET | Impact Factor value: 6.171 | ISO 9001:2008 Certified Journal
| Page 1597
24. M. Reddy, “Status of supply chain management in
India”, International Journal of Emerging Technology and Advanced Engineering, Vol. 2, No. 7, 2012, pp. 429-432.
25. A. Sachan, B. Sahay and D. Sharma, “Developing Indian
grain supply chain cost model: a system dynamics approach”, International Journal of Productivity and Performance Management, Vol. 54, No. 3, 2004, pp. 187-205.
26. S. Saidi and S. Hammami, “The role of transport and logistics to attract foreign direct investment in the developing countries”, Logistics (LOGISTIQUA) 4th International Conference on IEEE, 2011.
27. D. Schniederjans and S. Yadav, “Successful ERP
implementation: an integrative model”, Business Process Management Journal, Vol. 19, No. 2, 2013, pp. 364 – 398.
28. J. Sethi, “Supply Chain 2020”, Flash Drive,
https://www.mycii.in/KmResourceApplication/40789. FinalFlashDriveEdition12013.pdf 2013.
29. G. Stefansson and K. Lumsden, “Performance issues of
Smart Transportation Management systems”,
International Journal of Productivity and Performance Management, Vol. 58, No.1, 2009, pp. 54-70.
30. Y. Tseng, W. L. Yue and M.A.P. Taylor, “The Role of Transportation in Logistics Chain”, Proceedings of the Eastern Asia Society for Transportation Studies, Vol. 5, 2005, pp. 1657 - 1672.
31. C. Yang and Y. Su, “The relationship between benefits of