Open Access
Research article
Responsiveness and minimal clinically important difference for pain
and disability instruments in low back pain patients
Henrik H Lauridsen*
1, Jan Hartvigsen
1,2, Claus Manniche
1,3,
Lars Korsholm
1,4and Niels Grunnet-Nilsson
1Address: 1Clinical Locomotion Science, Institute of Sports Science and Clinical Biomechanics, University of Southern Denmark, Odense, Denmark, 2Nordic Institute of Chiropractic and Clinical Biomechanics, Odense, Denmark, 3Backcenter Funen, Ringe, Denmark and 4Department of Statistics, University of Southern Denmark, Odense, Denmark
Email: Henrik H Lauridsen* - hlauridsen@health.sdu.dk; Jan Hartvigsen - j.hartvigsen@nikkb.dk; Claus Manniche - clma@shf.fyns-amt.dk; Lars Korsholm - korsholm@stat.sdu.dk; Niels Grunnet-Nilsson - nnilsson@health.sdu.dk
* Corresponding author
Abstract
Background: The choice of an evaluative instrument has been hampered by the lack of head-to-head comparisons of responsiveness and the minimal clinically important difference (MCID) in subpopulations of low back pain (LBP). The objective of this study was to concurrently compare responsiveness and MCID for commonly used pain scales and functional instruments in four subpopulations of LBP patients.
Methods: The Danish versions of the Oswestry Disability Index (ODI), the 23-item Roland Morris Disability Questionnaire (RMQ), the physical function and bodily pain subscales of the SF36, the Low Back Pain Rating Scale (LBPRS) and a numerical rating scale for pain (0–10) were completed by 191 patients from the primary and secondary sectors of the Danish health care system. Clinical change was estimated using a 7-point transition question and a numeric rating scale for importance. Responsiveness was operationalised using standardardised response mean (SRM), area under the receiver operating characteristic curve (ROC), and cut-point analysis. Subpopulation analyses were carried out on primary and secondary sector patients with LBP only or leg pain +/- LBP.
Results: RMQ was the most responsive instrument in primary and secondary sector patients with LBP only (SRM = 0.5–1.4; ROC = 0.75–0.94) whereas ODI and RMQ showed almost similar responsiveness in primary and secondary sector patients with leg pain (ODI: SRM = 0.4–0.9; ROC = 0.76–0.89; RMQ: SRM = 0.3–0.9; ROC = 0.72–0.88). In improved patients, the RMQ was more responsive in primary and secondary sector patients and LBP only patients (SRM = 1.3–1.7) while the RMQ and ODI were equally responsive in leg pain patients (SRM = 1.3 and 1.2 respectively). All pain measures demonstrated almost equal responsiveness. The MCID increased with increasing baseline score in primary sector and LBP only patients but was only marginally affected by patient entry point and pain location. The MCID of the percentage change score remained constant for the ODI (51%) and RMQ (38%) specifically and differed in the subpopulations.
Conclusion: RMQ is suitable for measuring change in LBP only patients and both ODI and RMQ are suitable for leg pain patients irrespectively of patient entry point. The MCID is baseline score dependent but only in certain subpopulations. Relative change measured using the ODI and RMQ was not affected by baseline score when patients quantified an important improvement.
Published: 25 October 2006
BMC Musculoskeletal Disorders 2006, 7:82 doi:10.1186/1471-2474-7-82
Received: 15 May 2006 Accepted: 25 October 2006
This article is available from: http://www.biomedcentral.com/1471-2474/7/82
© 2006 Lauridsen et al; licensee BioMed Central Ltd.
Background
As clinicians and researchers we often wish to address change in a patient's condition as a result of an interven-tion or to distinguish individual differences in response to treatment [1]. A prerequisite for this is measurement tools that accurately assess function and monitor change over time. Standardised self-report questionnaires provide such tools and are convenient for collecting large amounts of information on for instance pain and activity limita-tion. Apparently similar and well-validated back-specific questionnaires have emerged over the last decade making the choice of a proper instrument for a given situation challenging [2-5]. Criteria for instrument selection have often been based on whether a particular questionnaire is reliable and valid with respect to the patient population in question but this is changing. Many authors now advocate that the property of responsiveness, defined as the ability of an instrument to detect clinically relevant change over time, is equally or even more important in the choice of an evaluative instrument [6-11]. As a consequence, no less than 31 indices have been developed and reported in the literature making both the choice of an index and compar-isons between indices confusing and difficult [12].
Several approaches to classifying clinically meaningful change (responsiveness) have been proposed based on study design and the construct of change being quantified [11-16]. One such approach is the differentiation between distribution-based and anchor-based methods, the former including those based on sample variability and measurement precision. The anchor-based methods, on the other hand, include both cross-sectional and longitu-dinal designs which link the instrument change to a meaningful external anchor [17]. In the longitudinal designs the concept of "minimal clinically important dif-ference" (MCID) has been introduced in an effort to define what is the smallest meaningful change score [11,18,19]. These methods have advantages and limita-tions and many authors propose to use both approaches [17,19,20].
Apart from the type of responsiveness index, other factors affect the size of the responsiveness index such as type of intervention, patient population under study, and timing of data collection [17,21,22]. Therefore head-to-head comparisons of responsiveness in low back pain (LBP) specific instruments in different study settings and in dif-ferent subpopulations of back pain patients are of para-mount importance. A literature search revealed that head-to-head comparisons has been made for 1) a general LBP population [23-30] 2), a general LBP population in rela-tion to baseline entry scores [8,31-33], 3) specific subpop-ulations of back pain patients [34-36], 4) condition-specific vs. generic/patient-condition-specific questionnaires [37-41], 5) different external criteria (anchors) [34,42], 6)
pain, disability and physical impairment indices [43], and lastly as part of an instrument validation study [44-55]. Thus, concurrent comparisons of responsiveness in sub-populations of LBP patients are warranted, and to the authors' knowledge no head-to-head responsiveness assessment of LBP only versus leg pain (defined as leg pain with or without LBP) and primary sector (PrS) patients versus secondary sector (SeS) patients have been carried out.
The purpose of this study was therefore twofold: 1) to determine and compare the responsiveness of four fre-quently used functional status questionnaires and three pain scales when applied to four different subpopulations of low back pain patients, and 2) to determine MCID using optimal cut-points for each instrument and its dependency on baseline entry score, pain location and patient entry point.
Methods
The study was not reported to the local ethics committee as this is not required according to the rules and regula-tions of the Danish scientific ethical committee. However, the study was reported to and accepted by The Danish Data Protection Agency.
Study Population
This study is a secondary analysis of data from a large val-idation study of the Oswestry Disability Index in Danish [56,57]. Patients from the primary sector (7 chiropractic practices) and secondary sector (an out-patient hospital back pain clinic) of the Danish health care system were recruited. In Denmark 1/3 of the LBP patients who contact a health care practitioner for treatment are seen by a chi-ropractor where they receive standard active and passive conservative care. These patients are comparable to patients seen by medical doctors and physiotherapists [58]. The patients seen in the out-patient hospital back pain clinic represent a broad range of chronic LBP patients with or without leg pain who have not responded to treat-ment in the primary sector. These patients received multi-disciplinary evaluation and treatment. Inclusion criteria were: 1) age above 18, 2) presence of low back pain and/ or leg pain, and 3) able to read and understand Danish. Patients were excluded if a pathological disorder of the spine was suspected (e.g., fractures, spinal infections, malignancy or inflammatory diseases). All patients received oral and written information about the project and gave their informed consent to participate in the study.
Design
con-taining sociodemographic data, medical status and out-come measures was administered to all patients. Responders at the eight weeks follow-up received a tele-phone interview 3–5 days after (week nine) by a specially trained professional interviewer from the Danish National Institute of Social Research. The purpose of the telephone interview was to obtain patient ratings of improvement/deterioration and the importance of such change. A detailed description of the study design can be found elsewhere [56].
Variables
The Oswestry Disability Index (ODI) version 2.1 is a self-administered questionnaire measuring "back-specific function" with reference to "today" on a 10 item scale with six response categories each. Each item scores from 0 to 5 and the score is subsequently transformed into 0–100 [2,59,60,60].
The 23-item version of the Roland Morris Disability Questionnaire (RMQ) was developed specifically to tar-get LBP patients with radicular symptoms and is a modifi-cation of the original RMQ [61]. We chose the 23-item version instead of the original 24-item version [62] for two reasons: 1) the 23-item version has been cross-cultur-ally validated in Danish whereas the 24-item version has not, and 2) the psychometric properties of the two ver-sions have been shown to be similar [63]. Each item is scaled as yes/no (scored as 1 and 0 points respectively) with the scale ranging from 0 (no disability) to 23 (extremely severe disability).
The Low Back Pain Rating Scale (LBPRS) was developed to measure the dimensions of pain, disability and physi-cal impairment for patients with LBP [64]. The pain assessment index (LBPRSpain) is measured on 0 to 10 numerical scales with 0 representing no pain and 10 rep-resenting worst possible pain. There were three 11-box numeric rating scales (pain now, worst and average pain in the last 2 weeks) for back pain and leg pain separately. Each response scale score is added giving a scale range of 0–60 points. The disability index (LBPRSdisability) com-prises 15 items scaled as yes = 0 points, can be a problem = 1 points, no = 2 points, giving a total score of 0–30 points.
The SF36 is a generic 36-item questionnaire compiled from the Rand Health Insurance Long Form Health Status Scale [65]. Of the eight dimensions, we included the phys-ical function (SF36 (pf)) and the bodily pain (SF36 (bp)) subscales. Questions are framed over a one-week period with response scales varying from dichotomous (yes/no) to six-point verbal rating scales. Each dimension is scored on a weighted 0–100 scale and an overall score is recom-mended [66].
Back and/or leg pain was scored on an 11-box numeric rating scale (pain now) from 0 (no pain) to 10 (worst pos-sible pain) [67,68].
The patients' global retrospective assessment of treat-ment effect (transition question) was used to assess the patients' perception of their overall change in their back condition. A 7-point Likert scale transition question (TQ) ranging from "much better" to "much worse" was used [69]. Furthermore, the importance of the change in health state experienced was measured. All patients were asked to rate the question: "How important is the change you have experienced in your back and/or leg pain since the start of the treatment?" on a 0 – 10 numeric rating scale (NRSimp) with "very important" and "not at all important" at the extremes.
This information was collected by telephone interviews which followed a carefully planned protocol. First, all patients were told their baseline global rating of pain severity (NRSpain) before answering the TQ to ensure opti-mal patient focus on the change in health rather than the present health state [70,71]. Second, the transition ques-tion with response opques-tions was read twice. In case the patient was uncertain of which response to choose, the interviewer determined whether the patient was either better, had not changed or worse. If the interviewer decided that the patient was better the categories for being improved was read again ("much better", "better", "a little better") and similar for patients classified as worse.
All the included disability instruments have been cross-culturally adapted and validated in Danish [56,57,64,72-75]. For a complete description of the psychometric prop-erties of each instrument we refer the reader to relevant lit-erature reviews [2-4,60,76-78].
Subpopulations
Statistical Analyses
All scales were transformed to cover an interval ranging from 0 – 100 with a high score representing higher disa-bility or pain. This makes instruments with different scor-ing intervals comparable despite the fact that they are not equivalent. The raw change score for each outcome meas-ure was obtained by subtracting the eight weeks follow-up score from the baseline score. The percentage change score was calculated as follows: [Raw change score/baseline score]*100 [80].
Responsiveness was operationalised using two strategies; standardised response mean of the raw change scores (dis-tribution-based method) and receiver operating character-istic (ROC) curves (anchor-based method). The standardised response mean of the raw change scores (SRMraw) was restricted to patients who had changed and calculated as the ratio of the mean raw change score and the standard deviation of that raw change score [17,81,82]. Confidence intervals for the SRMraw were
esti-mated using 200,000 bootstrap samples with replacement [83]. To compare the SRMraw of the different question-naires within each subpopulation, we first estimated the SRMraw using stata's regression command with group indi-cators and the cluster option to account for intra individ-ual correlation between responses. The differences between SMRraw were examined with a non-linear Wald test [84]. The same procedure was used to test the differ-ence between "important improvement" and "no change" groups within each subpopulation.
SRMraw was calculated for all instruments change scores according to where the patients were seen, pain location and whether the patients had experienced an "important improvement" or "no change" (see ROC analyses). The SRMraw for the "important improvement" group addresses the sensitivity to change. On the other hand, the SRMraw for the "no change" patients addresses the important issue of specificity to change where change without clinical rel-evance may occur in instrument scores.
In the second strategy we used ROC curve analyses to determine sensitivity and specificity for classifying patients as having experienced an "important ment" or "no change" and defined "important improve-ment" patients from two criteria: 1) had to rate themselves as either "much better" or "better" on the TQ, and 2) had to rate the importance of the change on NRSimp equal to or more than 7. The "no change" patients rated them-selves as either "a little better", "about the same" or "a lit-tle worse" or with a rating of the importance of the change less than 7. Because of the low number of patients (n = 13) reporting deterioration, a "worse" sample was not included. The ROC curve is the sensitivity plotted against 1-specificity (false-positive rate) and shows the trade-off
between the true-positive successes and the false-positive errors as each of several cut-off points in the change score is assessed [7,85,86]. The area under the ROC curve (ROCauc) can be interpreted as the ability of an instrument to discriminate between "important improvement" and "no change" patients. An area of 0.5 is interpreted as no discriminatory accuracy and 1.0 as complete accuracy [87]. An omnibus statistical comparison of the area under the ROC curve within each subpopulation was carried out using a non-parametric approach as described by DeLong et al. [88].
The MCID was determined by an optimal cut-point anal-ysis using both the raw (MCID) and percentage (MCID%) change scores. The optimal cut-off change score was iden-tified as the cut-point with equally balanced sensitivity and specificity [89] and this was considered an expression of the MCID. First, we calculated overall MCIDs, quarter-specific MCIDs by dividing the scale range into four equally sized score groups [17,32], and MCIDs specific for pain location and patient entry point. Categories with less than 10 patients were excluded from the analysis.
Second, ODI and RMQ quarter-specific MCID% were graphed for each subpopulation. Third, we adjusted the dependence of the MCID on the baseline score by a weighted linear regression. As the number of patients in each baseline score strata was different the regression was weighted by the number of persons used to detect each cut-point (all patients only).
All statistical calculations were analysed using the statisti-cal package STATA® v. 9.2 SE (StataCorp) and statistical
significance was accepted at the P < 0.05 level.
Results
Two-hundred-and-thirty-three patients with low back pain and/or leg pain were entered at baseline. At 8-weeks follow-up the response rate was 82% leaving 191 patients for analyses (PrS = 94, SeS = 97). Age and sex distributions were similar in the two patient populations and patients from the PrS had mostly low back pain only, shorter dura-tion of the current LBP episode and used less medicadura-tion compared to SeS patients. Three out of 4 disability ques-tionnaires demonstrated significantly higher disability in the SeS patients whereas 2 out of 3 pain measures showed no difference in pain intensity levels between the two groups (Table 1).
Distribution-based responsiveness
raw change scores to original scale scores please refer to Table 3.
The RMQ proved to be the most responsive disability measure for patients with LBP only (both PrS and SeS samples) and this was statistically significantly different from the other disability measures in the PrS patients (P < 0.001). For patients with leg pain the ODI and RMQ was equally responsive in PrS patients (P = 0.2) as was the case between the disability measures in the SeS patients. Of the 3 pain measures, the SF36 (bp) had the highest respon-siveness in all subpopulations. This was statistically signif-icant in the LBP only subgroup for both PrS and SeS patients (P < 0.002).
Anchor-based responsiveness
Important improvement vs. no change
The proportion of patients reporting an "important improvement" was statistically higher in PrS compared to SeS patients (77% vs. 23%, P < 0.001) and in patients with LBP only compared to leg pain patients (71% vs. 29%, P < 0.001). The "important improvement" and "no change" groups had similar baseline scores except for a signifi-cantly higher mean baseline score in the improved group
for: 1) RMQ in SeS patients (P = 0.04), 2) LBPRSpain (P = 0.04) and NRSpain (P = 0.01) in patients with leg pain.
The mean raw change scores between the "important improvement" and "no change" groups showed a signifi-cant difference for all instruments except for SF36 (pf) in leg pain patients and LBPRSdisability in PrS and leg pain patients (data not shown).
[image:5.612.58.554.103.401.2]The SRMraw for patients reporting an "important improve-ment" and patients reporting "no change" are shown in Table 4. In general, moderate to large SRMraw (0.7 – 2.1) were found in the "important improvement" group regardless of entry point (PrS or SeS) and pain location. As expected this was somewhat smaller in the "no change" group (0.2 – 0.9). The RMQ showed the largest difference in SRMraw between the "important improvement" and "no change" groups in all subpopulations when compared to the other disability measures. For the pain measures, the SF36 (bp) demonstrated the largest difference in all sub-populations except the leg pain +/- LBP patients where it was equal to the NRSpain.
Table 1: Baseline descriptive data for the two study populations.
Study population
Characteristic Primary sector patients (n = 94) Secondary sector patients (n = 97) Age, mean (min., max.) 44 (18–76) 47 (20–85)
Sex, n (%)
Male 44 (47) 45 (46) Female 50 (53) 52 (54) Pain location, n (%)
Low back only* 70 (75) 28 (29) Leg pain (+/- LBP) 24 (25) 69 (71) Duration of current problem, n (%)
≤ 30 days 69 (73) 12 (12) > 30 days 23 (24) 79 (81) Missing 2 (2) 6 (6) Use of pain medication†, n (%)
≤ a couple of times a week 59 (63) 39 (40) > a couple of times a week 33 (35) 58 (60)
Missing 2 (2)
-Disability at baseline 0–100 scale, mean (SD)
ODI 27.4 (16.2) 33.7 (14.5) ‡ RMQ 40.3 (18.5) 45.2 (16.3) LBPRSdisability 33.6 (17.8) 45.2 (17.8) ‡
SF36 (pf) 34.9 (25.0) 45.7 (20.3) ‡ Pain at baseline, 0–100 scale (mean, SD)
LBPRSpain 37.4 (21.1) 47.7 (22.5) ‡ SF36 (bp) 64.9 (20.2) 64.0 (20.5) NRSpain over the past week 43.3 (23.2) 48.6 (25.3)
* The low back is defined as the area between the lower costal margin and the gluteal folds. † Any pain-killing medication taken for back and/or leg pain over the past week.
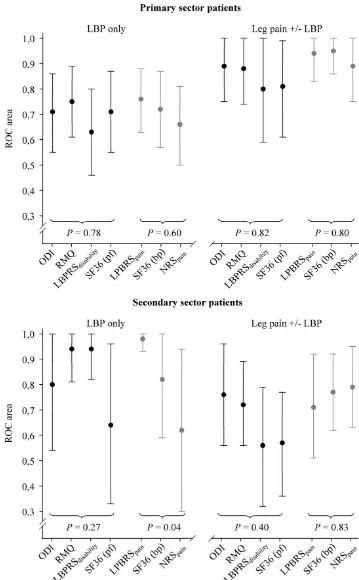
Area under the ROC curve
Figure 1 shows the ROCauc with 95% CIs for all included instruments. The RMQ showed superior discriminative abilities in LBP only patients (both PrS and SeS) whereas the ODI was marginally superior in the leg pain patients, again these differences were not statistically significant. For the pain measures, the LBPRSpain was the superior instrument in the LBP only patients and this was statisti-cally significant in the SeS patients (P = 0.04). Similar dis-criminative abilities were observed in the other subpopulations.
Minimal Clinically Important Difference
The overall and baseline-specific MCIDs for PrS, SeS, LBP and leg pain patients are presented in Table 5. Only minor variations were seen for the overall MCIDs when compar-ing PrS and SeS patients and LBP only and leg pain patients except for the two subscales of the SF36. MCID increased with increasing baseline entry score in the PrS sample, LBP only and leg pain +/- LBP patients. On the other hand, the dependence on baseline entry score was not monotonous for all measures in the SeS and for patients with leg pain. Poor sensitivity or specificity (< 55 [34]) were seen in 10% of the cut-point calculations.
For each 25% increase in baseline entry score (original scale range), the MCID for all patients increased by: 12 points (ODI), 2 points (RMQ), 5 points (LBPRSdisability), 18 points (SF36 (pf)), 6 points (LBPRSpain), 13 points (SF36 (bp)), and 1 point for the NRSpain.
Quarter-specific MCID% for ODI and RMQ are presented in figure 2. An almost constant MCID% across the score groups is seen for both instruments. The average MCID%
was 51% and 38% for the ODI and RMQ, respectively. Subpopulation analyses showed that PrS and LBP patients had to change on average 65% on the ODI and 81% on the RMQ for the change to be clinically relevant. However, SeS and leg pain and/or LBP patients had to change between 28%–36% on both questionnaires – a substan-tially lower percentage change compared to PrS and LBP patients.
Discussion
[image:6.612.57.556.111.359.2]This is the first time a head-to-head comparison of responsiveness and MCID calculations have been carried out in 4 subpopulations of LBP patients. Furthermore, the responsiveness of the LBPRS has not been determined pre-viously [4].
Table 2: Mean raw Change Score (0 – 100 scale) and standardised response mean (SRMraw) in primary and secondary sector patients according to pain location.
Instrument Primary Sector Patients Secondary Sector Patients
n Mean raw change (SD) SRMraw (95% CI) n Mean raw change (SD) SRMraw (95% CI)
LBP only
ODI 69 18.5 (16.8) 1.1 (0,8; 1,4) 28 3.0 (11.7) 0.3 (-0,1; 0,6) RMQ 69 27.7 (19.4) 1.4* (1,2; 1,7) 28 7.5 (15.7) 0.5 (0,2; 0,8) LBPRSdisability 67 15.4 (22.5) 0.7 (0,3; 1,0) 28 2.7 (18.6) 0.1 (-0,2; 0,5) SF36 (pf) 70 23.6 (24.4) 1.0 (0,8; 1,2) 28 5.6 (16.9) 0.3 (0,0; 0,7) LBPRSpain 68 18.7 (20.8) 0.9 (0,5; 1,3) 27 2.1 (16.1) 0.1 (-0,3; 0,5) SF36 (bp) 70 40.2 (28.6) 1.4* (1,0; 1,8) 28 10.8 (17.1) 0.6* (0,2; 1,0) NRSpain 69 26.2 (23.4) 1.1 (0,8; 1,5) 26 1.4 (18.1) 0.1 (-0,3; 0,5)
Leg pain (+/- LBP)
ODI 24 12.0 (13.5) 0.9 (0,5; 1,2) 69 3.5 (9.5) 0.4 (0,1; 0,6) RMQ 24 18.8 (22.0) 0.9 (0,5; 1,2) 68 3.6 (12.1) 0.3 (0,1; 0,5) LBPRSdisability 24 10.8 (17.9) 0.6 (0,2; 1,0) 69 4.5 (10.6) 0.4 (0,2; 0,7) SF36 (pf) 24 15.5 (24.0) 0.6 (0,3; 1,0) 69 5.1 (15.4) 0.3 (0,1; 0,6) LBPRSpain 24 23.5 (25.7) 0.9 (0,5; 1,3) 66 7.8 (15.7) 0.5 (0,2; 0,8) SF36 (bp) 24 28.4 (26.4) 1.1 (0,6; 1,5) 69 12.3 (18.0) 0.7* (0,4; 1,0) NRSpain 23 25.7 (30.4) 0.8 (0,4; 1,2) 65 7.8 (22.7) 0.3 (0,1; 0,6)
ODI = Oswestry Disability Index; RMQ = Roland Morris Disability Questionnaire; LBPRSdisability = Disability subscale of the Low Back Pain Rating Scale; SF36 (pf) = Physical function subscale of the SF36; LBPRSpain = Pain subscale of the Low Back Pain Rating Scale; SF36 (bp) = Bodily pain subscale of the SF36; NRSpain = Numeric 11-box pain rating scale; SRMraw = standardised response mean of the raw change score.
Note: Results are shown according to where in the health care system the patients were seen and whether or not they complained of LBP or leg pain and/or LBP. The 95% CIs for the SRMraw were calculated using a bootstrap technique.
Responsiveness
Lower change scores and SRMs were found for SeS patients. This is because the SRM is dependent on both the effectiveness of the treatment and the patient popula-tion characteristics and therefore expected to vary in a study using two distinctly different patient populations [17,21,90].
The ODI and RMQ have been compared in several studies, and reported SRMs for the ODI range between 0.2 and 1.9 [26,36,37,46,61,91-93] with a similar range for the RMQ (0.5–2.0) [31,41,46,61,92,93]. We found that the RMQ was most sensitive to change in patients with LBP only (significantly different in PrS patients, Table 2) whereas the ODI was slightly more responsive in leg pain patients when considering both SRM and ROCauc. Several authors have argued that the RMQ is more sensitive to change at lower levels of disability compared to the ODI which is sensitive to change at higher disability levels [60,91,94]. Indeed, our data showed a statistically lower mean initial disability scores in patients with LBP only compared to leg pain patients supporting this finding. Furthermore, we found the RMQ to have significantly larger differences in SRMraw between "important improvement" and "no change" patients in all subpopulations (Table 4).
The LBPRS has not been psychometrically tested for responsiveness until now, and it has been unknown how the responsiveness of this instrument compares to other functional status questionnaires [4,64]. For the disability subscale we found lower responsiveness using both SRM and ROCauc in comparison to the other instruments. Sec-ond, the responsiveness was conflicting depending on which strategy was used. The smaller SRMs resulted from five outliers in our dataset who showed an improvement in disability and pain on all other instruments, however, rated themselves as getting worse on the LBPRSdisability scale. We suspect these patients have misunderstood the
answer categories of the scale thus reversing a positive change score to a negative. A reanalysis omitting the out-liers produced SRMs of more comparable magnitude to the rest of the disability measures. Due to the discrepan-cies in responsiveness according to index used and the effect of the outliers we conclude that the responsiveness of the the LBPRSdisability is inconclusive.
The physical function subscale of the SF36 has been investi-gated in chronic LBP patients and reported SRMs range from 0.2 – 0.6 [26,37,46] and from 0.7 – 0.8 in improved patients [37,92]. It has also been suggested that the SF36 (pf) is less responsive compared to back-specific question-naires [37,46,92]. Our results suggest that the SF36 (pf) has poorer responsiveness in patients with leg pain com-pared to the ODI and RMQ when considering both responsiveness indices. However, in LBP only patients the physical function scale showed lower responsiveness in SeS patients while this, remarkably, was approximately equivalent in PrS when compared to the back-specific questionnaires. Thus, we conclude that responsiveness of the SF36 (pf) is dependent on the subpopulation it is applied to.
Overall, the RMQ showed superior responsiveness and discriminative abilities in patients with LBP only which represent the more acute conditions (58% had pain ≤ 30 days) and this was irrespective of where in the health care system they were seen. However, the ODI seemed margin-ally superior to the RMQ in patients with leg pain +/- LBP corresponding to the more chronic conditions (66% had pain > 30 days) in both PrS and SeS patients. The LBPRS
dis-ability generally demonstrated lower responsiveness in
[image:7.612.54.558.100.257.2]comparison to the other disability measures; however, the responsiveness was conflicting according to which strat-egy was used.
Table 3: Relationship between raw change scores and original scale scores.
Raw change scores (0–100 scale) Original scale change score
ODI RMQ LBPRSdisability SF36 (pf) LBPRSpain SF36 (bp)* NRSpain
For the pain measures, we found comparably higher SRMs for the SF36 (bp) in all subpopulations (range: 0.6 – 1.4) which is somewhat higher than previously published val-ues (0.7–1.0) [26,37,92]. This finding qval-uestions the find-ing that the NRSpain is the most responsive pain scale [24,67]. However, the relatively large SRMs seen in the "no change" group signifies that some patients who indi-cated "no change" by the external criterion in fact changed
[image:8.612.58.551.109.545.2]modestly on the SF36 (bp) subscale. Reanalysing our data with a less stringent external criteria (including the "a little better" patients in the important improvement group) only altered the mean change score of the "no change" patients slightly and the SRMs remained the same (data not shown). Thus, one may question whether the specifi-city of the SF36 (bp) subscale is adequate when using a combined external criteria as a golden standard.
Table 4: Standardised response mean (SRMraw) in relation to patients global important effect and according to patient entry point (primary and secondary sector patients) and pain location.
Instrument Important improvement No change Difference P
n SRMraw (95% CI) n SRMraw (95% CI)
Subpopulations
Primary Sector Patients
ODI 63 1.4 (1.2; 1.7) 23 0.8 (0.4; 1.2) 0.6 0.05 RMQ 63 1.7 (1.4; 2.0) 23 0.7 (0.3; 1.1) 1.0
LBPRSdisability 62 0.8 (0.4; 1.2) 22 0.5 (0.1; 0.9) 0.3
SF36 (pf) 64 1.1 (0.9; 1.3) 23 0.4 (0.0; 0.8) 0.7
LPBRSpain 62 1.4 (1.1; 1.6) 23 0.6 (0.1; 1.1) 0.8 0.08
SF36 (bp) 64 2.1 (1.6; 2.5) 23 0.8 (0.4; 1.3) 1.2 NRSpain 62 1.5 (1.2; 1.8) 23 0.8 (0.3; 1.3) 0.7
Secondary Sector Patients
ODI 19 1.0 (0.3; 1.7) 43 0.2 (-0.1; 0.5) 0.8 0.01 RMQ 18 1.3 (0.7; 1.9) 43 0.3 (0.0; 0.6) 1.0
LBPRSdisability 19 0.8 (0.4; 1.3) 43 0.3 (0.0; 0.7) 0.5 SF36 (pf) 19 0.7 (0.3; 1.1) 43 0.4 (0.1; 0.7) 0.3
LPBRSpain 18 1.1 (0.3; 1.8) 42 0.2 (-0.1; 0.5) 0.9 0.06 SF36 (bp) 19 2.1 (1.1; 3.0) 43 0.7 (0.3; 1.0) 1.4
NRSpain 18 0.9 (0.4; 1.3) 41 0.2 (-0.1; 0.5) 0.7
LBP only patients
ODI 58 1.4 (1.1; 1.6) 21 0.7 (0.3; 1.1) 0.7 0.03 RMQ 58 1.7 (1.4; 2.0) 21 0.7 (0.4; 1.0) 1.0
LBPRSdisability 57 0.8 (0.4; 1.3) 20 0.5 (0.2; 0.9) 0.3 SF36 (pf) 59 1.1 (0.9; 1.3) 21 0.7 (0.3; 1.0) 0.4
LPBRSpain 57 1.3 (1.0; 1.6) 21 0.5 (0.0; 1.0) 0.8 0.07
SF36 (bp) 59 1.9 (1.5; 2.3) 21 0.9 (0.4; 1.4) 1.2 NRSpain 58 1.4 (1.1; 1.7) 21 0.7 (0.3; 1.1) 0.7
Leg pain (+/- LBP)
ODI 24 1.2 (0.6; 1.7) 45 0.3 (0.0; 0.6) 0.9 0.05 RMQ 23 1.3 (0.8; 1.7) 45 0.3 (0.0; 0.6) 1.0
LBPRSdisability 24 0.8 (0.3; 1.2) 45 0.3 (0.0; 0.7) 0.5
SF36 (pf) 24 0.8 (0.4; 1.2) 45 0.3 (0.0; 0.6) 0.5
LPBRSpain 23 1.3 (0.7; 1.9) 44 0.3 (0.0; 0.6) 1.0 0.46 SF36 (bp) 24 2.0 (1.3; 2.6) 45 0.6 (0.3; 1.0) 1.1
NRSpain 22 1.3 (0.8; 1.8) 43 0.2 (-0.1; 0.5) 1.1
ODI = Oswestry Disability Index; RMQ = Roland Morris Disability Questionnaire; LBPRSdisability = Disability subscale of the Low Back Pain Rating Scale; SF36 (pf) = Physical function subscale of the SF36; LBPRSpain = Pain subscale of the Low Back Pain Rating Scale; SF36 (bp) = Bodily pain subscale of the SF36; NRSpain = Numeric 11-box pain rating scale; SRMraw = standardised response mean of the raw change score.
Note: Results are shown according to where in the health care system the patients were seen and pain location. The 95% CIs for the SRMraw were
Area under the ROC curve (with 95% confidence intervals) in primary and secondary sector patients according to pain loca-tion
Figure 1
Table 5: Overall and quarter-specific MCIDs (cut-points) for four low back pain subpopulations.
Instrument Overall MCID Quarter-specific MCIDs by baseline entry score§
0–25 26–50 51–75 76–100
All patients
ODI 11† (11) ‡ 8† (8) ‡ 12† (12) ‡ 40† (40)‡
RMQ 5 (20) 2 (7) 5 (20) 6 (27) -LBPRSdisability 5 (17) 1 (3) 4 (13) 10 (33) -SF36 (pf) 3 (17) 1 (5) 3 (17) 7 (33) -LBPRSpain 6 (10) 4 (7) 10 (17) 23 (38) 11† (18) ‡ SF36 (bp) 3 (29) - 2 (22) 3 (33) 5 (50) NRSpain 1 (10) 1 (10) 2 (20) 4 (40) 3 (30)
Subpopulations
Primary sector patients
ODI 9 (9) 9 (9) 16 (16) 40 (40) -RMQ 5 (20) 2 (7)* 6 (27) 11 (47) -LBPRSdisability 5 (17) 0 (0) 6 (20) 10 (33) -SF36 (pf) 2 (11) 1 (5)* 2 (10) 9 (45) -LBPRSpain 12 (20) 6 (10) 13 (22) 20 (33) -SF36 (bp) 4 (42) - 4 (38)* 2 (19) 5 (50) NRSpain 4 (40) 1 (10)* 3 (30) 4 (40)
-Secondary sector patients
ODI 8 (8) 1 (1)* 8 (8) 18 (18)* -RMQ 2 (7) 4 (17) 2 (7) 2 (7) -LBPRSdisability 5 (17) 1 (3) 5 (17) 3 (10) -SF36 (pf) 6 (30) 1 (5) 2 (10) 3 (33)* -LBPRSpain 8 (13) 4 (7) 10 (17) 17 (28)
-SF36 (bp) 2 (22) - 2 (22)* 3 (33) 3 (30) NRSpain 2 (20) 1 (10) 2 (20) 4 (40) 1 (10)
LBP only patients
ODI 9 (9) 9 (9) 13 (13)* 40 (40) -RMQ 2 (7) 2 (7) 5 (23) 11 (47) -LBPRSdisability 5 (17) 1 (3) 6 (20) 13 (43)
-SF36 (pf) 1 (5) 1 (5) 3 (17) 9 (45) -LBPRSpain 7 (12) 7 (12) 13 (22) 25 (42) -SF36 (bp) 4 (43) - 1 (10)* 3 (33) 5 (50) NRSpain 1 (10) 1 (10) 3 (30)* 4 (40) 5 (50)*
Leg pain (+/- LBP)
ODI 8 (8) 3 (3) 8 (8) 18 (18) -RMQ 5 (20) 0 (0) 5 (20) 5 (20) -LBPRSdisability 5 (17) 2 (7)* 4 (13) 5 (17) -SF36 (pf) 4 (20) 1 (6)* 2 (10) 7 (33) -LBPRSpain 10 (17) 6 (10) 5 (17) 22 (38) 11 (18) SF36 (bp) 3 (30) - 1 (11) 2 (19) 3 (30) NRSpain 2 (20) 0 (0) 2 (20) 4 (40) 3 (30) ODI = Oswestry Disability Index; RMQ = Roland Morris Disability Questionnaire; LBPRSdisability = Disability subscale of the Low Back Pain Rating Scale; SF36 (pf) = Physical function subscale of the SF36; LBPRSpain = Pain subscale of the Low Back Pain Rating Scale; SF36 (bp) = Bodily pain subscale of the SF36; NRSpain = Numeric 11-box pain rating scale; MCID = Minimal Clinically Important Difference of the raw change score. § Baseline scores are divided into quarters of the original scale range.
† MCID in point changes of the original scales. Scale ranges: ODI 0–100; RMQ 0–23; LBPRSdisability 0–30; SF36 (pf) 0–20; LBPRSpain 0–60; SF36 (bp) 0–
10; NRSpain 0–10.
ODI and RMQ overall and quarter-specific MCIDs of the percentage change score for four LBP subpopulations
Figure 2
The LBPRSpain showed differing sensitivity to change according to which responsiveness index was used. Using SRMs the LBPRSpain was equally responsive to the NRSpain; however, using ROCauc it was the most responsive pain instrument in LBP only patients. Thus, we conclude that the LBPRSpain scale is responsive and probably preferable to the NRSpain as it provides more information about the
pain dimension.
In summary, we found that all pain measures demon-strate similar responsiveness and this was in turn compa-rable to the disability measures. We recommend using the LBPRSpain as it is easy to use and provides more informa-tion about the patients' pain.
The optimal design and analytic strategies for a respon-siveness study are topics of much debate with little or no consensus [16,95-98]. However, a recent article suggests that analytic strategies in studies of responsiveness should be based on the chosen study design and their corre-sponding sample change characteristics [99]. In our design we included both PrS and SeS patients to allow for subpopulation analysis and the patient composition can therefore be viewed as heterogeneous with identifiable subgroups of patients who change by different amounts. Stratford et al. argues convincingly that the proper analy-sis for this design would be either the area under ROC curve or Norman's Srepeat, and our inclusion of SRMs may therefore seem obsolete. We have chosen to include both analyses as most researchers and clinicians are familiar with interpretation and application of effect sizes in com-parison to ROC curves. Furthermore, the overall conclu-sions about responsiveness would not change (with the exception that the LBPRSdisability subscale would have com-parable responsiveness) using the ROC curve analysis alone.
MCID, baseline entry score, entry point, and pain location
The concept of the MCID defines the smallest meaningful change score for outcome measures. An assumption behind this concept is that the instruments can indeed detect this change. Ultimately, one may question the abil-ity of well established outcome measures to determine the smallest meaningful change as the "true" MCID is unknown. Further, the variability of the MCID is large as it is context-specific and not a fixed attribute [96].
Published MCID values for the included instruments range from: 4 – 16 points (ODI) [27,37,41,52,92,100], 3 – 5 points (RMQ) [31,32,41,60,61,63], 7 – 16 points (SF36 (pf)) [61,101], and 2–3 points for the NRSpain [80,102,103]. MCIDs specific to LBP patients for the SF36 (bp) and LBPRS could not be located in the literature. Our overall MCID estimates fall within reported ranges for all the instruments apart from a slightly higher MCID for the
SF36 (pf). The MCIDs were generally lower for all subpop-ulations compared to the overall MCID, however, only minor differences were found between stratification layers (except for the subscales of the SF36). We were surprised to find similar MCIDs in the PrS and SeS samples since the perception of disease (and thus the need for improve-ment) has been shown to differ [58].
Stratford and Riddle have shown a large increase in MCID with increasing raw baseline score for the RMQ [32,33]. We found this pattern to be true for the overall MCID for all outcome measures and for PrS and LBP only patients (acute patients). However, using the percentage change scores of the ODI and RMQ, the MCID% was more or less independent of the baseline entry score for all subpopula-tions (figure 2). This suggests that patients relate to a per-centage change in their condition rather than to an absolute change when quantifying an important improve-ment. Interestingly, the percentage change signifying an important improvement was dependent on the severity of the condition. PrS and LBP only patients (less severely affected) had to change significantly more (65%–81%) compared to the more severely affected SeS and leg pain +/- LBP patients (28%–36%). Maybe the more disabled leg pain patients have learned not to have too high expec-tations to the outcome of treatment?
Since the meaning of change varies according to baseline entry score, it seems reasonable to assume that other base-line characteristics may affect the MCID [96]. The present study examined the effect of patient entry point into the health care system (primary or secondary sector) and pain location (LBP only or leg pain) on the MCID, and found these factors to be of minor importance for most of the included disability and pain measures. An exception was the physical function and bodily pain subscales of the SF36 which showed large variations in MCID according to patient entry point and pain location.
In conclusion, we found that the overall MCID varied only slightly when stratifying patients according to point of entry into the health care system (i.e. acute vs. chronic patients) and pain location (LBP vs. leg pain +/- LBP) with the two subscales of the SF36 as an exception. Further-more, increasing baseline entry scores resulted in greatly increased MCIDs in PrS patients and patients with LBP only. However, the dependence on baseline entry score was not monotonous for all measures in the SeS and for patients with leg pain.
Limitations
about functional activities in relation to pain [2,3,60]. Comparing these instruments to the SF36 (pf) which only measures function of daily living and to the LBPRSdisability which partly measures pain related function (33% of the items) and function of daily living may be problematic. Second, we reported overall responsiveness and MCIDs for a broad spectrum of care-seeking LBP patients' receiv-ing treatments rangreceiv-ing from simple advice to intensive multidisciplinary rehabilitation. Consequently, respon-siveness and MCIDs for specific subgroups of LBP patients are likely to vary depending on such factors as entry point into the health care system, pain location, treatment received and possibly psychosocial factors, as indicated by our subgroup analyses. Statistical power issues prevented us from further sub-dividing the sample, and estimates presented are to be regarded as an overall guideline. Therefore, we recommend that researchers calculate MCIDs relevant for their individual study populations and use this when reporting the proportion of improved patients and numbers needed to treat in a clinical trial [104]. Third, the validity of using a global retrospective appraisal of change has been challenged especially with respect to recall bias [22,105]; however, this may be a minor problem [36,106]. The validity of combining two different dimensions (improvement and importance) may also be a problem since little is known about its psy-chometric properties. The combination was used because both improvement and importance is central to the con-cept of the MCID. Further, the cut-point used to describe who has improved or stayed the same was arbitrarily set for both dimensions. However, our results showed corre-lation coefficients greater than 0.63 (recommended threshold of 0.5 [105]) between the change scores and the transition question for 5 out of the 7 instruments and an expectedly lower correlation between the change scores and the rating of importance (data not shown) and between the transition question and the rating of impor-tance (0.43). Fourth, the decision of having at least 10 patients in each baseline entry score category was arbitrar-ily set before the analysis was carried out. Most categories had more than 20 patients making the analysis more reli-able. Lastly, some of the MCID cut-points resulted in poor sensitivity or specificity reducing the discriminative ability and validity of the cut-point. However, this occurred in only 10% of the calculations and we consider this accept-able.
Conclusion
The RMQ appears to be more responsive mainly in patients with LBP whereas the ODI and RMQ seemed almost equally responsive in patients with leg pain irre-spective of where in the health care system the patient was seen. Furthermore, the LBPRSdisability showed inconclusive responsiveness in all subpopulations. All pain measures
showed similar responsiveness with only minor differ-ences in the subpopulations.
The MCID was only slightly affected by patient entry point and pain location whereas increasing baseline entry score increased the size of the MCIDs mainly in PrS patients and patients with LBP only. For the ODI and RMQ specifically, the percentage change score remained constant regardless of baseline score when patients quantified an important improvement. We recommend that researchers calculate MCIDs relevant for their individual study populations when reporting the results of a clinical trial.
Competing interests
The author(s) declare that they have no competing inter-ests.
Authors' contributions
HHL and JH conceived the study and participated in its design and the planning of analyses. HHL drafted the manuscript, and HHL and JH revised the manuscript sev-eral times. HHL and LK made the statistical analyses. NGN and CM participated in the design of the study. All authors read and approved the final manuscript.
Acknowledgements
We thank Jytte Johannesen and Ida Bhanderi for administering the ques-tionnaires. Furthermore, we would like to thank the management and staff at Backcenter Funen for their enthusiastic participation in the project. A special thanks to the seven chiropractic clinics for their involvement in recruiting patients for the study.
The study was supported by the Foundation of Chiropractic Research and Postgraduate Education, The Faculty of Health Science at the University of Southern Denmark and The European Chiropractic Union. The funding bodies have no control over design, conduct, data, analysis, review, report-ing, or interpretation of the research conducted with the funds.
References
1. Streiner DL, Norman GR: Health Measurment Scales. A Practical Guide to Their Development and Use Third edition. Edited by: Streiner DL and Norman GR. Oxford, Oxford Medical Publications; 2003.
2. Grotle M, Brox JI, Vollestad NK: Functional Status and Disability Questionnaires: What Do They Assess?: A Systematic Review of Back-Specific Outcome Questionnaires. Spine
2005, 30:130-140.
3. Muller U, Roeder C, Dubs L, Duetz MS, Greenough CG: Condition-specific outcome measures for low back pain. Part II: Scale construction. Eur Spine J 2004, 13:314-324.
4. Muller U, Duetz MS, Roeder C, Greenough CG: Condition-specific outcome measures for low back pain. Part I: Validation. Eur Spine J 2004, 13:301-313.
5. Schaufele MK, Boden SD: Outcome research in patients with chronic low back pain. Orthop Clin North Am 2003, 34:231-237. 6. Guyatt GH, Kirshner B, Jaeschke R: Measuring health status:
what are the necessary measurement properties? J Clin Epide-miol 1992, 45:1341-1345.
7. Deyo RA, Diehr P, Patrick DL: Reproducibility and responsive-ness of health status measures. Statistics and strategies for evaluation. Control Clin Trials 1991, 12:142S-158S.
9. Guyatt G, Walter S, Norman G: Measuring change over time: assessing the usefulness of evaluative instruments. J Chronic Dis 1987, 40:171-178.
10. Kirshner B, Guyatt G: A methodological framework for assess-ing health indices. J Chronic Dis 1985, 38:27-36.
11. Beaton DE, Bombardier C, Katz JN, Wright JG: A taxonomy for responsiveness. J Clin Epidemiol 2001, 54:1204-1217.
12. Terwee CB, Dekker FW, Wiersinga WM, Prummel MF, Bossuyt PM: On assessing responsiveness of health-related quality of life instruments: guidelines for instrument evaluation. Qual Life Res 2003, 12:349-362.
13. Norman GR, Sridhar FG, Guyatt GH, Walter SD: Relation of distri-bution- and anchor-based approaches in interpretation of changes in health-related quality of life. Med Care 2001, 39:1039-1047.
14. Husted JA, Cook RJ, Farewell VT, Gladman DD: Methods for assessing responsiveness: a critical review and recommenda-tions. J Clin Epidemiol 2000, 53:459-468.
15. Lassere MN, van der Heijde D, Johnson KR: Foundations of the minimal clinically important difference for imaging. J Rheuma-tol 2001, 28:890-891.
16. Wells G, Beaton D, Shea B, Boers M, Simon L, Strand V, Brooks P, Tugwell P: Minimal clinically important differences: review of methods. J Rheumatol 2001, 28:406-412.
17. Crosby RD, Kolotkin RL, Williams GR: Defining clinically mean-ingful change in health-related quality of life. J Clin Epidemiol
2003, 56:395-407.
18. Jaeschke R, Singer J, Guyatt GH: Measurement of health status. Ascertaining the minimal clinically important difference.
Control Clin Trials 1989, 10:407-415.
19. Guyatt GH, Osoba D, Wu AW, Wyrwich KW, Norman GR: Meth-ods to explain the clinical significance of health status meas-ures. Mayo Clin Proc 2002, 77:371-383.
20. Wright JG, Young NL: A comparison of different indices of responsiveness. J Clin Epidemiol 1997, 50:239-246.
21. Beaton DE: Understanding the relevance of measured change through studies of responsiveness. Spine 2000, 25:3192-3199. 22. Norman GR, Stratford P, Regehr G: Methodological problems in
the retrospective computation of responsiveness to change: the lesson of Cronbach. J Clin Epidemiol 1997, 50:869-879. 23. Scrimshaw SV, Maher C: Responsiveness of visual analogue and
McGill pain scale measures. J Manipulative Physiol Ther 2001, 24:501-504.
24. Bolton JE, Wilkinson RC: Responsiveness of pain scales: a com-parison of three pain intensity measures in chiropractic patients. J Manipulative Physiol Ther 1998, 21:1-7.
25. Beaton DE, Hogg-Johnson S, Bombardier C: Evaluating changes in health status: reliability and responsiveness of five generic health status measures in workers with musculoskeletal dis-orders. J Clin Epidemiol 1997, 50:79-93.
26. Davidson M, Keating JL: A comparison of five low back disability questionnaires: reliability and responsiveness. Phys Ther 2002, 82:8-24.
27. Fritz JM, Irrgang JJ: A comparison of a modified Oswestry Low Back Pain Disability Questionnaire and the Quebec Back Pain Disability Scale. Phys Ther 2001, 81:776-788.
28. Bronfort G, Bouter LM: Responsiveness of general health status in chronic low back pain: a comparison of the COOP charts and the SF-36. Pain 1999, 83:201-209.
29. Wittink H, Turk DC, Carr DB, Sukiennik A, Rogers W: Comparison of the redundancy, reliability, and responsiveness to change among SF-36, Oswestry Disability Index, and Multidimen-sional Pain Inventory. Clin J Pain 2004, 20:133-142.
30. Chansirinukor W, Maher CG, Latimer J, Hush J: Comparison of the functional rating index and the 18-item Roland-Morris Disa-bility Questionnaire: responsiveness and reliaDisa-bility. Spine
2005, 30:141-145.
31. Stratford PW, Binkley J, Solomon P, Finch E, Gill C, Moreland J: Defining the minimum level of detectable change for the Roland-Morris questionnaire. Phys Ther 1996, 76:359-365. 32. Stratford PW, Binkley JM, Riddle DL, Guyatt GH: Sensitivity to
change of the Roland-Morris Back Pain Questionnaire: part 1. Phys Ther 1998, 78:1186-1196.
33. Riddle DL, Stratford PW, Binkley JM: Sensitivity to change of the Roland-Morris Back Pain Questionnaire: part 2. Phys Ther
1998, 78:1197-1207.
34. Grotle M, Brox JI, Vollestad NK: Concurrent comparison of responsiveness in pain and functional status measurements used for patients with low back pain. Spine 2004, 29:E492-E501. 35. Leclaire R, Blier F, Fortin L, Proulx R: A cross-sectional study comparing the Oswestry and Roland-Morris Functional Dis-ability scales in two populations of patients with low back pain of different levels of severity. Spine 1997, 22:68-71. 36. Hägg O, Fritzell P, Oden A, Nordwall A: Simplifying outcome
measurement: evaluation of instruments for measuring out-come after fusion surgery for chronic low back pain. Spine
2002, 27:1213-1222.
37. Taylor SJ, Taylor AE, Foy MA, Fogg AJ: Responsiveness of com-mon outcome measures for patients with low back pain.
Spine 1999, 24:1805-1812.
38. Walsh TL, Hanscom B, Lurie JD, Weinstein JN: Is a condition-spe-cific instrument for patients with low back pain/leg symp-toms really necessary? The responsiveness of the Oswestry Disability Index, MODEMS, and the SF-36. Spine 2003, 28:607-615.
39. Turner JA, Fulton-Kehoe D, Franklin G, Wickizer TM, Wu R: Com-parison of the Roland-Morris Disability Questionnaire and generic health status measures: a population-based study of workers' compensation back injury claimants. Spine 2003, 28:1061-1067.
40. Garratt AM, Klaber MJ, Farrin AJ: Responsiveness of generic and specific measures of health outcome in low back pain. Spine
2001, 26:71-77.
41. Beurskens AJ, de Vet HC, Koke AJ: Responsiveness of functional status in low back pain: a comparison of different instru-ments. Pain 1996, 65:71-76.
42. Kuijer W, Brouwer S, Dijkstra PU, Jorritsma W, Groothoff JW, Geertzen JH: Responsiveness of the Roland-Morris Disability Questionnaire: consequences of using different external cri-teria. Clin Rehabil 2005, 19:488-495.
43. Pengel LH, Refshauge KM, Maher CG: Responsiveness of pain, dis-ability, and physical impairment outcomes in patients with low back pain. Spine 2004, 29:879-883.
44. Bolton JE, Breen AC: The Bournemouth Questionnaire: a short-form comprehensive outcome measure. I. Psychomet-ric properties in back pain patients. J Manipulative Physiol Ther
1999, 22:503-510.
45. Wiesinger GF, Nuhr M, Quittan M, Ebenbichler G, Wolfl G, Fialka-Moser V: Cross-cultural adaptation of the Roland-Morris questionnaire for German-speaking patients with low back pain. Spine 1999, 24:1099-1103.
46. Kopec JA, Esdaile JM, Abrahamowicz M, Abenhaim L, Wood-Dau-phinee S, Lamping DL, Williams JI: The Quebec Back Pain Disa-bility Scale. Measurement properties. Spine 1995, 20:341-352. 47. Boscainos PJ, Sapkas G, Stilianessi E, Prouskas K, Papadakis SA: Greek versions of the Oswestry and Roland-Morris Disability Questionnaires. Clin Orthop 2003:40-53.
48. Fujiwara A, Kobayashi N, Saiki K, Kitagawa T, Tamai K, Saotome K: Association of the Japanese Orthopaedic Association score with the Oswestry Disability Index, Roland-Morris Disability Questionnaire, and short-form 36. Spine 2003, 28:1601-1607. 49. Grotle M, Brox JI, Vollestad NK: Cross-cultural adaptation of the
Norwegian versions of the Roland-Morris Disability Ques-tionnaire and the Oswestry Disability Index. J Rehabil Med
2003, 35:241-247.
50. Fritz JM, Piva SR: Physical impairment index: reliability, valid-ity, and responsiveness in patients with acute low back pain.
Spine 2003, 28:1189-1194.
51. Yakut E, Duger T, Oksuz C, Yorukan S, Ureten K, Turan D, Frat T, Kiraz S, Krd N, Kayhan H, Yakut Y, Guler C: Validation of the Turkish version of the Oswestry Disability Index for patients with low back pain. Spine 2004, 29:581-585.
52. Mannion AF, Junge A, Grob D, Dvorak J, Fairbank JC: Development of a German version of the Oswestry Disability Index. Part 2: sensitivity to change after spinal surgery. Eur Spine J 2006, 15:66-73.
54. Kucukdeveci AA, Tennant A, Elhan AH, Niyazoglu H: Validation of the Turkish version of the Roland-Morris Disability Ques-tionnaire for use in low back pain. Spine 2001, 26:2738-2743. 55. Exner V, Keel P: Measuring disability of patients with low-back
pain - validation of a German version of the Roland & Morris disability questionnaire. Schmerz 2000, 14:392-400.
56. Lauridsen HH, Hartvigsen J, Manniche C, Korsholm L, Grunnet-Nils-son N: Danish version of the Oswestry Disability Index for patients with low back pain. Part 1: Cross-cultural adapta-tion, reliability and validity in two different populations. Eur Spine J 2006.
57. Lauridsen HH, Hartvigsen J, Manniche C, Korsholm L, Grunnet-Nils-son N: Danish version of the Oswestry disability index for patients with low back pain. Part 2: Sensitivity, specificity and clinically significant improvement in two low back pain populations. Eur Spine J 2006.
58. Lonnberg F: The management of back problems among the population. I. Contact patterns and therapeutic routines.
Ugeskr Laeger 1997, 159:2207-2214 [In Danish].
59. Fairbank J, Pynsent PB, Disney S: The Oswestry Disability Index. 2006 [http://www.orthosurg.org.uk/odi/].
60. Roland M, Fairbank J: The Roland-Morris Disability Question-naire and the Oswestry Disability QuestionQuestion-naire. Spine 2000, 25:3115-3124.
61. Patrick DL, Deyo RA, Atlas SJ, Singer DE, Chapin A, Keller RB: Assessing health-related quality of life in patients with sciat-ica. Spine 1995, 20:1899-1908.
62. Roland M, Morris R: A Study of the Natural-History of Back Pain .1. Development of A Reliable and Sensitive Measure of Disability in Low-Back-Pain. Spine 1983, 8:141-144.
63. Ostelo RW, de Vet HC, Knol DL, van den Brandt PA: 24-item Roland-Morris Disability Questionnaire was preferred out of six functional status questionnaires for post-lumbar disc sur-gery. J Clin Epidemiol 2004, 57:268-276.
64. Manniche C, Asmussen K, Lauritsen B, Vinterberg H, Kreiner S, Jor-dan A: Low Back Pain Rating scale: validation of a tool for assessment of low back pain. Pain 1994, 57:317-326.
65. McHorney CA, Ware JEJ, Rogers W, Raczek AE, Lu JF: The validity and relative precision of MOS short- and long-form health status scales and Dartmouth COOP charts. Results from the Medical Outcomes Study. Med Care 1992, 30:MS253-MS265. 66. Bjorner JB, Damsgaard MT, Watt T, Bech P, Rasmussen NK, Modvig
J, Thunedborg K: Danish Manual to the SF36 Edited by: Bjorner JB. LIF, Lægemiddelindutriforeningen; 1997.
67. Williamson A, Hoggart B: Pain: a review of three commonly used pain rating scales. J Clin Nurs 2005, 14:798-804.
68. Childs JD, Piva SR, Fritz JM: Responsiveness of the numeric pain rating scale in patients with low back pain. Spine 2005, 30:1331-1334.
69. Fischer D, Stewart AL, Bloch DA, Lorig K, Laurent D, Holman H: Capturing the patient's view of change as a clinical outcome measure. JAMA 1999, 282:1157-1162.
70. Guyatt GH, Berman LB, Townsend M, Taylor DW: Should study subjects see their previous responses. J Chronic Dis 1985, 38:1003-1007.
71. Guyatt GH, Townsend M, Keller JL, Singer J: Should study subjects see their previous responses - data from a randomized con-trol trial. J Clin Epidemiol 1989, 42:913-920.
72. Albert HB, Jensen AM, Dahl D, Rasmussen MN: Criteria validation of the Roland Morris questionnaire. A Danish translation of the international scale for the assessment of functional level in patients with low back pain and sciatica. Ugeskr Laeger 2003, 165:1875-1880 [In Danish].
73. Bjorner JB, Thunedborg K, Kristensen TS, Modvig J, Bech P: The Danish SF-36 Health Survey: translation and preliminary validity studies. J Clin Epidemiol 1998, 51:991-999.
74. Bjorner JB, Kreiner S, Ware JE, Damsgaard MT, Bech P: Differential item functioning in the Danish translation of the SF-36. J Clin Epidemiol 1998, 51:1189-1202.
75. Bjorner JB, Damsgaard MT, Watt T, Groenvold M: Tests of data quality, scaling assumptions, and reliability of the Danish SF-36. J Clin Epidemiol 1998, 51:1001-1011.
76. McHorney CA, Ware JEJ, Raczek AE: The MOS 36-Item Short-Form Health Survey (SF-36): II. Psychometric and clinical tests of validity in measuring physical and mental health con-structs. Med Care 1993, 31:247-263.
77. McHorney CA, Ware JEJ, Lu JF, Sherbourne CD: The MOS 36-item Short-Form Health Survey (SF-36): III. Tests of data quality, scaling assumptions, and reliability across diverse patient groups. Med Care 1994, 32:40-66.
78. Ware JEJ, Sherbourne CD: The MOS 36-item short-form health survey (SF-36). I. Conceptual framework and item selection.
Med Care 1992, 30:473-483.
79. Bombardier C, Hayden J, Beaton DE: Minimal clinically important difference. Low back pain: outcome measures. J Rheumatol
2001, 28:431-438.
80. Farrar JT, Young JPJ, LaMoreaux L, Werth JL, Poole RM: Clinical importance of changes in chronic pain intensity measured on an 11-point numerical pain rating scale. Pain 2001, 94:149-158. 81. Kazis LE, Anderson JJ, Meenan RF: Effect sizes for interpreting
changes in health status. Med Care 1989, 27:S178-S189. 82. Bolton JE: Sensitivity and specificity of outcome measures in
patients with neck pain: detecting clinically significant improvement. Spine 2004, 29:2410-2417.
83. Efron B, Tibshirani RJ: An Introduction to the Bootstrap 1st ed. edition. New York, Chapman and Hall; 1993.
84. Phillips PCB, Park JY: On the formulation of wald tests of non-linear restrictions. Econometrica 1988, 56:1065-1083.
85. Deyo RA, Centor RM: Assessing the responsiveness of func-tional scales to clinical change: an analogy to diagnostic test performance. J Chronic Dis 1986, 39:897-906.
86. Hanley JA: Receiver operating characteristic (ROC) method-ology: the state of the art. Crit Rev Diagn Imaging 1989, 29:307-335.
87. de Vet HC, Bouter LM, Bezemer PD, Beurskens AJ: Reproducibility and responsiveness of evaluative outcome measures. Theo-retical considerations illustrated by an empirical example.
Int J Technol Assess Health Care 2001, 17:479-487.
88. DeLong ER, DeLong DM, Clarke-Pearson DL: Comparing the areas under two or more correlated receiver operating characteristic curves: a nonparametric approach. Biometrics
1988, 44:837-845.
89. Farrar JT, Portenoy RK, Berlin JA, Kinman JL, Strom BL: Defining the clinically important difference in pain outcome meas-ures. Pain 2000, 88:287-294.
90. Coste J, Delecoeuillerie G, Cohen L, Le Parc JM, Paolaggi JB: Clinical course and prognostic factors in acute low back pain: an inception cohort study in primary care practice. BMJ 1994, 308:577-580.
91. Stratford PW, Binkley JM: Measurement properties of the RM-18. A modified version of the Roland-Morris Disability Scale.
Spine 1997, 22:2416-2421.
92. Suarez-Almazor ME, Kendall C, Johnson JA, Skeith K, Vincent D: Use of health status measures in patients with low back pain in clinical settings. Comparison of specific, generic and prefer-ence-based instruments. Rheumatology (Oxford) 2000, 39:783-790.
93. Jette DU, Jette AM: Physical therapy and health outcomes in patients with spinal impairments. Phys Ther 1996, 76:930-941. 94. Stratford PW, Binkley J, Solomon P, Gill C, Finch E: Assessing
change over time in patients with low back pain. Phys Ther
1994, 74:528-533.
95. Wells G, Anderson J, Beaton D, Bellamy N, Boers M, Bombardier C, Breedveld F, Carr A, Cranney A, Dougados M, Felson D, Kirwan J, Schiff M, Shea B, Simon L, Smolen J, Strand V, Tugwell P, van Riel P, Welch VA: Minimal clinically important difference module: summary, recommendations, and research agenda. J Rheu-matol 2001, 28:452-454.
96. Beaton DE, Boers M, Wells GA: Many faces of the minimal clin-ically important difference (MCID): a literature review and directions for future research. Curr Opin Rheumatol 2002, 14:109-114.
97. Stratford PW, Binkley FM, Riddle DL: Health status measures: strategies and analytic methods for assessing change scores.
Phys Ther 1996, 76:1109-1123.
98. Stratford PW, Spadoni G, Kennedy D, Westaway MD, Alcock GK: Seven points to consider when investigating a measure's ability to detect change. Physiother Can 2002, 54:16-24. 99. Stratford PW, Riddle DL: Assessing sensitivity to change:
Publish with BioMed Central and every scientist can read your work free of charge "BioMed Central will be the most significant development for disseminating the results of biomedical researc h in our lifetime."
Sir Paul Nurse, Cancer Research UK
Your research papers will be:
available free of charge to the entire biomedical community
peer reviewed and published immediately upon acceptance
cited in PubMed and archived on PubMed Central
yours — you keep the copyright
Submit your manuscript here:
http://www.biomedcentral.com/info/publishing_adv.asp
BioMedcentral 100. Hägg O, Fritzell P, Nordwall A: The clinical importance of
changes in outcome scores after treatment for chronic low back pain. Eur Spine J 2003, 12:12-20.
101. Davidson M, Keating JL, Eyres S: A low back-specific version of the SF-36 Physical Functioning scale. Spine 2004, 29:586-594. 102. Ostelo RW, de Vet HC: Clinically important outcomes in low
back pain. Best Pract Res Clin Rheumatol 2005, 19:593-607. 103. Finch E, Brooks D, Stratford P, Mayo NE: Physical Rehabilitation
Out-come Measures 2nd. edition edition. BC Decker Inc.; 2002:180-181. 104. Altman DG, Schulz KF, Moher D, Egger M, Davidoff F, Elbourne D,
Gotzsche PC, Lang T: The revised CONSORT statement for reporting randomized trials: explanation and elaboration.
Ann Intern Med 2001, 134:663-694.
105. Guyatt GH, Norman GR, Juniper EF, Griffith LE: A critical look at transition ratings. J Clin Epidemiol 2002, 55:900-908.
106. Hägg O, Fritzell P, Nordwall A: Simplifying outcome measure-ment. Eur Spine J 2005, 14:S1-S30.
Pre-publication history
The pre-publication history for this paper can be accessed here: