ORIGINAL ARTICLE
ADVANCED SQUAMOUS CELL CARCINOMA OF THE
OROPHARYNX: EFFICACY OF POSITRON EMISSION
TOMOGRAPHY AND COMPUTED TOMOGRAPHY FOR
DETERMINING PRIMARY TUMOR RESPONSE DURING
INDUCTION CHEMOTHERAPY
Douglas B. Chepeha, MD, MSPH,1Assuntina G. Sacco, BS,1Lance E Oxford, MD,2 Rahul Karamchandani, MD,1Tamara H. Miller, RN, BSN,1Theodoros N. Teknos, MD,1y
Carol R. Bradford, MD, MS,1Avraham Eisbruch, MD,3Frank M. Worden, MD,4Susan G. Urba, MD,4 Suresh K. Mukherji, MD,5Chuong Bui, MBBS, FRACP,6Kirk A. Frey, MD, PhD,5Gregory T. Wolf, MD,1 Julia S. Lee, MS, MPH7
1Department of Otolaryngology–Head and Neck Surgery, University of Michigan, Ann Arbor,
Michigan 48109-0312. E-mail: dchepeha@umich.edu
2Department of Otolaryngology–Head and Neck Surgery, Baylor University Medical Center, Dallas, Texas 3
Department of Radiation Oncology, University of Michigan, Ann Arbor, Michigan 4
Department of Internal Medicine–Hematology/Oncology, University of Michigan, Ann Arbor, Michigan 5
Department of Radiology, University of Michigan, Ann Arbor, Michigan 6
Department of Nuclear Medicine, Nepean Hospital, Penrith NSW, Sydney, Australia 7
Cancer Center, Univeristy of Michigan, Ann Arbor, Michigan
Accepted 1 August 2008
Published online 2 February 2009 in Wiley InterScience (www.interscience.wiley.com). DOI: 10.1002/hed.21006
Abstract: Background. To evaluate the efficacy of fluorine-18-fluorodeoxyglucose emission tomography (FDG-PET) and CT versus endoscopy with biopsy under general anesthesia for estimating tumor volume reduction among patients treated with induction chemotherapy for advanced squamous cell carcinoma (SCC) of the oropharynx.
Methods. Twelve patients with oropharyngeal SCC nested in a phase II, induction chemoradiation, organ preservation trial (University of Michigan Cancer Center 9921) underwent tumor
volume reduction estimation as assessed by FDG-PET, CT, and endoscopy with biopsy.
Results. In 9 of 12 patients, FDG-PET, CT, and endoscopy demonstrated agreement in estimation of tumor reduction. Two patients had discordant results, whereas 1 patient was inad-equately evaluated with FDG-PET. The kappa value for PET ver-sus endoscopy was 0.62, which is categorized as substantial agreement. The kappa value for CT versus endoscopy was 0.40, which is categorized as fair agreement.
Conclusion. FDG-PET may be as efficacious as endoscopy with biopsy under general anesthesia for estimating tumor vol-ume reduction with induction chemotherapy. VVC2009 Wiley Periodicals, Inc.Head Neck31:452–460, 2009
Keywords: oropharyngeal neoplasms; emission-computed to-mography; antineoplastic combined chemotherapy protocols; squamous cell carcinoma; fluorodeoxyglucose-18
Correspondence to:D. B. Chepeha
yCurrent address: Department of Otolaryngology–Head and Neck Surgery,
Ohio State University, Columbus, Ohio.
V
F
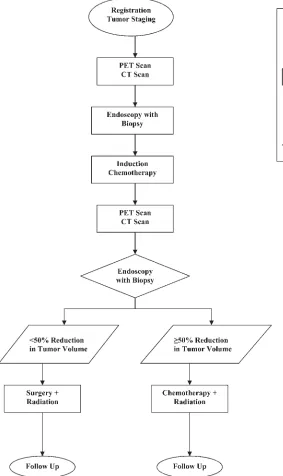
unctional imaging is a developing technology that will facilitate the assessment of tumor response during the course of treatment. Assess-ment of response during treatAssess-ment will provide head and neck oncologists the opportunity to mod-ify treatment as needed to maximize tumor response. Such a treatment approach could facili-tate escalation, deescalation, alteration, addition, or subtraction of one or several treatment modal-ities depending on the observed response to treat-ment. Critical to the development of dynamic treatment approaches will be the validation of diagnostic modalities used to assess tumor res-ponse. Advances in imaging, including perfusion CT scan, diffusion MRI and positron emission to-mography (PET) scan, have made it possible to assess functional aspects of tumor physiology. Functional radiologic assessment should prove valuable for modulating therapy during treat-ment, which could facilitate treatment regimens tailored to the physiology of the tumor.1,2The University of Michigan has been a center for the development of induction chemotherapy for treatment selection prior to definitive chemo-radiation therapy or surgery for advanced (stage III–IV) squamous cell carcinoma (SCC) of the head and neck. This approach uses induction chemotherapy to assess the chemosensitivity of the tumor and to select definitive treatment mo-dality based on the response.3Historically, 80%of tumors in the hypopharynx and larynx are chemo-sensitive.3,4 Patients with the chemosensitive tumors would undergo concomitant chemoradia-tion therapy. This approach is called targeted ‘‘organ preservation’’ as it seeks to preserve (rather than surgically remove) the organs that are involved with cancer in patients with favor-able tumor biology. The induction phase of the organ preservation approach in this study involves 1 cycle of chemotherapy. After the induc-tion phase, the patient is reevaluated with endos-copy and biopsy under general anesthesia. If the primary tumor responds (reduces in size) by at least 50%, patients receive concomitant chemora-diation therapy. If tumors are not responsive to 1 cycle of chemotherapy, patients receive primary surgery with postoperative radiation. At many other institutions, primary concurrent chemora-diation is used for similar patients and surgery is held in reserve for persistent or recurrent disease. Delays in identifying such nonresponsive patients could compromise survival rates.
With the increasing sophistication of chemora-diation trials, we chose to evaluate functional
imaging in a rigorous fashion to assess its per-formance in comparison to the gold standard physical exam. The limitation of physical exam is the frequent requirement of endoscopic proce-dures under general anesthesia to evaluate tumor volume. In addition to the associated risks of plac-ing a patient under general anesthesia, these pro-cedures are quite costly and rely on visual estima-tion of tumor response. Therefore, the main focus of this investigation was to evaluate alternative, noninvasive diagnostic modalities as quantitative and/or functional measures for estimating tumor reduction. It is important to emphasize that this is a study of tumor response, not tumor staging. En-doscopy is a critical part of the initial assessment of patients with oropharyngeal SCC. Our hypoth-esis was that fluorine-18-fluorodeoxyglucose (FDG)-PET and/or CT scan would be equivalent to endoscopy with biopsy under general anesthesia in estimating tumor volume reduction among patients receiving induction chemotherapy for advanced SCC of the head and neck.
PATIENTS AND METHODS
initiated at 8 weeks after completion of radia-tion.5,6 If the patients had less than a 50% response of their primary tumor to induction chemotherapy, then they were deemed ‘‘nonres-ponders’’ and subsequently underwent surgery with postoperative radiation. Any patient who was initially seen with regional metastases greater than 3 cm underwent a planned neck dis-section 8 to 12 weeks following completion of che-moradiation therapy. All patients were prospec-tively followed for a minimum of 4 years for over-all and disease-free survival.
Upon entry into this nested protocol, patients received pretreatment evaluation, which included a PET scan and CT scan performed 1 day prior to diagnostic endoscopy with biopsy under general anesthesia. Patients then received a single course of induction chemotherapy (cisplatin or carbopla-tin and 5-fluorouracil). Three weeks after induc-tion therapy, patients underwent a second set of PET and CT scans performed 1 day prior to a sec-ond endoscopy with biopsy under general anesthe-sia, which was used to determine the degree of tu-mor reduction (Figure 1). The scans were per-formed with the patients wearing the facemask used for radiation therapy to improve the consis-tency of head position for comparison of the first and second scans.
Endoscopy and Biopsy Under General Anesthesia. Each
direct laryngoscopy was performed by a surgeon (DBC, TNT) from the University of Michigan, Department of Otolaryngology. During the first endoscopy, primary tumor dimensions (measured in centimeters) were performed through direct visualization and palpation of the tumor. The mar-gin of the primary tumor was also tattooed with India ink to facilitate subsequent measurements. During the second endoscopy, tumor dimensions were measured in a similar fashion. Primary tu-mor reduction was also estimated by the surgeon, and the percent of the residual primary tumor was estimated relative to the original tattoo mark-ings on a scale of 0%to 100%. Presence or absence of primary tumor was determined by biopsy per-formed at the time of each endoscopy, with repeat biopsies consisting of tissue sampled from within and at the periphery of the original tattoo ring.
The primary tumor reduction estimates and biopsies were compared with the primary tumor reduction estimates determined by the values obtained from the PET scan and the volumetric estimates of the CT scan.
CT Scan. CT scans were performed on a
multide-tector scanner (Lightspeed Ultra; General
Elec-tric Medical Systems, Milwaukee, WI). First, a noncontrast CT scan of the primary site was obtained. Intravenous contrast was then adminis-tered at 2 mL/s to obtain a routine neck study using 2.5 mm contiguous sections performed from the skull base to the thoracic inlet. A radiologist (SM) then localized the tumor on contrast-enhanced CT by first identifying the level at which the tumor’s cross-section was largest, and second, by drawing a freehand outline of a user-defined region of interest to maximally incorporate solid tumor while omitting areas of necrosis and peritu-moral hyperemia.2This was done for each image slice in which there was evidence of primary tu-mor on the image. The volume was calculated by measuring the area of the tumor on each slice, multiplying the area of each slice by the slice thickness, and then determining the sum of all the slices which showed evidence of tumor (RK). The result was the tumor volume.
PET Scan. Positron emission tomography was
performed on dedicated, full-ring BGO tomo-graphs (Siemens 921 or HR1, Siemens Medical Systems, Iselin, NJ) after patients underwent at least 4 hours of fasting. Image acquisition was performed from skull base to low abdomen begin-ning 60 minutes after intravenous administration of 300 to 400 megabecquerel (8–11 mCi) of FDG depending upon the imaging protocol for each scanner. Transmission scanning for attenuation correction was performed using a germanium 68 ring source. The emission and attenuation-crected PET images were reconstructed in 3 or-thogonal planes (transaxial, coronal, and sagittal) for review. Partial volume corrections were not performed as part of the study design.
calculation of SULmax as adjusted by predicted lean body mass is
SUL ¼
Tissue concentrationðkilobecquerel per millimeterÞ
Activity per injected lean body mass
ðkilobecquerel per gramÞ
where lean body mass is calculated as 45.5 1 0.913([height (cm)2152]) for women and 48.01 1.063([height (cm)2152]) for men.9
The first PET scan established the detection of and baseline SULmax values for the primary tumor. The second PET scan was used to determine the per-centage of primary tumor reduction and to deter-mine if there was residual tumor at the primary site, based on visual analysis and sequential SUL-max. These results were compared with the results of endoscopy and biopsy under general anesthesia.
[image:4.612.97.380.59.535.2]In addition to calculation of SULmax values for each FDG-avid nodal metastasis, visual esti-mation of response was also recorded (CB). Nodal
response was classified as none (metabolism unchanged or increased), partial (metabolism sig-nificantly reduced), near complete (metabolism only slightly above surrounding tissues), or com-plete (no metabolic abnormality).
Blinding. Each of the 3 tests was rated
independ-ently with respect to the primary site. As would be expected, a surgeon performed the rating for the endoscopy (DBC, TNT), a neuroradiologist (SM) did the rating for the CT scans, and a nuclear medicine physician (KF, CB) did the rating for the PET scans. The imaging specialists were blinded to the results of the other raters. The surgeon was blinded to the results of the PET at the primary site for the second endoscopy. The surgeon did have the first and second CT scan during the sec-ond endoscopy as this was considered part of the ‘‘standard of care.’’ Blinding the treating surgeon to the results of the CT scan at the primary site was considered an unacceptable risk with respect to human subject regulation. Any findings with respect to distant disease were not blinded. Blind-ing was necessary to assure accurate and unbiased volumetric estimates from endoscopy and PET scanning. The physician participants remained blinded until the end of the study with respect to the PET findings at the primary site. The patients were informed of their response sta-tus as assessed by estimation of tumor volume reduction with endoscopy and CT if necessary, and treated accordingly per the parent protocol.
Population. Patients were accrued for this study as they presented to the Department of Otolaryn-gology at the University of Michigan for the man-agement of their head and neck cancer. All patients signed informed consent to participate, and this protocol was approved by the Institu-tional Review Board at the University of Michigan (IRB #2001-0304).
[image:5.612.68.548.74.236.2]Inclusion criteria were patients who had previ-ously untreated, newly diagnosed SCC of the oro-pharynx, stage III or IV, that were enrolled in the UMCC 9921 induction, treatment selection che-moradiation or surgery protocol for the orophar-ynx. Patients were excluded if they had a prior head and neck malignancy, prior head and neck radiation, prior chemotherapy, diabetes mellitus, which may interfere with glucose uptake reading in PET scanning, or musculoskeletal deformities or claustrophobia which might interfere with a patient’s ability to lie supine for a period of up to 60 minutes during PET scanning. Pregnant women, children, prisoners, and other institution-alized patients were also excluded from this study. Twelve patients were accrued between Febru-ary 2002 and JanuFebru-ary 2003. The mean age was 55.1 years (range, 46–72 years), there were 9 men and 3 women, and patients were followed a mini-mum of 4 years. Tumor site, stage, treatment, and response data are listed in Table 1. Eight of 12 (67%) patients are presently alive and free of disease, 3 (25%) patients are dead of disease, and 1 (8%) patient is lost to follow-up. The patient lost
Table 1. Estimation of tumor reduction as assessed by surgeon, PET scan, and CT scan.
Patient no.
Tumor site
Clinical stage
Initial tumor size, cm3*
Surgeon assessment,%
PET scan assessment,%
CT scan
assessment,% Treatment
Disease status
Duration of follow-up, mo
1 BOT T2N2a 5.7 100 100 98 CXRT/neck FOD 65
2y Tonsil T1N2a 1.8 100 Unable to
differentiate
75 CXRT/neck FOD 61
3 BOT T3N2b 11.1 100 95 74 CXRT/neck FOD 58
4 BOT T1N2c 1.7 100 90 90 CXRT FOD 58
5 BOT T3N2a 6.5 90 100 84 CXRT FOD 52
6 Tonsil T2N2b 8.6 90 98 84 CXRT/neck FOD 63
7 Tonsil T2N2a 3.6 70 100 90 CXRT/neck FOD 62
8 BOT T4N2c 19.7 70 50 61 CXRT DOD 56
9 BOT T4N0 22.5 50 50 62 CXRT DOD 9
10 BOT T4N2c 37.2 20 25 23 Surgery/XRT DOD 9
11{ Tonsil T4N2b 36.3 50 75 47 CXRT LFU 24
12{ BOT T2N1 30.9 20 80 65 Surgery/CXRT FOD 56
Abbreviations: CXRT, chemoradiation only; CXRT/NECK, chemoradiation followed by planned neck dissection; FOD, free of disease; DOD, dead of disease; Surgery/XRT or Surgery/CXRT, failed induction chemotherapy, underwent surgery followed by adjuvant radiation or chemoradiation therapy, respectively; LFU, lost to follow-up.
*Note that initial tumor size was obtained through digitization of the CT scan performed prior to induction chemotherapy.
yThis patient had a unilateral tonsillar primary confirmed with endoscopy but there was evidence of bilateral FDG uptake of the palatine tonsils on PET scan. Following induction chemotherapy, the bilateral tonsillar FDG uptake had resolved.
to follow-up was enrolled on study for 2 years prior to being lost. During this 2-year interval, he remained free of disease.
Statistical Analysis
Univariate. Univariate data was tabulated on
clini-cal T stage, cliniclini-cal N stage, overall cliniclini-cal stage, and recurrence pattern. Primary tumor volume and response to treatment, as well as response of regional metastasis was determined as mentioned under study design.
Interrater Analysis. The interrater reliability
between diagnostic modalities was assessed using kappa analysis. Kappa is defined as the actual agreement beyond chance over the potential agreement beyond chance.10Change in tumor vol-ume reduction as assessed by PET scan, CT scan, and endoscopy was quantified as a binary variable of greater than/equal to or less than 50%. So, if the response was equal to or greater than 50%, then they were classified as a responder. If the response was less than 50%they were classified as a nonresponder.
The formula which was used is:
Kappa¼ Agreement beyond chance Potential agreement beyond chance
A stepwise approach on the calculation of kappa analysis is listed as follows11:
Observer A
Observer B
Positive (1) Negative (2) Row total
Positive (1) a b a1b
Negative (2) c d c1d
Column total a1c b1d
Grand total N
The observed agreement (O) can be calculated as:
ðNumber of agreements=Total number of pairsÞ
¼ ðaþdÞ=N
For cell (11), the expected value will be:
½ðaþbÞ3ðaþcÞ=N
For the cell (22), the expected value will be:
½ðcþdÞ3ðbþdÞ=N
The expected agreement (E) on the basis of chance is calculated as:
½Expected value for cellðþþÞ
þExpected value for cellð Þ=N The actual agreement beyond chance is therefore:
Observed agreementðOÞ Expected agreementðEÞ
The potential agreement beyond chance is there-fore:
1E
The kappa statistic indicates how much the actual agreement beyond chance (O2E) represents rela-tive to this potential (12E):
Kappa¼ ðOEÞ=ð1EÞ
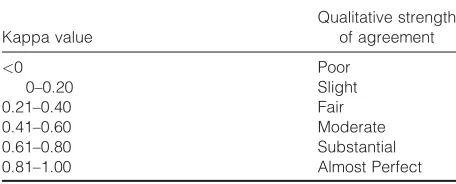
To evaluate the clinical relevance of the kappa value, a table published by Landis et al was used to report the level of agreement (Table 2).12
All data were maintained in a Filemaker Pro 7.0 relational database (Claris Corp., Santa Clara, CA) and kept on a server designed to protect patient confidentiality at the University of Michi-gan. The data were exported to a Microsoft Excel 2002 spreadsheet (Microsoft Corp., Redmond, WA) for analysis.
RESULTS
[image:6.612.317.545.85.177.2]In 9 of 12 patients, PET, CT, and endoscopy dem-onstrated agreement in the estimation of tumor reduction at the primary site. Two patients did not demonstrate agreement and for 1 patient, the PET could not discriminate between malignant tissue embedded in lymphoid tissue in 1 palatine
Table 2. List of kappa values and corresponding strengths of agreement.
Kappa value
Qualitative strength of agreement
<0 Poor
0–0.20 Slight
0.21–0.40 Fair
0.41–0.60 Moderate
0.61–0.80 Substantial
0.81–1.00 Almost Perfect
tonsil versus normal lymphoid tissue in the con-tralateral palatine tonsil.
For 1 patient who did not demonstrate agree-ment across all three modalities, the response as estimated by PET and CT was greater than 50%, whereas the response estimated by the surgeon was 20%. This patient was subsequently treated with a subtotal base of tongue resection, bilateral selective neck dissection, and postoperative radia-tion therapy. He remains free of disease greater than 4 years postcompletion of his cancer treat-ment.
For the second patient who did not demon-strate agreement across all 3 modalities, the response as estimated by the surgeon and PET was greater than 50%, whereas the response esti-mated by CT was 47%. Per protocol, the patient was subsequently treated with chemoradiation therapy. A direct laryngoscopy and biopsy per-formed at 8 weeks postcompletion of chemoirra-diation revealed no evidence of local or regional disease. The patient did not receive any further treatment and remained disease-free for 2 years prior to being lost to follow-up.
Table 1 provides data on the percentage of tu-mor response as assessed by surgeon, PET scan, and CT scan. The PET agreed with the endoscopic estimate in 10 of the 11 patients, whereas the CT agreed with the endoscopic estimate in 10 of the 12 patients. The patient with the palatine tonsil primary who had bilateral FDG uptake was removed from the kappa analysis of PET. This action was chosen with this patient as it would most closely mimic clinical decision-making. If PET was not able to discriminate between malig-nant and nonmaligmalig-nant tissue with the initial scan, it would not be reasonable to continue to use this modality to predict response. This action also provided useful data to show that there may be a proportion of patients with malignancy in Wal-deyer’s ring in which PET will lack discriminate ability for the assessment of tumor response. The strength of agreement between PET and endos-copy was calculated using a total of 11 patients, whereas CT versus endoscopy was calculated using a total of 12 patients.
The kappa value for PET versus endoscopy was 0.62, which is categorized as substantial agreement (Table 2).12 The kappa value for CT versus endoscopy was 0.40, which is categorized as fair agreement (Table 2). This result suggests that PET is more reliable than CT for predicting tumor response to induction chemotherapy if en-doscopy is considered the gold standard.
Mean tumor volume as assessed by CT was 15.46 cm3 at time of first scan, (range, 1.67– 37.24 cm3), 6.78 cm3at time of second scan (range,
0.11–28.68 cm3), and an overall mean reduction in tumor volume equal to 8.68 cm3 (range, 1.33– 19.4 cm3). The mean percentage decrease in tumor size as assessed by CT was 71% (range, 23% to 98%). The mean SULmax value of the primary tu-mor calculated by PET was 5.9 at time of first scan (range, 3.3–7.9), 2.8 at time of second scan (range, 0.4–4.8), and an overall decrease in SULmax equal to 3.1 (range, 0.3–5). The mean percentage decrease in SULmax was 78% (range, 25% to 100%). For the 1 patient whose tonsillar primary could not be discriminated from Waldeyer’s ring lymphoid tissue with PET scan, there was agree-ment between CT and endoscopy. This patient had a complete response to the induction-selection cycle of chemotherapy as determined by both CT and endoscopic assessment and was subsequently treated with concomitant chemotherapy and radia-tion per protocol. Following compleradia-tion of the pro-tocol, the patient underwent a selective neck dis-section due to N2a nodal disease staged at initial presentation. The patient remains free of disease 4 years postcompletion of his cancer treatment.
FDG avid regional nodal metastases were present in 10 of the 12 patients. The mean SUL-max value of all the nodal metastases was 4.05 at time of first scan (range, 2.7–7.3), 1.64 at time of second scan (range, 0–3.8), and an overall decrease in SULmax equal to 2.41 (0–4.9). The re-gional response for each patient as assessed by visual estimation was as follows: 2 patients with no response, 2 patients with a partial response, and 3 patients each with near complete and com-plete responses. Given the small sample size in this study, we were unable to draw further conclu-sions regarding (1) the measured response in the neck and recurrence at distant sites for patients who responded at their primary site and (2) meas-ured response in the neck and pathologic evidence of nodal disease for those patients who subse-quently underwent planned neck dissection.
At 5 years of follow-up, there were 3 recur-rences in this patient population. This recurrence rate is consistent with the recurrence rate in the parent trial.5,6The low recurrence rate precluded analysis of response with disease-specific survival.
DISCUSSION
estimation of tumor response to induction chemo-therapy. The level of evidence is high as this trial was nested in a phase II, prospective clinical trial. In addition, temporal bias was minimized because all the tests were obtained within a 24-hour pe-riod. These preliminary findings strongly support the broader evaluation of PET in the assessment of tumor response to induction chemotherapy in the oropharynx as long as the tumor can be discri-minated from the surrounding lymphoid tissue.
CT was also assessed but was not as good as FDG-PET for assessing tumor response. CT was less specific for evaluation of posttreatment head and neck cancers because of associated, diffuse soft tissue edema,1,13CT perfusion (CTP) imaging has thus been proposed as a new, possibly better evaluation of tumor response. Commercially available CTP software supplements morphomet-ric data with functional parameters of perfusion. Significant perfusion differences of blood flow, blood volume, mean transit time, and capillary permeability have been found in untreated head and neck SCC compared with adjacent normal tis-sue.1CTP was performed at the time of CT in 9 of the 12 patients in our study and recently reported. A higher level of pretreatment blood volume was found to have a significant (p <.05) correlation with endoscopic tumor response to induction chemotherapy. CTP is very promising but pro-spective testing will need to be done to develop level 2 or better evidence. One reason for concern with CTP is lower correlation scores for tumor response when compared with endoscopy than FDG-PET when compared with endoscopy. When FDG-PET is compared with endoscopic tumor response as a continuous variable, the values match more closely than the values found with CTP, suggesting that the PET kappa value found for FDG-PET was more robust.
Successful functional imaging of malignancy with FDG-PET is dependent on multiple variables including the tumor type, lesion size, proliferation rate, density of viable versus necrotic cells, tempo-ral proximity to therapy, and associated inflam-mation or infection. Benign lesions, such as tonsil-lar lymphoid tissue or inflammatory/infectious foci can take up sufficient FDG, leading to false positives.14The risk for false positives emphasizes the importance of an initial endoscopy for the staging of oropharyngeal SCC. Without an initial endoscopy, a false positive in Waldeyer’s ring can-not be adequately assessed. If the PET scan is showing enhancement in Waldeyer’s ring and the surgical endoscopy does not confirm tumor in the
same location, the PET should be used with cau-tion for assessment of tumor response. The results of this study support PET for assessing tumor response to induction chemotherapy, but only af-ter staging endoscopy and confirmation that the PET scan is accurately reporting the location of the tumor. In this study, we had 1 patient who had bilateral tonsillar hypertrophy prior to treatment. The tumor was unilateral in 1 of the tonsils but the PET scan showed bilateral FDG avid tonsils. The surgeon was blinded to the PET findings per protocol so the PET findings did not affect decision making. In the analysis phase of the study, after accrual was complete, the patient with bilateral FDG avid tonsils was excluded from the kappa analysis because this patient would have been identified prior to treatment as a patient in whom PET imaging would be of limited utility in assess-ing tumor response.
This nested study was designed on the knowl-edge that PET was useful in other sites for predict-ing tumor response with induction chemotherapy; thus, we chose to evaluate its application in assessing tumor response to induction chemother-apy for the purpose of modifying treatment.15–17 FDG-PET may also enable further individualiza-tion of organ preservaindividualiza-tion treatment. Given the genetic and biological heterogeneity of SCC of the oropharynx, it is likely that the extent of response to chemotherapeutic agents is unique to each patient.6 Such an individualized treatment approach increases the likelihood of the treatment being tailored to the physiology of the tumor. Given the variability of patients, variability of tu-mor biology, and the plethora of imaging techni-ques available, it is difficult to know which imag-ing study is optimal for assessimag-ing tumor response when designing a clinical trial. This study pro-vides preliminary data with respect to assessment of tumor response to induction chemotherapy for patients with oropharyngeal cancer.
our findings and to determine the value of making treatment decisions based on initial tumor response.
REFERENCES
1. Gandhi D, Hoeffner EG, Carlos RC, Case I, Mukherji SK. Computed tomography perfusion of squamous cell carcinoma of the upper aerodigestive tract. Initial results. J Comput Assist Tomogr 2003;27:687–693. 2. Gandhi D, Chepeha DB, Miller T, et al. Correlation
between initial and early follow-up CT perfusion param-eters with endoscopic tumor response in patients with advanced squamous cell carcinomas of the oropharynx treated with organ-preservation therapy. AJNR Am J Neuroradiol 2006;27:101–106.
3. Urba S, Wolf G, Eisbruch A, et al. Single-cycle induction chemotherapy selects patients with advanced laryngeal cancer for combined chemoradiation: a new treatment paradigm. J Clin Oncol 2006;24:593–598.
4. Induction chemotherapy plus radiation compared with surgery plus radiation in patients with advanced laryn-geal cancer. The Department of Veterans Affairs Laryn-geal Cancer Study Group. N Engl J Med 1991;324:1685– 1690.
5. Worden FP, Urba S, Bradford C, et al. One cycle of induction chemotherapy (IC) in advanced oropharyngeal cancer (SCCOP) to select patients for organ preservation (OP). Proc Am Soc Clin Oncol 2005;16S:5512.
6. Worden FP, Kumar B, Lee JS, et al. Chemoselection as a strategy for organ preservation in advanced oropharynx cancer: response and survival positively associated with HPV16 copy number. J Clin Oncol 2008;26:3138–3146. 7. Brucher BL, Weber W, Bauer M, et al. Neoadjuvant
ther-apy of esophageal squamous cell carcinoma: response
evaluation by positron emission tomography. Ann Surg 2001;233:300–309.
8. Nakamoto Y, Zasadny KR, Minn H, Wahl RL. Reproduci-bility of common semi-quantitative parameters for evalu-ating lung cancer glucose metabolism with positron
emission tomography using 2-deoxy-2-[18F]fluoro-D
-glu-cose. Mol Imaging Biol 2002;4:171–178.
9. Zasadny KR, Wahl RL. Standardized uptake values of normal tissues at PET with
2-[fluorine-18]-fluoro-2-deoxy-D-glucose: variations with body weight and a
method for correction. Radiology 1993;189:847–850. 10. Cohen J. A coefficient of agreement for nominal scales.
Educ Psychol Meas 1960;20:37–46.
11. Sackett DL, Haynes R, Tugwell P, Guyatt GH. Clinical epidemiology: a basic science for clinical medicine, 2nd ed. Lippincott Williams & Wilkin; Boston, MA: 1991. 12. Landis JR, Koch GG. The measurement of observer
agreement for categorical data. Biometrics 1977;33:159– 174.
13. Mukherji SK, Mancuso AA, Kotzur IM, et al. Radiologic appearance of the irradiated larynx. II. Primary site response. Radiology 1994;193:149–154.
14. Strauss LG. Fluorine-18 deoxyglucose and false-positive results: a major problem in the diagnostics of oncological patients. Eur J Nucl Med 1996;23:1409–1415.
15. Bassa P, Kim EE, Inoue T, et al. Evaluation of preopera-tive chemotherapy using PET with fluorine-18-fluoro-deoxyglucose in breast cancer. J Nucl Med 1996;37:931– 938.
16. Schelling M, Avril N, Nahrig J, et al. Positron emission tomography using [(18)F]fluorodeoxyglucose for monitor-ing primary chemotherapy in breast cancer. J Clin Oncol 2000;18:1689–1695.
17. Smith IC, Welch AE, Hutcheon AW, et al. Positron
emis-sion tomography using [(18)F]-fluorodeoxy-D-glucose to