arXiv:astro-ph/0012191v1 8 Dec 2000
Preprint typeset using LATEX style emulateapj v. 04/03/99
CONFUSION OF DIFFUSE OBJECTS IN THE X-RAY SKY
G. Mark Voita, August E. Evrardb, Greg L. Bryanc,d
aSpace Telescope Science Institute, 3700 San Martin Drive, Baltimore, MD 21218, [email protected]
bDepartments of Physics and Astronomy, University of Michigan, Ann Arbor, MI 48019
cDepartment of Physics, Massachusetts Institute of Technology, Cambridge, MA 02139
dHubble Fellow
ApJ Letters, submitted 28 September 2000, accepted 5 December 2000
ABSTRACT
Most of the baryons in the present-day universe are thought to reside in intergalactic space at
tem-peratures of 105−7 K. X-ray emission from these baryons contributes a modest (∼10%) fraction of the
∼1 keV background whose prominence within the large-scale cosmic web depends on the amount of
non-gravitational energy injected into intergalactic space by supernovae and AGNs. Here we show that the virialized regions of groups and clusters cover over a third of the sky, creating a source-confusion prob-lem that may hinder X-ray searches for individual intercluster filaments and contaminate observations of distant groups.
Subject headings: cosmology: diffuse radiation — intergalactic medium — X-rays: general
1. INTRODUCTION
Most of the baryons in the universe remain undetected. We believe they exist because primordial nucleosynthesis predicts a baryonic matter density amounting to a few per-cent of the critical density (ρcr), while the baryons
associ-ated with stars and gas in galaxies make up less than half a percent ofρcr (e.g., Fukugita, Hogan, & Peebles 1998).
Within clusters of galaxies the intergalactic baryons are obvious because gravitational compression causes them to glow prominently in X-ray light. Elsewhere they are much more difficult to see.
Simulations indicate that a large proportion of the uni-verse’s baryons currently reside outside of clusters in the
form of diffuse 105−7 K gas associated with groups and
filaments of galaxies (e.g., Cen & Ostriker 1999; Dav´e et al. 2000). The low surface brightness of this warm gas has so far made it very challenging to study. Apart from some tantalizing regions of enhanced X-ray surface bright-ness (Wang, Connolly, & Brunner 1997; Kull & Bohringer 1999; Scharf et al. 2000) and a few O VI absorption fea-tures (Tripp, Savage, & Jenkins 2000) we have no positive detections of it.
Taken together, the intergalactic baryons lying inside and outside of clusters ought to contribute a non-negligible
fraction of the ∼ 1 keV X-ray background. If these
in-tergalactic gases were heated by purely gravitational pro-cesses, they would contribute at least 30% of the observed
∼ 1 keV X-ray background (Pen 1999; Wu, Fabian, &
Nulsen 1999). However, the point-source contribution at these energies is now estimated to be at least 80% (Miyaji, Hasinger, & Schmidt 2000; Mushotzky et al. 2000), im-plying that less than 20% of this background can be truly diffuse. Non-gravitational energy input by supernovae and perhaps active galactic nuclei can alleviate this discrep-ancy because these energy sources raise the entropy of the intergalactic gas, making it harder to compress and thereby decreasing its contribution to the X-ray back-ground.
Analyses of the temperature-luminosity relation of clus-ters and groups likewise suggest that a significant amount of non-gravitational heating has occurred (Evrard & Henry 1991, Kaiser 1991). The energy injected per particle ap-pears to be comparable to the potential depth of a typ-ical group, which would severely affect the properties of groups (e.g., Ponman, Cannon, & Navarro 1999). Models in which early energy injection by supernovae preheats the intergalactic medium can plausibly account for this non-gravitational heating. The motivation for detecting inter-galactic baryons outside of clusters is therefore twofold: Detecting this matter would reveal where the baryons im-plied by primordial nucleosynthesis have gone, and mea-suring the entropy level of these baryons would provide a key constraint on supernova energy injection into inter-galactic space.
This paper shows that detecting X-ray emission from in-tercluster structures may prove quite challenging because the virial radii of groups and clusters out to high redshift cover a significant fraction of the sky. Much of the cosmic X-ray surface brightness, once point sources are removed, will come from this confused patchwork of groups and clus-ters, making it difficult to identify true intercluster gas and to separate group emission from other virialized sources along a common line of sight.
2. INTERCLUSTER MEAN FREE PATH
Among the major sources of uncertainty that could com-plicate observations of the low surface-brightness struc-tures in which intergalactic baryons reside are other col-lapsed structures along the same line of sight. The prob-ability that any given sight line will encounter a virial-ized structure with kT ∼> 0.5 keV turns out to be of or-der unity. Here we will estimate that probability using a Press-Schechter approach.
For simplicity, let us assume that the distribution of primoridal perturbations is Gaussian with a dispersion
∝ M−α on mass scale M. The comoving differential
then be approximated by dn/dνc =n0(νc/ν0)−1/αe−ν
2 c/2
(Press & Schechter 1974). In this expression, νc is
the critical threshold for virialization of a
perturba-tion at mass scale M in units of standard deviations,
ν0 is the value of νc at some fiducial mass scale M0,
and n0 = (2/π)1/2(3H02ΩM/8πGM0), where H0 =
100hkm s−1Mpc−1is the current value of the Hubble
con-stant and ΩMis the matter density of the universe in units
of the critical density.
An appropriate cross-section for a virialized object is σ200 = πr2002 , where r200 is the radius within which the
mean overdensity is 200 times the critical density. If we define the mass of a virialized object to be the mass within r200, then σ200(M) = π(GM/100H2)2/3, where H is the
Hubble constant at the redshift of interest. Thus, a mean
free path λ200 between virialized objects more massive
thanM can be defined by
λ−1 200(M) =
Z ∞
νc(M)
σ200
dn dνc
dνc (1)
= 2−pσ
0n0ν01/3αΓ
1−p, νc2(M)/2 ,
where Γ(a, x) is an incomplete gamma function, p =
(1 + 3α)/6α, andσ0=σ200(M0).
In order to relate this equation to observations, we
choose T0 = 5 keV to be our fiducial temperature
and apply the low-z mass-temperature relation: kTX =
(8 keV)(M/1015h−1M
⊙)2/3 (Evrard, Metzler, & Navarro 1996; Horner, Mushotzky, & Scharf 1999). The fiducial mass and cross-section then becomeM0= 5×10¹⁴h−1M⊙
andσ0= 5.2h−2Mpc2. To findν0, we fit the integral
tem-perature function R∞
νc(T0)(dn/dνc)dνc to the number den-sity of > 5 keV clusters, yielding ν0 ≈ 2.8 (Donahue &
Voit 1999). Thus, for α = 1/4, which corresponds to a
perturbation slope in wavenumber space ofnk =−1.5, we
arrive at
c H0λ200(M)
= 0.013Γ[1−p, ν
2
c(M)/2]
Γ[1−p, ν02/2] . (2)
In other words, the probability that a line of sight through the low-redshift universe will intercept a>5 keV cluster is∼10−2.
Groups with temperatures of 0.5-2 keV are much more common than rich clusters and correspondingly cover a much higher percentage of the sky. To estimate that
cover-ing factor, we extrapolatec/H0λ200down to temperatures
∼0.5 keV assuming α≈1/4−1/6 (nk ≈ −1.5 to−2.0).
For these cooler objects, we findc/H0λ200≈0.6−1.3.
Be-cause this quantity is of order unity, the projected virial radii of objects with potential depths∼>0.5 keV ought to significantly overlap one another.
This calculation is, of course, quite simplistic in that it fails to account for factors like clustering of virialized objects, evolution in their comoving number density, the geometry of the universe, and the known tendency for the Press-Schechter formula to overestimate the abundance of group-size halos. Nevertheless, it illustrates two important points: (1) observations of distant groups will be corrupted at some level by superpositions with other virialized ob-jects, and (2) distinguishing true intercluster baryons from those within virialized structures may prove to be quite difficult, even under ideal observational conditions.
3. COVERING FACTOR OF SIMULATED GROUPS AND
CLUSTERS
Large-scale cosmological simulations offer a way to as-sess the confusion of projected groups more rigorously. The largest such simulations performed to date are the Hubble Volume simulations of the Virgo Consortium,
which model comoving cubes 2−3 Gpc on a side,
suf-ficient to reproduce lines of sight stretching most of the way through the observable universe (Evrard 1999; Mac-Farland et al. 1999; Frenk et al. 2000). Because of the magnitude of the computational task, the simulations are baryon-free, tracking only the gravitationally-driven be-havior of dark-matter particles. Here we will show that total solid angle covered by the virial radii of groups and clusters resolved in these simulations can approach half of the entire sky.
Hubble Volume simulations have been performed for two
cosmologies: τCDM (ΩM = 1.0, ΩΛ = 0.0) and ΛCDM
(ΩM = 0.3, ΩΛ = 0.7). Several “light-cone” catalogs,
which list the mass and position of each object within the past light-cone of a virtual observer located within the simulation volume, have been compiled from each simu-lation, and the catalogued objects correspond to spher-ical regions whose mean mass density is 200 times the critical density. Because the masses of individual parti-cles in these simulations are ≈ 2×10¹²h−1M⊙, a
typi-cal group contains <100 particles. The catalogs list ob-jects down to a lower limit of 12 particles, too few to model the internal properties of a group but enough to qualify as a significant density concentration. An angular size for each simulated cluster or group can be computed from its catalogued mass and redshift. The coordinate
distance of such an object is r(z) =Rz
0 c/H(z)dz, where
H(z) =H0[ΩM(1 +z)3+ ΩΛ]1/2 in a flat universe, and its
physical diameter is 2r200. These quantities combine to
give an angular diameter of 2r200(1 +z)/r(z).
The most convenient type of Hubble Volume catalog for the purpose of studying projection effects is the octant catalog which records cluster properties along a light cone viewed from a corner of the simulation cube. For ΛCDM and τCDM the limiting redshifts of the octant catalogs
arezmax= 1.45 and 1.25, respectively. Summing the
pro-jected solid angles of clusters out to the limiting redshift and mass of each catalog, we find that the total area cov-ered by virialized objects is 46% of the sky in the ΛCDM
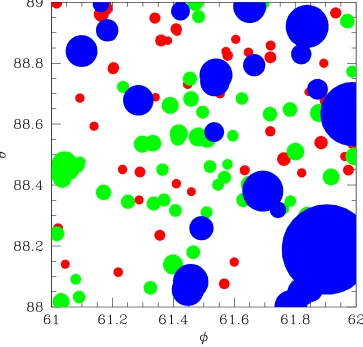
case and 52% of the sky in the τCDM case. Figure 1
shows the projected virial radii of clusters and groups more
massive than 2.7×10¹³M⊙ (12 particles) within a
typi-cal square degree of the ΛCDM simulation. Objects with 0 < z <0.5 are shown in blue, those with 0.5 < z <1.0 are in green, and those with 1< z <1.45 are in red. Sig-nificant overlap is evident in many cases, and accounting for that overlap lowers the net sky coverage to 33% for
ΛCDM and 35% forτCDM. These figures should be
con-sidered lower limits for two reasons: Clusters and groups more distant than the simulations’ redshift limits will pro-vide additional coverage, and comparisions of the Hubble Volume simulations with smaller-scale ones indicate that the Hubble Volume catalogs are 10-20% incomplete at the low-mass end (Jenkins et al. 2000).
Because highly redshifted groups do not contribute
tem-peratures of projected virialized objects are also worth in-vestigating. Using an evolving mass-temperature relation to convert from mass to temperature (Voit 2000) and
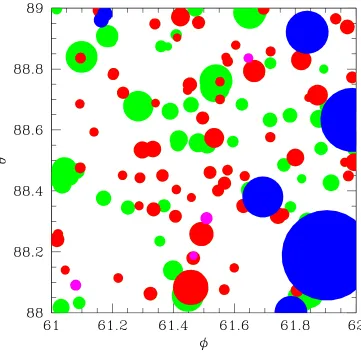
di-viding each temperature by 1 +z, we can assign an
appar-ent temperature to each cluster and group in the Hubble Volume catalogs. Figure 2 shows the same field as Fig-ure 1, color-coded by apparent temperatFig-ure. Objects with kT /(1+z)>1 keV are shown in blue, those with 0.5 keV< kT /(1 +z)<1 keV in green, 0.5 keV< kT /(1 +z)<1 keV
in red, andkT /(1 +z)<0.25 keV in magenta. The
ma-jority of the sky coverage in this catalog evidently comes from objects withkT /(1 +z)>0.25 keV.
4. SURFACE BRIGHTNESS OF VIRIALIZED OBJECTS
Even though virialized objects cover a large per-centage of the sky, much of that solid angle corre-sponds to low surface-brightness emission. Current
es-timates of the mean ∼ 1 keV surface brightness
at-tributable to intergalactic baryons are in the 1−4 ×
10−16erg cm−2s−1arcmin−2range (Wang & Ye 1996; Wu
et al. 1999; Pen 1999; Dav´e et al. 2000). In this
sec-tion we crudely estimate the surface brightnessI200 of a
virialized object at its virial radius and show that it is probably within an order of magnitude of the mean dif-fuse surface brightness, implying that these objects blend into the background in the neighborhood of their virial radii.
X-ray luminous clusters generally have surface bright-ness profiles that are adequately represented by the rela-tion IX(b) = I0[1 + (b/bc)2]−3β+1/2, where b is the
pro-jected angular radius from the center of the cluster,bc is
the angular equivalent of the physical core radiusrc, and
the parameterβ reflects the behavior ofIX at large radii
(Cavaliere & Fusco-Femiano 1978). Integrating this
ex-pression for a typical value ofβ = 2/3 gives the cluster’s
X-ray flux: FX = 2πb2cI0. Forb(r200)≫bc, we then obtain
I200≈ LX
8π2r2 200
rc
r200
(1 +z)−4 , (3)
whereLX is the X-ray luminosity of the cluster.
To derive a numerical value for I200, we adopt
the core radius-luminosity relation of Jones et al. (1998), rc = (125h−1kpc)(LX/1.2×1044h−2erg s−1)0.2,
and assume r200 ∝ T1/2H−1. We also construct
a ROSAT-band luminosity-temperature relation from
the relations of Markevitch (1998): LX = 2.5 ×
1043h−2erg s−1(T /2.3 keV)ζ, where ζ = 2.02 for T >
2.3 keV and ζ = 2.64 for T < 2.3 keV. For
the fiducial temperature of 5 keV, we obtain I200 ∼
10−15erg cm−2s−1arcmin−2(H/H
0)3(1 +z)−4, very
chal-lenging for ROSAT but well within the capabilities of XM M/N ewton and Chandra. Note also that the H3
factor owing to the increased high-zdensity scale tends to
offset the (1 +z)−4 surface-brightness dimming.
On group scales,I200drops by an order of magnitude to
below the presumptive mean surface brightness of the in-tergalactic medium. However, this scaling presumes that the luminosity-temperature and core radius-luminosity re-lations we have adopted can be extrapolated to ∼<1 keV.
Observations of the LX-T relation for groups show that
this relation in fact steepens at low temperatures and its scatter widens (e.g., Helsdon & Ponman 2000). The scal-ing ofrc is even less secure, given the degeneracy between
β andrc in fits to flattened surface-brightness profiles.
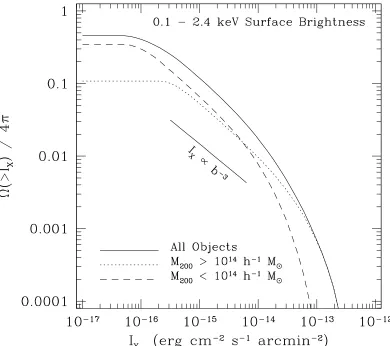
Combining these surface brightness estimates with the Hubble Volume catalogs, we can also assess the distribu-tion of X-ray surface brightness owing to virialized ob-jects. Figure 3 illustrates the fractional area Ω(> IX)
covered by diffuse, virialized gas with a ROSAT-band
surface-brightness greater than IX. Splitting the sample
into objects with masses less than 1014h−1M
⊙ and those
greater than that value shows that the low-mass objects dominate the diffuse surface-brightness distribution below 10−15erg s−1cm−2arcmin−2, raising the possibility that
the properties of these lower-mass systems might prof-itably be studied through statistical analyses of the dif-fuse X-ray background, circumventing the difficulties of selecting and modelling X-ray groups in an unbiased way. In practice, however, such studies will have to contend with background counts generated by charged particles, which can be comparable to the astrophysical background
in ChandraandXMM/Newtonobservations.
These crude estimates show that while the surface-brightness profiles of rich clusters should dominate the mean background emission from other diffuse structures to at leastr200, the same is not necessarily true for groups.
Emission from near the virial radii of groups could be se-riously diluted by other emission from unassociated gas along the same line of sight, particularly that from other groups seen in projection. Numerical simulations account-ing for these projection effects will be needed to establish the level of this contamination.1
5. SUMMARY
This paper has shown that the projected virial radii of groups and clusters cover much of the sky. Estimates of this covering factor based on Press-Schechter analy-sis place the covering factor of objects ∼> 0.5 keV near unity. Calculations of the group-cluster covering factor based on the Hubble Volume simulations corroborate this
estimate. The virial regions of simulated objects with
kT /(1 +z)>0.25 cover at least a third of the sky in both τCDM and ΛCDM cosmologies, meaning that projection effects could potentially contaminate X-ray observations of distant groups. These same projection effects will also complicate the search for emission from warm baryons as-sociated with intercluster filaments. Untangling the large-scale structures seen in deep X-ray images may therefore require additional information from optical redshift sur-veys that trace the skeleton of dark matter upon which intergalactic baryons are draped.
The authors would like to thank Caleb Scharf and Megan Donahue for useful suggestions. AEE is supported by AST-9803199 and NASA NAG5-8458. GLB is sup-ported by NASA through Hubble Fellowship grant HF-01104.01-98A from the Space Telescope Science Institute, which is operated under NASA contract NAS6-26555. This research uses data products made available by the Virgo Consortium.
1
REFERENCES
Cavaliere, A., & Fusco-Femiano, R. 1978, A&A, 70, 677 Cen, R., & Ostriker, J. P. 1999, ApJ, 514, 1
Croft, R. et al. 2000, astro-ph/0010345 Dav´e, R. et al. 2000, astro-ph/0007217
Donahue, M. E., & Voit, G. M. 1999, ApJ, 523, 137L
Evrard, A. E. 1999, in Evolution of large scale structure: from recombination to Garching, eds. A. J. Banday, R. K. Sheth, L.N. da Costa (Garching: ESO), p.249
Evrard, A. E., & Henry, J. P. 1991, 383, 95
Evrard, A. E., Metzler, C. A. & Navarro, J. F. 1996, ApJ, 469, 494 Frenk, C. S. et al. 2000, astro-ph/0007362
Fukugita, M., Hogan, C. J., & Peebles, P. J. E. 1998, ApJ, 503, 518 Helsdon, S. F., & Ponman, T. J. 2000, MNRAS, 315, 356
Horner, D. J., Mushotsky, R. F., & Scharf, C. A. 1999, ApJ, 520, 78 Jenkins, A. 2000, MNRAS, in press, astro-ph/0005260
Jones, L. R., Scharf, C., Ebeling, H., Perlman, E., Wegner, G., Malkan, M., & Horner, D. 1998, ApJ, 495, 100
Kaiser, N. 1991, ApJ, 383, 104
Kull, A., & Bohringer, H. 1999, A&A, 341, 23 Lacey, C., & Cole, S. 1993, MNRAS, 262, 627
MacFarland, T., Couchman, H. M. P., Pearce, F. R., Pilchmeier, J. 1999, New Astronomy, 3, 687
Miyaji, T., Hasinger, G., & Schmidt, M. 2000, A&A, 353, 25 Mushotzky, R. F., Cowie, L. L., Barger, A. J., Arnaud, K. A. 2000,
Nature, 404, 459 Pen, U. 1999, ApJ, 510, L1
Ponman, T. J., Cannon, D. B., & Navarro, J. F. 1999, Nature, 397, 135
Press, W., & Schechter, P. 1974, ApJ, 187, 425 Rauch, M., et al. 1997, ApJ, 489, 7
Scharf, C., Donahue, M., Voit, G. M., Rosati, P., & Postman, M. 2000, ApJ, 528, L73
Tripp, T., Savage, B. D., & Jenkins, E. B. 2000, ApJ, 534, L1 Wang, Q. D., Connolly, A., & Brunner, R. 1997, ApJ, 487, L13 Wang, Q. D., & Ye, T. 1996, New Astronomy, 1, 245
Weinberg, D., Miralda-Escude, J., Hernquist, L., & Katz, N. 1997, ApJ, 490, 564
Fig. 1.—Projected virial radii of simulated clusters and groups in a ΛCDM cosmology color-coded by redshift: 0 < z <0.5 in blue, 0.5< z <1 in green, and 1< z <1.45 in red. The lower mass limit is 2.7×10¹³M⊙. The polar (θ) and azimuthal (φ) coordinates of the
Fig. 2.—Projected virial radii of simulated clusters and groups in a ΛCDM cosmology color-coded by apparent temperature: kT /(1 +z)>