R E S E A R C H A R T I C L E
Open Access
Opioid use after total hip arthroplasty
surgery is associated with revision surgery
Maria C. S. InacioMS, PhD
1*, Nicole L. PrattPhD
1,2, Elizabeth E. RougheadPhD
1,2, Elizabeth W. PaxtonMA
3and
Stephen E. GravesMD, PhD
4Abstract
Background:Pain is an indication for total hip arthroplasty (THA) and it should be resolved post-surgery. Because patients’pain is typically treated pharmacologically we tested whether opioid use can be used as a surrogate for patient-reported pain and as an indicator for early surgical failure. Specifically, we evaluated whether the amount of opioids taken within the year after THA was associated with one and five years risk of revision surgery.
Methods:A cohort of 9943 THAs (01/2001-12/2012) was evaluated. Post-operative opioid use was the exposure of
interest and cumulative daily oral morphine equivalent (OME) amounts were calculated. Total OMEs/90-day periods were categorised into quartiles. Revisions within one and five years were the outcomes of interest.
Results:Of the THAs, 2.0 % (N= 200) were revised within one year and 4.2 % (N= 413) within five years. After adjustments for gender, age, surgical indication, co-morbidities, and other analgesics, revision was associated with amount of OMEs in the second quarter after THA (days 91–180 after discharge). Patients on medium-high amounts of OME (400-1119 mg) had higher risk of one (hazard ratio (HR) = 2.22, 95 % CI 1.08-4.56) and five year (HR = 1.66, 95 % CI 1.08-2.56) revision than a patient not taking opioids. During the same period, patients taking the highest amounts of OMEs (≥1120 mg) had a 2.64 (95 % CI 1.03-6.74) times higher risk of one year and a 2.11 (95 % CI 1.13-3.96) times higher risk of five year revision.
Conclusions:Opioid use 91–180 days post-surgery is associated with higher risk of revision surgery and therefore is an early and useful indicator for surgical failure.
Keywords:Opioids, Total hip arthroplasty, Revision, Analgesic drugs
Background
Pain is one of the main indications for total hip arthro-plasty (THA) and presence of pain post-operatively is an important indicator of procedure’s success [1, 2]. When pain is still present post-operatively, and is not related to another condition, it is typically the sign of a surgical com-plication or a non-successful outcome. Post-operative chronic pain has been estimated to occur in 7 % to 23 % of THA patients [3]. Additionally, 4 % of primary THAs are revised due to pain alone as post-operative pain is as-sociated with revision THA [4, 5].
Typically, musculoskeletal pain is assessed using pa-tient reported outcome tools [6]. While papa-tient reported
outcomes tools can be useful in certain settings, the in-struments used to measure patient reported outcomes have varying validity and reliability, and can be challen-ging to implement because of cost, and difficulty inte-grating with workflows and gaining patient participation [2, 7]. Opioids are recommended for moderate to severe musculoskeletal pain after other pharmacological anal-gesic interventions have failed, are contra-indicated, or when refractory pain is present [8–10]. Because patients’ pain is usually treated pharmacologically, and opioids are only recommended and should therefore only be prescribed to a patient when enough pain is present, it is possible this could be used as a surrogate for patient re-ported pain assessment. Therefore, pharmaceutical data offers a potentially efficient and economical approach for assessing pain, which can be implemented as part of the surveillance for large cohorts of patients for early signals of potential surgical success.
* Correspondence:maria.inacio@unisa.edu.au
1Medicine and Device Surveillance Centre of Research Excellence, Sansom Institute, School of Pharmacy and Medical Sciences, University of South Australia, GPO Box 2471, Adelaide 5001 South Australia, Australia Full list of author information is available at the end of the article
In order to determine whether pain medication use could be used as an indicator for THA success, we evaluated the prevalence of pain medication use in pa-tients after THA surgery and its association with revi-sion surgery. Specifically, we evaluated whether the amount of opioids taken over the year after a primary THA procedure was associated with the one year and five years risk of revision after adjusting for other an-algesic use, patient demographics, co-morbidities, and indications for surgery.
Methods
Study design, setting, and sample
A retrospective cohort study of Australian patients undergoing THA from 01/01/2001 to 31/12/2012 was undertaken using data from the Department of Veterans Affairs (DVA) administrative health claims database. In the dataset, medications are coded ac-cording to the World Health Organisation Anatomic, Therapeutic and Chemical classification (ATC), and the Australian Pharmaceutical Benefits Schedule (PBS) item codes [11, 12]. Hospitalisations are coded ac-cording to the International Classification of Diseases, 10th Revision, Australian Modification (ICD-10-AM) [13] scheme.
The study sample included patients aged≥18 years old that underwent primary, elective, unilateral THA proce-dures (identified using ICD-10-AM code 4931800). Patients with multiple arthroplasties (inclusive of knee, resurfacing procedures, or hip fractures) within 365 days of the index THA were not included. Additionally, any patients with history of malignancy or lymphoma (ICD-10-AM C00.x–C26.x, C30.x–C34.x, C37.x–C41.x, C43.x, C45.x–C58.x, C60.x–C76.x, C81.x–C85.x, C88.x,C90.x– C97.x, C77.x–C80.x, C81.x–C85.x, C88.x, C96.x, C90.0, C90.2) or dispensed antineoplastic and immunomodulat-ing agents within their medication history (ATC codes L01*) were not included. The obtained sample had 10,018 patients, of which 75 (0.7 %) were excluded as they were considered outliers with their opioid use being in the 99th percentile (i.e. > 7350 mg of oral morphine equivalents (OME) in days 0–90, >9860 OME mg in days 91–180, >11088 OME mg in days 181–270, and > 9840 OME mg in days 271–260) of the total use. The final study sample had 9943 patients.
Outcomes of interest
The main outcome of interest was revision within one year and five years. Using the hospitalisation dataset, the following ICD-10-AM procedure codes were used to identify revisions: 4932100, 4932400, 4932700, 4933000, 4933300, 4933900, 4934200, 4934500, and 4934600.
Exposure of interest
The cumulative daily amount, calculated as OME, of oral and transdermal opioid medication (ATC code N02A*), was calculated over the 360 days post discharge from the THA procedure [14]. OMEs were calculated using a standard conversion table to translate the dose and type of each opioid a patient received into one mor-phine equivalent dose [14] for overall comparison of an-algesic dose. Total post-THA oral morphine equivalents per 90 day exposure periods categorised into quartiles were the exposure of interest of this study. If a patient had a revision or died during the 360 day post-operative period, the amount of opioid exposure was calculated until the day before the event occurred. The cumulative OME daily dose was calculated by summing the total dose per day based on quantity of supply. The total OME for a 90 day exposure time was the sum of all OME daily doses for that period.
Covariates/confounders
Patient gender, age, primary diagnosis, co-morbidities, as well as prior opioid use, and pre- and post-operative non-steroidal anti-inflammatory drug (NSAID) use were evaluated as possible confounders. Counts of comorbid-ity were made using a modified RxRisk-V co-morbidcomorbid-ity measure, which identified 42 conditions [15]. In an at-tempt to further control for the possibility of confounding due to back pain (not specifically identified in the RxRisk-V), we used a previously published Australian back pain ICD-10-AM coding algorithm to identify patients with history or concurrent condition of back pain (2 years prior and post THA) [16, 17]. Pre-operative use of opioids was identified using the same method as the post-operative use (described in the exposure of interest section). NSAIDs use was identified with ATC codes M01A* (anti-inflammatory and antirheumatic products, non-steroids).
Statistical analysis
were included (N= 9735), in the third 90 days (days 181–270) period all survivors and non-revised cases from the second period were included (N= 9638), and in fourth period (days 271–360) all survivors and non-revised cases from the third period were included (N= 9552). The categories of OME total amount evaluated included no opioids (reference category), low (less that the lowest quartile of the total dose in that period), medium-low (between lowest quartile and median dose), medium-high (between the median dose and third quartile dose), and high (those taking more than the highest quartile of opioids). All models were adjusted for age (continuous), gender (male vs. female), primary diagnosis for THA surgery (primary coxarthrosis vs. other), co-morbidity disease count (continuous), history of back pain (yes vs. no), prior opioid total amount per 90 day period (continuous), and NSAIDs use (yes vs. no). In the last time period studied, the number of events was small (n= 24) and therefore a multivariable model was not created. Pro-portional hazard assumptions were met (checked using time-dependent variables), collinearity was checked using tolerance values (all values >0.10), and outliers were reviewed and excluded from the sample. The alpha level chosen for statistical significant was 0.05 and tests reported are two sided. SAS 9.4 (SAS Institute, Cary, NC, USA) was used for all analyses.
Ethics
Ethics approval was obtained from the Australian Department of Veterans’ Affairs (DVA, E010/010) and the University of South Australia (P099-10) Human Re-search Ethics Committees. A waiver of informed consent was obtained for this study due to the nature of the data used for this study.
Results
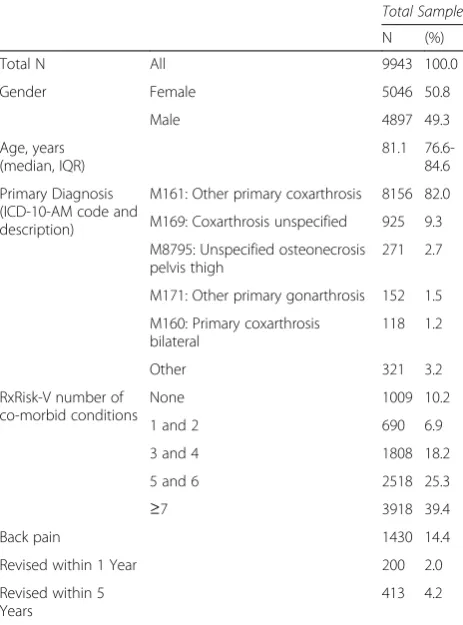
There were 9943 THAs evaluated, of which 2.0 % (N= 200) were revised within one year and 4.2 % (N= 413) within five years of their index procedure. The cohort was 50.8 % (N= 5046) female, the median age was 81.1 years old (interquartile range (IQR) = 76.6-84.6), and 82.0 % (N= 8156) had a diagnosis of primary coxar-throsis. The median number of co-morbidities patients had was five (IQR 3–8) and the prevalence of back pain was 14.4 % (N= 1430). See Table 1.
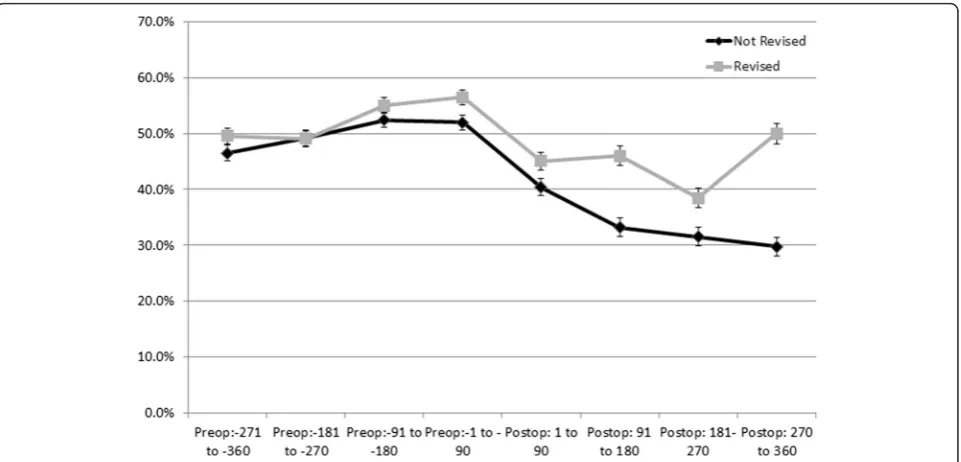
In patients who went on to be revised within one year, there was a higher proportion of pre (range 24.0 %-47.0 %) and post-operative opioids users (range 34.5 %-45.5 %), than in those not revised (pre range 19.1 %-35.5 % and post range 18.5 %-37.3 %), Fig. 1. Patients who went on to be revised within one year also had higher use of post-operative NSAID in each quarter after surgery (range 38.5 50.0 % compared to 29.7
%-40.3 %). Before the THA, however, the proportion of users taking NSAIDs was similar in both groups, Fig. 2. Similar proportions of opioid use were observed for cohorts of patients with five year estimates to one year estimates (data not shown).
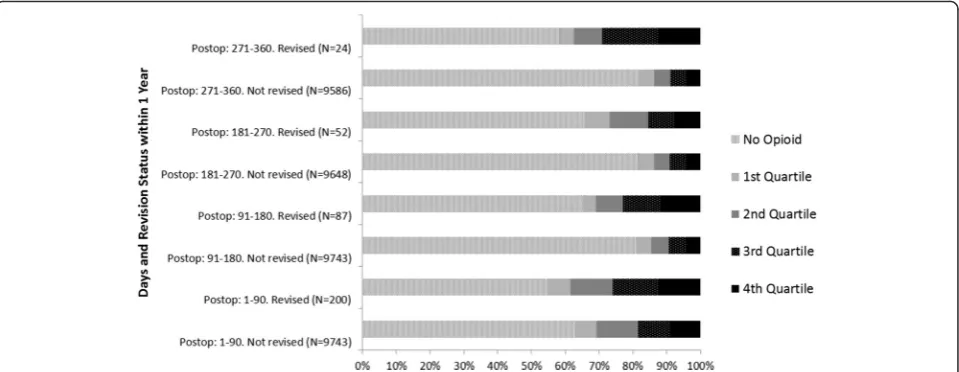
Revised patients used higher amounts of opioids (as measured by medium-high and high OMEs in each spe-cific exposure period) than those who were not revised. See Fig. 3 for OMEs taken by the patients by 90 day pe-riods (post THA) in patients who were revised within one year and those who were not. The categorisation by OME amounts and one and five year revision status are specified in Table 2.
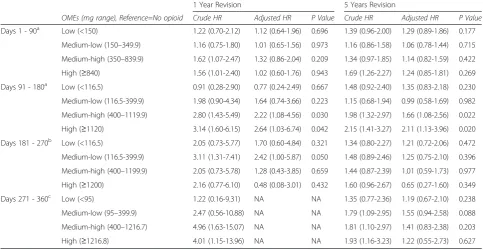
[image:3.595.305.537.100.413.2]After adjustments we found that the amount of OMEs used in the first 90 days after surgery was not associated with a higher risk of revision within one or five years. In the second 90 day period after THA (days 91 to 180), patients who had the medium-high amounts of OME (OME between 400 and 1119 mg) had a 2.22 (95 % CI 1.08-4.56) times higher risk of one year revi-sion and a 1.66 (95 % CI 1.08-2.56) times higher risk of five year revision than a patient that was not taking any opioids. During the same period, patients taking the highest amounts of OMEs (OME≥1120 mg) had a 2.64 Table 1Total Hip Arthroplasty Sample Description, 2001-2012
Total Sample
N (%)
Total N All 9943 100.0
Gender Female 5046 50.8
Male 4897 49.3
Age, years (median, IQR)
81.1 76.6-84.6
Primary Diagnosis (ICD-10-AM code and description)
M161: Other primary coxarthrosis 8156 82.0
M169: Coxarthrosis unspecified 925 9.3
M8795: Unspecified osteonecrosis pelvis thigh
271 2.7
M171: Other primary gonarthrosis 152 1.5
M160: Primary coxarthrosis bilateral
118 1.2
Other 321 3.2
RxRisk-V number of co-morbid conditions
None 1009 10.2
1 and 2 690 6.9
3 and 4 1808 18.2
5 and 6 2518 25.3
≥7 3918 39.4
Back pain 1430 14.4
Revised within 1 Year 200 2.0
Revised within 5 Years
413 4.2
IQR=Interquartile range. ICD - 10 - AM= International Classification of Diseases, 10th
(95 % CI 1.03-6.74) times higher risk of one year revi-sion and a 2.11 (95 % CI 1.13-3.96) times higher risk of five year revision. In the third 90 days post-operative period (days 181 to 270) there was not an association between the levels of OMEs and revision. Finally, in the last period evaluated (days 271–360) there was a
higher crude risk of one year revision in patients in the medium-high and high levels of OME but we could not adjust for other variables due to the small number of events (n= 24). For the same time period, there was not an adjusted higher risk of five years re-vision. See Table 3.
Fig. 1Proportion and 95 % Confidence Intervals of Patients Dispensed Opioids by 90 day Exposure Periods Pre- and Post-Total Hip Arthroplasty by 1 Year Revision Status
[image:4.595.55.540.87.341.2] [image:4.595.59.540.475.706.2]Discussion
In this elderly cohort of THA patients, we estimated the proportion of patients still taking pain relief at days 271 to 360 post-surgery to be between 19 % and 42 %, de-pending on whether they went on to be revised or not. These were the proportion of patients who were still tak-ing some opioid medications durtak-ing this period, a period which is no longer considered surgical recovery. Our re-sults are consistent with previous estimates that per-sistent post-operative pain occurs in 7 % to 23 % of primary THA patients [3]. When we investigated opioid use, we found higher amounts of opioid medi-cation taken after THA to be associated with higher risk of revision. Specifically, patients taking 400 mg-1120 mg and≥1120 mg total amounts of OMEs during days 91 to 180 post-operative, or 4-12 mg per day, had a higher likelihood of revision surgery within one year and five years.
Patient reported post-operative pain is an important clinical THA outcome. In addition to its value in clinic-ally assessing the procedure, it is also associated with other hard endpoints, such as revision surgery [18]. Britton et al. reported that patients with severe or mod-erate pain after surgery were more likely to have revi-sions than patients with stiffness [18]. Of the patients in their study with severe or moderate pain post-operatively (n= 351 out of 2268), 28 % (n= 100) had a revision within 2 years and 33 % (n= 115) within 5 years. In our cohort, 42 % of patients who went on to be re-vised were being treated for pain with opioids at one year post-operatively, a similar number of patients com-pared to Britton et al.’s study. In our study we also found the amount of opioid use, and not just whether opioids were being used, in the days 91–180, to be associated with a higher risk of revision. The prevalence of opioid
use and amount of use also continued to be higher in patients with revisions in the third and fourth quarter post-operative suggesting a consistent trend but the ac-tual risk of revision was not statistically significantly dif-ferent, which could be due to the smaller number of events in these models or possibly that the later use of opioids is not as helpful as an indicator for revision.
Only one study, to our knowledge, reported both the prevalence of pain (8.1 %) and opioid use (2.3 %) at two years post-operatively. This study did not evaluate any association of these indicators with revision surgery [19]. The prevalence of pain, measured either by the patient reported instruments or opioid use, reported by Singh et al.’s study is significantly lower than both Britton et al.’s and our study. This is possibly due to the assessment be-ing based on patients’ reported estimates rather than pharmaceutical records, the former which could suffer from response bias [19]. We are not aware of studies that have included opioid use as a proxy for pain preva-lence after joint arthroplasty and therefore no direct comparison to our observations can be made. Addition-ally, no comparisons to other literature can be made to our observations of a higher risk of revision and total amount of opioid use.
[image:5.595.59.539.88.274.2]an attempt to evaluate the independent effect of opioid at each time period with the risk of revision (i.e. remove any confounding introduced by other analgesic use).
Surrogate measures for the areas evaluated by pa-tient reported outcome tools, such as analgesic uptake for pain management, are viable alternatives to trad-itional ascertainment of patient reported outcomes. Prescription medication claims data are available in cer-tain countries, and with proper understanding of the limitations involved with these data, they are a possible source for monitoring signals of potential poorer out-comes [22–25]. In this study, we were able to obtain the
patients’ prescription dispensing and evaluate whether the levels of opioid intake during the study period were associated with the risk of revision surgery. Dispensing of opioids seems to be a viable alternative for capturing patient’s pain within 91–180 days post-operative and of-fers an opportunity to identify patients at high risk of revision surgery.
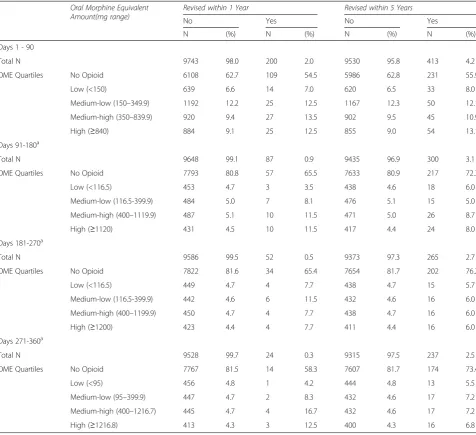
[image:6.595.59.536.109.544.2]Our study has several limitations. The data used are administrative and subjective to potential coding errors and under-reporting. However, the limitations of our data are not likely to be different between the groups studied and we, therefore, expect this to have minimal Table 2Total Amount of Oral Morphine Equivalents by Post - Total Hip Arthroplasty Period and by Revision Status (1 and 5 Years), 2001–2012
Oral Morphine Equivalent Amount(mg range)
Revised within 1 Year Revised within 5 Years
No Yes No Yes
N (%) N (%) N (%) N (%)
Days 1 - 90
Total N 9743 98.0 200 2.0 9530 95.8 413 4.2
OME Quartiles No Opioid 6108 62.7 109 54.5 5986 62.8 231 55.9
Low (<150) 639 6.6 14 7.0 620 6.5 33 8.0
Medium-low (150–349.9) 1192 12.2 25 12.5 1167 12.3 50 12.1
Medium-high (350–839.9) 920 9.4 27 13.5 902 9.5 45 10.9
High (≥840) 884 9.1 25 12.5 855 9.0 54 13.1
Days 91-180a
Total N 9648 99.1 87 0.9 9435 96.9 300 3.1
OME Quartiles No Opioid 7793 80.8 57 65.5 7633 80.9 217 72.3
Low (<116.5) 453 4.7 3 3.5 438 4.6 18 6.0
Medium-low (116.5-399.9) 484 5.0 7 8.1 476 5.1 15 5.0
Medium-high (400–1119.9) 487 5.1 10 11.5 471 5.0 26 8.7
High (≥1120) 431 4.5 10 11.5 417 4.4 24 8.0
Days 181-270a
Total N 9586 99.5 52 0.5 9373 97.3 265 2.7
OME Quartiles No Opioid 7822 81.6 34 65.4 7654 81.7 202 76.2
Low (<116.5) 449 4.7 4 7.7 438 4.7 15 5.7
Medium-low (116.5-399.9) 442 4.6 6 11.5 432 4.6 16 6.0
Medium-high (400–1199.9) 450 4.7 4 7.7 438 4.7 16 6.0
High (≥1200) 423 4.4 4 7.7 411 4.4 16 6.0
Days 271-360a
Total N 9528 99.7 24 0.3 9315 97.5 237 2.5
OME Quartiles No Opioid 7767 81.5 14 58.3 7607 81.7 174 73.4
Low (<95) 456 4.8 1 4.2 444 4.8 13 5.5
Medium-low (95–399.9) 447 4.7 2 8.3 432 4.6 17 7.2
Medium-high (400–1216.7) 445 4.7 4 16.7 432 4.6 17 7.2
High (≥1216.8) 413 4.3 3 12.5 400 4.3 16 6.8
OME=oral morphine equivalents a
impact on our estimations. The fact that medication can be prescribed for many reasons and we do not know whether the prescriptions obtained by our cohort were for the joint studied is another limitations. Because of this, we controlled our analysis for other reasons why these patients may have received these medications. We also restricted patients to include only those with one joint procedure within one year. It is possible residual confounding, due to other unknown or unavailable data, is present. Our findings may also have limited generalis-ability because we have an older cohort of patients. An-other limitation includes our inability to account for different opioid prescribing practices and preferences of physicians and surgeons with the available data, which could confound the reported findings. Further, there are also few revisions occurring during days 180–360 and it is possible that we were underpowered to estimate the risk of one year revision for the number of opioid expo-sures chosen for the study, however, the estimates were similar to the 5 year risk estimates, which had models with a substantial greater number of events. And while we chose a method of opioid exposure classification that accounted for both the time of exposure (i.e. each 90 day period) and the total amount of opioid use during these times, we recognize that there are multiple ways to
evaluate opioid exposure, such as binary exposure to the medication, average daily use, cumulative amount over time, and this should be recognized when interpreting our results and comparing to other studies on opioid use in joint surgery. Our study is also an exploratory analysis of the association of opioid amounts and the risk of revision surgery in the short and mid-term, we did not conduct multiple hypothesis adjustments to our analysis but would recommend it for subsequent con-firmatory analysis. Finally, while we used published methodology to identify revision cases, it is possible the revision surgery was linked to incorrect primary procedures due to the lack of laterality in our data [26, 27]. We do not believe this to be different be-tween the groups studied and do not expect this to impact our estimations.
[image:7.595.56.540.112.362.2]Our study strengths include the captive DVA popula-tion and comprehensive claims data available for these patients’services, which we used in this study to obtain patients’episodes of care as well as their prescription in-formation. Additionally, there is no attrition, apart from death, in this cohort, so all events are captured. Finally, because of the type of data used to identify opioid use our estimations do not suffer from patient response bias- either from not filling out a questionnaire or not Table 3Crude and Adjusted Risk of 1 Year and 5 Year Revisions by Total Amount of Oral Morphine Equivalent (mg) Quartiles by 90 day Periods Post- Total Hip Arthroplasty
1 Year Revision 5 Years Revision
OMEs (mg range), Reference=No opioid Crude HR Adjusted HR P Value Crude HR Adjusted HR P Value
Days 1 - 90a Low (<150) 1.22 (0.70-2.12) 1.12 (0.64-1.96) 0.696 1.39 (0.96-2.00) 1.29 (0.89-1.86) 0.177
Medium-low (150–349.9) 1.16 (0.75-1.80) 1.01 (0.65-1.56) 0.973 1.16 (0.86-1.58) 1.06 (0.78-1.44) 0.715
Medium-high (350–839.9) 1.62 (1.07-2.47) 1.32 (0.86-2.04) 0.209 1.34 (0.97-1.85) 1.14 (0.82-1.59) 0.422
High (≥840) 1.56 (1.01-2.40) 1.02 (0.60-1.76) 0.943 1.69 (1.26-2.27) 1.24 (0.85-1.81) 0.269
Days 91 - 180a Low (<116.5) 0.91 (0.28-2.90) 0.77 (0.24-2.49) 0.667 1.48 (0.92-2.40) 1.35 (0.83-2.18) 0.230
Medium-low (116.5-399.9) 1.98 (0.90-4.34) 1.64 (0.74-3.66) 0.223 1.15 (0.68-1.94) 0.99 (0.58-1.69) 0.982
Medium-high (400–1119.9) 2.80 (1.43-5.49) 2.22 (1.08-4.56) 0.030 1.98 (1.32-2.97) 1.66 (1.08-2.56) 0.022
High (≥1120) 3.14 (1.60-6.15) 2.64 (1.03-6.74) 0.042 2.15 (1.41-3.27) 2.11 (1.13-3.96) 0.020
Days 181 - 270b Low (<116.5) 2.05 (0.73-5.77) 1.70 (0.60-4.84) 0.321 1.34 (0.80-2.27) 1.21 (0.72-2.06) 0.472
Medium-low (116.5-399.9) 3.11 (1.31-7.41) 2.42 (1.00-5.87) 0.050 1.48 (0.89-2.46) 1.25 (0.75-2.10) 0.396
Medium-high (400–1199.9) 2.05 (0.73-5.78) 1.28 (0.43-3.85) 0.659 1.44 (0.87-2.39) 1.01 (0.59-1.73) 0.977
High (≥1200) 2.16 (0.77-6.10) 0.48 (0.08-3.01) 0.432 1.60 (0.96-2.67) 0.65 (0.27-1.60) 0.349
Days 271 - 360c Low (<95) 1.22 (0.16-9.31) NA NA 1.35 (0.77-2.36) 1.19 (0.67-2.10) 0.238
Medium-low (95–399.9) 2.47 (0.56-10.88) NA NA 1.79 (1.09-2.95) 1.55 (0.94-2.58) 0.088
Medium-high (400–1216.7) 4.96 (1.63-15.07) NA NA 1.81 (1.10-2.97) 1.41 (0.83-2.38) 0.203
High (≥1216.8) 4.01 (1.15-13.96) NA NA 1.93 (1.16-3.23) 1.22 (0.55-2.73) 0.627
OME=oral morphine equivalents. NA= Not applicable a
Models adjusted for age, gender, primary diagnosis, RxRisk-V number of co-morbidities, back pain, prior opioid use, and NSAID use b
1 year revision model adjusted for prior opioid use, back pain and RxRisk. 5 year revision model adjusted for age, gender, primary diagnosis, RxRisk-V number of co-morbidities, back pain, prior opioid use, and NSAID use
c
filling it out properly due to lack of understanding of questions [28].
Conclusion
In this cohort of older THA patients, opioid medication in the year prior to and after surgery was 19 % to 42 % and varied between patients who had a revision surgery or not. Patients using moderate to high amounts of opi-oid, during days 91–180 post surgery had a higher risk of revision within one and five years than patients not taking opioids. The observation that patients with revi-sion procedures always had higher opioid consumption than patients that did not go on to be revised, including in the pre-operative period, offers a window of oppor-tunity for surgeons to address opioid use and its possible post-operative impact pre surgery, when more frequent contact and surgical counselling is occurring. Addition-ally, identifying that higher amounts of opioids post-surgery indicate a higher risk of revision suggests that opioid use, specifically within 91–180 days, is a proxy for pain and a useful indicator for revision and should be closely monitored by healthcare providers.
Abbreviations
THA:Total Hip Arthroplasty; OME: Oral Morphine Equivalent; NSAID: non-steroidal anti-inflammatory drug; DVA: Department of Veterans’Affairs; ATC: Anatomic, Therapeutic and Chemical classification; PBS: Pharmaceutical Benefits Schedule; ICD-10-AM: International Classification of Disease, 10th Revision, Australian Modification; HR: Hazard Ratio; CI: Confidence Intervals; IRQ: Interquartile Ranges.
Competing interests
All of the authors declare non-financial competing interests.
Authors’contributions
MCSI Worked on the conception and designed the study, conducted the data analysis, conducted the interpretation of the results, and drafted and finalized the manuscript. NLP Worked on the conception of the study, acquired data for the study, assisted with the data analysis and
interpretations of the results, and provided critical review of the manuscript. EER Worked on the conception of the study, acquired data for the study, assisted with the interpretations of the results, and provided critical review of the manuscript. EWP and SEG Worked on the conception of the study, assisted with the interpretations of the results, and provided critical review of the manuscript. All authors read and approved the final manuscript and agree to be accountable for all aspects of the work in ensuring that questions related to the accuracy or integrity of any part of the work are appropriately investigated and resolved.
Acknowledgements
We acknowledge the provision of data for this study by the Australian Government Department of Veterans’Affairs (DVA). The DVA reviewed the manuscript to be submitted for publication but played no role in the analysis or interpretation of the data or in the preparation of this manuscript. This work was supported by an Australian Government National Health and Medical Research Council (NHMRC) Centre of Research Excellence in Post-Marketing Surveillance of Medicines and Medical Devices grant (GNT1040938). Nicole L. Pratt is supported by an NHMRC Early Career Fellowship (GNT1035889). No financial support or other benefits from commercial sources was received by any of the authors for the work reported on in the manuscript.
Author details
1Medicine and Device Surveillance Centre of Research Excellence, Sansom Institute, School of Pharmacy and Medical Sciences, University of South Australia, GPO Box 2471, Adelaide 5001 South Australia, Australia.2Quality Use of Medicines and Pharmacy Research Centre, Sansom Institute, School of Pharmacy and Medical Sciences, University of South Australia, GPO Box 2471, Adelaide 5001 South Australia, Australia.3Surgical Outcomes and Analysis, SCPMG Clinical Analysis, Kaiser Permanente, 8954 Rio San Diego Drive, Suite 406, San Diego, CA 92108, USA.4Australian Orthopaedic Association National Total Joint Replacement Registry, South Australian Health and Medical Research Institute, Adelaide, South Australia, Australia.
Received: 11 November 2015 Accepted: 1 March 2016
References
1. Zhang W, Moskowitz RW, Nuki G, Abramson S, Altman RD, Arden N, et al. OARSI recommendations for the management of hip and knee osteoarthritis, Part II: OARSI evidence-based, expert consensus guidelines. Osteoarthritis Cartilage. 2008;16(2):137–62. doi:10.1016/j.joca.2007.12.013.
2. Alviar MJ, Olver J, Brand C, Tropea J, Hale T, Pirpiris M, et al. Do patient-reported outcome measures in hip and knee arthroplasty rehabilitation have robust measurement attributes? A systematic review. J Rehabil Med. 2011;43(7):572–83. doi:10.2340/16501977-0828.
3. Beswick AD, Wylde V, Gooberman-Hill R, Blom A, Dieppe P. What proportion of patients report long-term pain after total hip or knee replacement for osteoarthritis? A systematic review of prospective studies in unselected patients. BMJ Open. 2012;2(1):e000435. doi:10.1136/bmjopen-2011-000435. 4. Sadoghi P, Liebensteiner M, Agreiter M, Leithner A, Bohler N, Labek G.
Revision surgery after total joint arthroplasty: a complication-based analysis using worldwide arthroplasty registers. J Arthroplasty. 2013;28(8):1329–32. doi:10.1016/j.arth.2013.01.012.
5. Rothwell AG, Hooper GJ, Hobbs A, Frampton CM. An analysis of the Oxford hip and knee scores and their relationship to early joint revision in the New Zealand Joint Registry. J Bone Joint Surg Br. 2010;92(3):413–8. doi:10.1302/ 0301-620X.92B3.22913.
6. Ekman EF, Koman LA. Acute pain following musculoskeletal injuries and orthopaedic surgery: mechanisms and management. Instr Course Lect. 2005;54:21–33.
7. Black N. Patient reported outcome measures could help transform healthcare. BMJ. 2013;346:f167. doi:10.1136/bmj.f167.
8. Bergman S. Management of musculoskeletal pain. Best Pract Res Clin Rheumatol. 2007;21(1):153–66. doi:10.1016/j.berh.2006.10.001.
9. Hochberg MC, Altman RD, April KT, Benkhalti M, Guyatt G, McGowan J, et al. American College of Rheumatology 2012 recommendations for the use of nonpharmacologic and pharmacologic therapies in osteoarthritis of the hand, hip, and knee. Arthritis Care Res. 2012;64(4):465–74.
10. Pergolizzi J, Boger RH, Budd K, Dahan A, Erdine S, Hans G, et al. Opioids and the management of chronic severe pain in the elderly: consensus statement of an International Expert Panel with focus on the six clinically most often used World Health Organization Step III opioids (buprenorphine, fentanyl, hydromorphone, methadone, morphine, oxycodone). Pain Pract. 2008;8(4):287–313. doi:10.1111/j.1533-2500.2008.00204.x.
11. WHO. Collaborating Centre for Drug Statistics Methodology, Guidelines for ATC classification and DDD assignment. 2014. Oslo, Norway: 2013. 12. Health AGDo. Australian Goverment Department of Health. Pharmaceutical
Benefits Services. 2014. http://www.pbs.gov.au/browse/medicine-listing. Accessed March 1st, 2014.
13. International Statistical Classification of Diseases and Related Health Problems, Tenth Revision, Australian Modification (ICD-10-AM). National Centre for Classification in Health. 2013. https://www.accd.net.au/Icd10.aspx. Accessed February 2014.
14. Australian and New Zealand College of Anaesthetist FoPM. Opioid Conversion to oral Morphine Equivalent Daily Dose (oMEDD). In: Toolkit for estimate of oMEDD only. 2014. http://www.fpm.anzca.edu.au/resources/ professional-documents/OPIOID%20DOSE%20EQUIVALENCE.pdf. Accessed September 7, 2015.
16. Staibano P, Winemaker M, Petruccelli D, de Beer J. Total joint arthroplasty and preoperative low back pain. J Arthroplasty. 2014;29(5):867–71. doi:10.1016/j.arth.2013.10.001.
17. Walker BF, Muller R, Grant WD. Low back pain in Australian adults: the economic burden. Asia-Pacific J Public Health. 2003;15(2):79–87. 18. Britton AR, Murray DW, Bulstrode CJ, McPherson K, Denham RA. Pain levels
after total hip replacement: their use as endpoints for survival analysis. J Bone Joint Surg Br. 1997;79(1):93–8.
19. Singh JA, Lewallen D. Predictors of pain and use of pain medications following primary Total Hip Arthroplasty (THA): 5,707 THAs at 2-years and 3,289 THAs at 5-years. BMC Musculoskelet Disord. 2010;11:90. doi:10.1186/ 1471-2474-11-90.
20. Kehlet H, Jensen TS, Woolf CJ. Persistent postsurgical pain: risk factors and prevention. Lancet. 2006;367(9522):1618–25. doi:10.1016/S0140-6736(06)68700-X. 21. Pivec R, Issa K, Naziri Q, Kapadia BH, Bonutti PM, Mont MA. Opioid use prior
to total hip arthroplasty leads to worse clinical outcomes. Int Orthop. 2014; 38(6):1159–65. doi:10.1007/s00264-014-2298-x.
22. Strom BL. Overview of Automated Databases in Pharmacoepidemiology, in Pharmacoepidemiology. 5th ed. Wiley-Blackwell: Oxford, UK; 2012. 23. Wettermark B, Zoega H, Furu K, Korhonen M, Hallas J, Norgaard M, et al. The
Nordic prescription databases as a resource for pharmacoepidemiological research–a literature review. Pharmacoepidemiol Drug Saf. 2013;22(7):691–9. doi:10.1002/pds.3457.
24. Australian Government Department of Health. Pharmaceutical Benefits Scheme (PBS). 2014. http://www.pbs.gov.au/pbs/home. Accessed June 24 2014. 25. Medicare.gov - the Official U.S. Government Site for Medicare. Drug coverage
(Part D). 2014. http://www.medicare.gov/part-d/. Accessed July 9th 2014. 26. Lyman S, Dunn WR, Spock C, Bach PB, Mandl LA, Marx RG. Validity of
same-side reoperation after total hip and knee arthroplasty using administrative databases. J Knee Surg. 2009;22(1):17–20.
27. Singh JA, Kundukulam JA, Bhandari M. A systematic review of validated methods for identifying orthopedic implant removal and revision using administrative data. Pharmacoepidemiol Drug Saf. 2012;21 Suppl 1:265–73. doi:10.1002/pds.2309.
28. Wu AW, Snyder C, Clancy CM, Steinwachs DM. Adding the patient perspective to comparative effectiveness research. Health Aff. 2010;29(10): 1863–71. doi:10.1377/hlthaff.2010.0660.
• We accept pre-submission inquiries
• Our selector tool helps you to find the most relevant journal
• We provide round the clock customer support
• Convenient online submission
• Thorough peer review
• Inclusion in PubMed and all major indexing services
• Maximum visibility for your research
Submit your manuscript at www.biomedcentral.com/submit