R E S E A R C H A R T I C L E
Open Access
Obesity is associated with more disability at
presentation and after treatment in low
back pain but not in neck pain: findings
from the OIOC registry
Maria M. Wertli
1,2,3*, Ulrike Held
1, Marco Campello
2and Shira Schecter Weiner
2Abstract
Background:The influence on the treatment response in patients with low back pain (LBP) and neck pain (NP) is unknown. The aim of the study was to investigate the influence of body weight in patients with low back pain (LBP) and neck pain (NP) on baseline and end of treatment disability.
Methods:Cross-sectional analysis of baseline factors. Longitudinal analysis of prospectively collected patient information at an outpatient physical therapy registry (data from June 2010 to December 2012). WHO-BMI classification was used: underweight, lean, overweight, obesity class I, obesity class II and III. The influence of body weight and a predefined set of confounders was analyzed by multiple regression models.
Results:In LBP, disability increased with increasing BMI [lean = reference, obesity class I Beta 5.41 (95 % CI 0.75; 10.07), obesity class II-III Beta 7.58 (95 % CI 2.13; 13.03)]. Compared to lean patients, disability after treatment improved in overweight subjects [Beta−3.90 (95 % CI−7.4;−0.41)] but not in subjects with obesity class II–III [Beta 3.43 (95 % CI−3.81; 10.68)]. There were insufficient patients in the sample with severe obesity and therefore this trend has to be confirmed. The likelihood for meaningful important change (MID) was similar in all BMI subgroups. For patients with NP, BMI was not associated with baseline disability, and did not predict end of treatment disability or the likelihood of a MID. These findings must be interpreted with caution as BMI subgroups did not meet the required sample size. Conclusion:Overweight and obesity are associated with higher levels of disability before treatment in LBP patients, but not in NP. In severely obese patients class II–III with LBP the rate of MID was lowest indicating that these patients experienced the least treatment response compared to the other groups. Further studies should address the impact of severe obesity on the prognosis of LBP. In patients with LBP, severe obesity may be an important factor to consider during the physical therapy treatment. In particular, combined treatment strategies combining weight management, cardiovascular fitness, and low back pain rehabilitation should be investigated.
Background
The prevalence of obesity has been steadily increasing since the 1960s. Currently about one third of the adult U.S. population is obese [1]. The implications for the working population are yet to be fully realized. The lost
productivity yearly due to obesity is estimated at $12 billion [2]. Obesity is associated with a high incidence of work-related musculoskeletal disorders [3]. It has been suggested that obesity is associated with more spinal pain, mainly low back pain (LBP) [4] and neck pain (NP) [5]. The cost of spinal pain for the US workforce is estimated at $20 billion annually [6]. Together, obesity and spinal pain represent two clinically and economically important public health problems that drive health care utilization. Currently the interactive effect of obesity on recovery from spinal pain is poorly understood and is needed in order to develop effective treatment interventions. * Correspondence:Maria.Wertli@insel.ch
1Horten Centre for Patient Oriented Research and Knowledge Transfer,
Department of Internal Medicine, Zurich University, University Hospital Zurich, Pestalozzistrasse 24, CH-8032 Zurich, Switzerland
2NYU Hospital for Joint Diseases, Occupational and Industrial Orthopaedic
Center (OIOC), New York University, 63 Downing Street, New York, NY 10014, USA
Full list of author information is available at the end of the article
Spinal pain, primarily nonspecific NP and LBP, is a com-mon problem. The lifetime prevalence for LBP exceeds 80 % and for NP ranges between 40 and 70 % [7, 8]. With LBP every fifth patient will eventually develop chronic pain-related disability and generate two- thirds of the direct and indirect costs [7]. While the prognosis in the early course of LBP is good, return to full function is diffi-cult to achieve once the condition becomes chronic [7]. NP is frequently persistent [9, 10] and both NP and LBP have high rates of recurrence [7, 9, 10]. While the body of research describing the management of LBP is more ro-bust than that for NP, in cases of nonspecific neck or LBP, it appears that similar treatment strategies may be benefi-cial [11, 12]. Research has shown that early screening can identify individuals at risk for chronicity [13]. Therefore, patients at risk for chronic spinal pain should be identified early for targeted treatment interventions that may im-prove outcomes, most specifically, preventing disabling pain and chronicity [14].
Obese individuals, compared to lean individuals, are more likely to experience NP and LBP [5, 15, 16], are ex-pected to have a slower recovery [17–19], and are more likely to seek healthcare for LBP [19]. This suggests that not only might it cost more to treat obese patients but also that obesity might be a prognostic factor for long-term functional limitations [20] and increased health care expenditure. Therefore further exploration is needed to better understand these phenomena.
Different treatment approaches are available for man-aging spinal pain [7, 12]. Several prognostic and mediating factors have been identified that might hinder treatment success. For example, psychological factors, such as, for example, fear avoidance, have been shown to negatively in-fluence treatment efficacy in patients with LBP [21, 22]. There is clear evidence that a biopsychosocial approach to care, focusing on activity and managing fears and other emotional issues related to the pain results in best out-comes including functional restoration, decreased health care utilization, and reduced direct and indirect costs [13]. Yet few studies have addressed the influence of obesity on treatment response in spinal rehabilitation and among those that have, the findings were inconsistent [23–27]. Therefore, it is unclear how obesity affects disability and treatment response in patients with nonspecific LBP or NP. The aim of this analysis is to investigate the influence of body weight on disability in patients with spinal pain and to explore the influence of body weight on functionally-related outcomes in individuals undergoing best-evidence rehabilitation. We hypothesize that obese patients experi-ence more disability compared to lean patients. We further hypothesize that body weight is inversely correlated with functional outcomes after treatment for nonspe-cific NP and LBP pain. The analysis is based on pro-spectively collected patient information from an
outpatient rehabilitation clinic registry in New York City, New York, USA [28].
Methods
Design
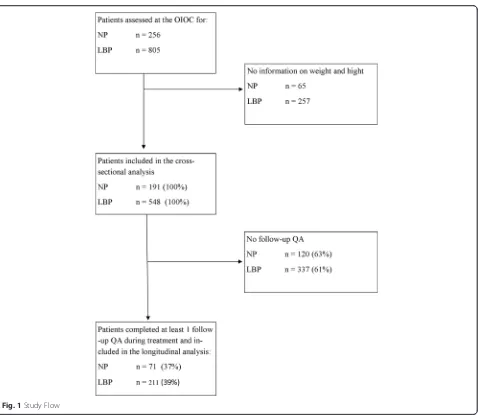
This study is a cross-sectional analysis of baseline factors and longitudinal analysis of prospectively collected patient information during outpatient physical therapy. The de-scription of the study inclusion process and the analysis was based on the guidelines for reporting observational studies, as described in the Strengthening The Reporting of Observational studies in Epidemiology (STROBE) state-ment [29].
Eligibility criteria
All treatment records of subjects treated for LBP and NP at an urban outpatient rehabilitation facility were po-tentially eligible for the analysis. Included were all records of patients 18 years and older who reported weight and height and perceived disability. Excluded were records without information on body weight or height, as no body mass index (BMI) could be calculated, or those missing reports of perceived disability.
Data collection process of the clinic registry
The data used for the current analysis were collected between June 2010 and December 2012 at the NYU Hospital for Joint Diseases Occupational and Industrial Orthopaedic Center (OIOC), New York University Langone Medical Center (NYLMC), New York, U.S.A. The OIOC is an outpatient center of excellence and provides outpatient physical therapy services for the management of musculoskeletal conditions, specializing in spine-related musculoskeletal disorders. Patients are re-ferred by specialists, insurance companies, and primary care physicians from the tri-state area (New York, New Jersey, Connecticut), and represent a wide spectrum of the working and non-working population in this region.
As part of routine clinical practice, all OIOC patients provide a core set of information and complete a series of self-reported validated questionnaires before the start of treatment, during treatment, and at discharge [28]. This data is used by clinicians to inform treatment deci-sions, and assess treatment effectiveness. The collected parameters are based on the recommendations of a con-sensus statement by Pincus et al. [30] aimed at enhancing quality in outcome measurements. The data collected re-flects the patients’ self-report of function, pain, demo-graphic, psychosocial, and psychological factors that previous research has found to be relevant to treatment outcome [30].
Spine Registry - Spine Tango [31, 32]. The database fol-lows HIPAA compliance practices related to the security of data. Researchers involved in the analysis of the de-identified data were not involved in the data collection process and did not have access to any personal identifiers collected by the spine clinic.
Treatment
All patients with NP and LBP at the OIOC receive an evidence-based approach to care including four to eight weeks of active physical therapy, and spine education and information [12, 33]. All treatment is provided by physical therapists specially trained in a multidisciplinary approach to care for spinal patients. Treatment takes place at the spine clinic approximately twice a week for one hour. Evidence suggests that patients with neck and back pain should be encouraged to remain active. Exercise prescription was based in this ideology and was customized for patients based on evidence of muscle weakness and tightness, and moderated within tolerable limits. Patients were educated that they need not be fearful of some degree of discomfort during exercise. All exercise for the neck and back comprehensively addressed both some degree of cardiovascular training combined with stretching and strengthening the spine and extremities based on individ-ual presentation. In addition, all patients are instructed in self-care techniques that include avoidance of bed rest, activities as tolerated, ice or heat as needed, over the counter medications for symptom control, and relaxation techniques. A progressive daily home back exercise pro-gram is part of the treatment and patients are expected to exercise independently. The program is customized by the treating physical therapist based on the specific physical presentation of the patient. Treatment progress is assessed on a regular basis by the multidisciplinary team, consisting of a physician, psychologist, and physical therapists. As part of treatment, yellow flags are monitored and ad-dressed by the PT. Yellow flags refer to psychosocial barriers to recovery. Physical therapists in this setting were trained to address yellow flags during the course of rehabilitation. In patients with persistent yellow flags despite the physical therapist intervention to address the distress and fears were referred to a health psych-ologist, who is a part of the interdisciplinary treatment team at the clinic.
End of treatment assessment
The OIOC registry includes the collected forms of all patients evaluated at the spine clinic. Completing the forms was voluntarily, yet was a routine part of the intake process. Some patients were seen only for an evaluation as they chose not to start a treatment program or no ap-proval by the insurance company was obtained. Therefore, more baseline than end of treatment assessments were
available. Furthermore, some patients chose not to self-report their body weight or height and were therefore not included in this analysis. The baseline characteristics of all patients were compared to the patients included in this analysis for any indication of bias. Patients that underwent treatment and chose to complete an end of treatment questionnaire were included in this analysis. Treatment duration was calculated based on the baseline assessment date and the date of the completed end of treatment form. The treatment was stopped when 1) it was no longer ne-cessary, 2) there was no further coverage by the insurance companies, 3) the patient chose not to pursue treatment, or 4) the patient was non- compliant with the recommen-dations of the therapists.
Outcome definition
The primary outcome was patient-reported disability as assessed by the Oswestry Disability Index [ODI [34]] for patients with LBP and the neck disability index (NDI) for patients with NP [35]. Both, the ODI and the NDI are widely used, valid, and reliable questionnaires that measure disability in spine pain patients. The ODI and the NDI consist of 10 questions (each item score 0 to 5). The score ranges from 0 to 100 % [(total scored/total possible score) * 100]. For the longitudinal analysis, a meaningful clinically important difference (MCID) in the ODI or NDI was defined as a change of 30 % [36].
Body mass index classes
Self-reported body weight and height at baseline were used to calculate the BMI, which is computed by kilo-grams per square meter (kg/m2). Patients were classified according to the WHO classification [37]: underweight (BMI < 18 kg/m2), lean (BMI 18- <25 kg/m2), overweight (BMI 25- <30 kg/m2), obesity class I (BMI≥30 - <35 kg/ m2), obesity class II and III (≥35 kg/m2).
Confounders
The following potential confounders were defined a priori in an interdisciplinary group consensus and by consulting the relevant literature [30, 38]: Age, gender, currently not in a relationship, blue collar workers (e.g. craft or trades worker, elementary workers), low education (high school or lower education), not working (because of the medical condition, ill health, or pain) or working limited duty or alternate job because of the medical condition, receiving workers’ compensation, high baseline pain [Numeric Rating Scale (NRS), range 0–10 [39]]. High baseline pain was defined as NRS of more than 6 points, chronic pain as more than 3 months pain duration.
sub-scale ranges from 0 to 42 points with high values indicating more fear avoidance beliefs. A cut-off for FABQ-W of >25 has been proposed [41]. The fear of physical activity sub-scale (FABQ-P) ranges from 0-24 points. A FABQ-P cut-off of >15 points is suggested [41]. Both cut-points were associ-ated with a worse prognosis in LBP [41].
Sample size calculation
We calculated the required sample size for subgroups in a longitudinal analysis comparing the lean patients with the obese patients, assuming a 20 % difference between the groups in change in ODI/NDI over time. With a power of 80 % and a level of significance of 5 %, this re-sults in 28 patients per group. Anticipating a drop-out rate of 15 %, this would require the inclusion of at least 33 patients per group at baseline.
Statistical Analysis
Descriptive statistics included median and interquartile range for the continuous parameters, and percentages for the categorical outcomes. Results are presented in categories of the LBP cross-sectional, LBP longitudinal, NP cross-sectional, and NP longitudinal analyses. Results of the linear models are presented with the estimate and the corresponding 95 % confidence interval (95 % CI).
Description of the process used for variable selection The above described confounders were defined a priori based on an interdisciplinary consensus and by consulting the relevant literature [30, 38].
Multiple imputation and variable selection including interactions
Complete data sets were available for ODI, NDI, and BMI. Because of missing values in the confounders (re-sults section: percentage missing between 5 and 23 % in cross-sectional analysis), we multiply imputed the data-set (m = 5). The chained equation approach was used and the five datasets were stacked into one “long” data file. We used the approach proposed by Rothman et al. to consider a confounder if a variable changes the effect of the determinant on the outcome by more than 10 % [42]. Therefore, we fitted linear regression models to the outcome in this stacked dataset with BMI as the deter-minant, well aware of the fact that the estimated coeffi-cient of BMI is not affected by the stacking of the dataset (the stacking only affects the standard error of the estimated coefficient). Among the set of potential confounders, we evaluated each variable added to the determinant BMI for a change in the determinant’s effect size of more than +/- 10 %. If the added variable changed the estimated BMI effect more than 10 %, it was included in the final multiple regression model as a confounding fac-tor. For each outcome, a set of confounders was identified
with this approach. Finally, the interaction of the confounders with the BMI subgroups was tested for significance.
Fitting of the final multiple linear regression model
When we fitted the final multiple regression models, in-cluding the determinant BMI and the set of confounders, to the outcomes or change in outcomes over time, we used Rubin’s formula for the combination of effect estimates and their standard errors from the multiply imputed datasets. We additionally evaluated each confounder for the pres-ence of an interaction term with BMI. The interaction was deleted from the model, if it was not significantly different from zero.
Statistical analyses were conducted by using the statis-tical software R [43] and the R-package“mice.”
Ethics statement
This study is based on administrative de-identified data handled in compliance with HIPPA and NYULMC regu-lations. According to the IRB at NYU, given the nature of the study, no approval was necessary.
Results
Cross-sectional analysis results
In the LBP group, at baseline, obese patients expressed more disability [obesity class I Beta 5.41 (95 % CI 0.75; 10.07), obesity class II–III Beta 7.58 (95 % CI 2.13; 13.03)] compared to lean patients (Table 2). Low education was associated with more disability (Beta 11.20, 95 % CI 5.45; 16.94). The interaction between obesity class II–III and low education reduced this effect [Beta−12.33 (95 % CI−22.80;−1.87)]. No other in-teractions between the predefined confounders and the BMI classes were found for the LBP group. In patients with NP, we found no significant influence of BMI cat-egories on baseline disability (Table 3). Baseline pain (Beta 5.84 95 % CI 3.03; 8.66) and high fear avoidance beliefs of physical activities (FABQ-P, Beta 4.53 95 % CI 2.07; 6.98) were associated with more disability. Furthermore, no
interaction between other confounders and BMI were found.
Results longitudinal analysis
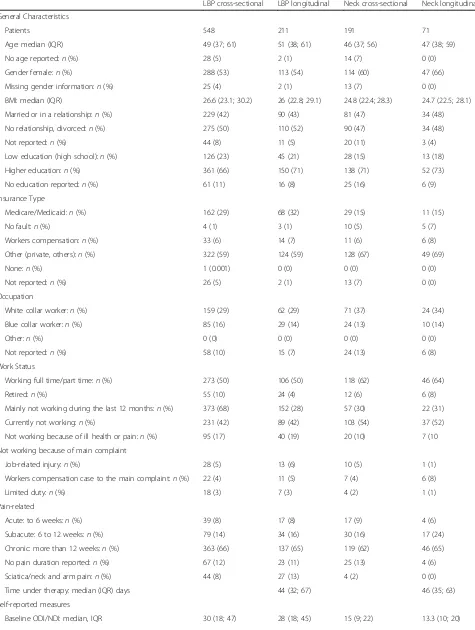
[image:5.595.61.539.83.498.2]Table 1Baseline Characteristics of the patient population with reported weight and height
LBP cross-sectional LBP longitudinal Neck cross-sectional Neck longitudinal
General Characteristics
Patients 548 211 191 71
Age: median (IQR) 49 (37; 61) 51 (38; 61) 46 (37; 56) 47 (38; 59)
No age reported:n(%) 28 (5) 2 (1) 14 (7) 0 (0)
Gender female:n(%) 288 (53) 113 (54) 114 (60) 47 (66)
Missing gender information:n(%) 25 (4) 2 (1) 13 (7) 0 (0)
BMI: median (IQR) 26.6 (23.1; 30.2) 26 (22.8; 29.1) 24.8 (22.4; 28.3) 24.7 (22.5; 28.1)
Married or in a relationship:n(%) 229 (42) 90 (43) 81 (47) 34 (48)
No relationship, divorced:n(%) 275 (50) 110 (52) 90 (47) 34 (48)
Not reported:n(%) 44 (8) 11 (5) 20 (11) 3 (4)
Low education (high school):n(%) 126 (23) 45 (21) 28 (15) 13 (18)
Higher education:n(%) 361 (66) 150 (71) 138 (71) 52 (73)
No education reported:n(%) 61 (11) 16 (8) 25 (16) 6 (9)
Insurance Type
Medicare/Medicaid:n(%) 162 (29) 68 (32) 29 (15) 11 (15)
No fault:n(%) 4 (1) 3 (1) 10 (5) 5 (7)
Workers compensation:n(%) 33 (6) 14 (7) 11 (6) 6 (8)
Other (private, others):n(%) 322 (59) 124 (59) 128 (67) 49 (69)
None:n(%) 1 (0.001) 0 (0) 0 (0) 0 (0)
Not reported:n(%) 26 (5) 2 (1) 13 (7) 0 (0)
Occupation
White collar worker:n(%) 159 (29) 62 (29) 71 (37) 24 (34)
Blue collar worker:n(%) 85 (16) 29 (14) 24 (13) 10 (14)
Other:n(%) 0 (0) 0 (0) 0 (0) 0 (0)
Not reported:n(%) 58 (10) 15 (7) 24 (13) 6 (8)
Work Status
Working full time/part time:n(%) 273 (50) 106 (50) 118 (62) 46 (64)
Retired:n(%) 55 (10) 24 (4) 12 (6) 6 (8)
Mainly not working during the last 12 months:n(%) 373 (68) 152 (28) 57 (30) 22 (31)
Currently not working:n(%) 231 (42) 89 (42) 103 (54) 37 (52)
Not working because of ill health or pain:n(%) 95 (17) 40 (19) 20 (10) 7 (10
Not working because of main complaint
Job-related injury:n(%) 28 (5) 13 (6) 10 (5) 1 (1)
Workers compensation case to the main complaint:n(%) 22 (4) 11 (5) 7 (4) 6 (8)
Limited duty:n(%) 18 (3) 7 (3) 4 (2) 1 (1)
Pain-related
Acute: to 6 weeks:n(%) 39 (8) 17 (8) 17 (9) 4 (6)
Subacute: 6 to 12 weeks:n(%) 79 (14) 34 (16) 30 (16) 17 (24)
Chronic: more than 12 weeks:n(%) 363 (66) 137 (65) 119 (62) 46 (65)
No pain duration reported:n(%) 67 (12) 23 (11) 25 (13) 4 (6)
Sciatica/neck and arm pain:n(%) 44 (8) 27 (13) 4 (2) 0 (0)
Time under therapy: median (IQR) days 44 (32; 67) 46 (35; 63)
Self-reported measures
for this sub-group analysis. None of the predefined con-founders showed a statistically significant interaction. The likelihood for a clinical meaningful change in ODI from baseline to the end of treatment assessment was not differ-ent between the BMI categories (Table 5).
In patients with NP, none of the tested confounders predicted the end of treatment NDI (Tables 4 and 5). NDI values decreased in all groups similarly (Fig. 3). BMI subgroups were compared to lean patients and pre-dicted no clinically meaningful change in NDI. Figure 3 illustrates the distribution of NDI with mean and 95 % CI for the BMI subgroups. The findings of the longitu-dinal analysis have to be interpreted with caution be-cause in most sub-groups the sample size requirements were not met.
Discussion
The analysis of a registry of patients treated for LBP or NP showed that in LBP, obesity affects clinically important
factors. Patients with LBP expressed more disability with increasing BMI at baseline when compared to lean sub-jects. During a course of treatment, LBP disability im-proved more in overweight subjects when compared to lean patients. In comparison we found in severely obese patients (obesity class II–III) less improvement in disabil-ity. While this finding in the severely obese patients was not statistically different compared to lean patients, the wide confidence intervals indicate that heterogeneity in the patient population was present suggesting that further studies are needed to explain this finding. Independent prognostic factors for the end of treatment ODI were baseline ODI and high baseline fear avoidance of physical activity (FABQ-P).
[image:7.595.60.537.100.327.2]In NP patients we found no influence of BMI on baseline disability. Baseline disability was associated with higher pain scores and higher fear of physical activity beliefs scores. The only significant prognostic factor for disability at the end of treatment was the baseline disability. Independent
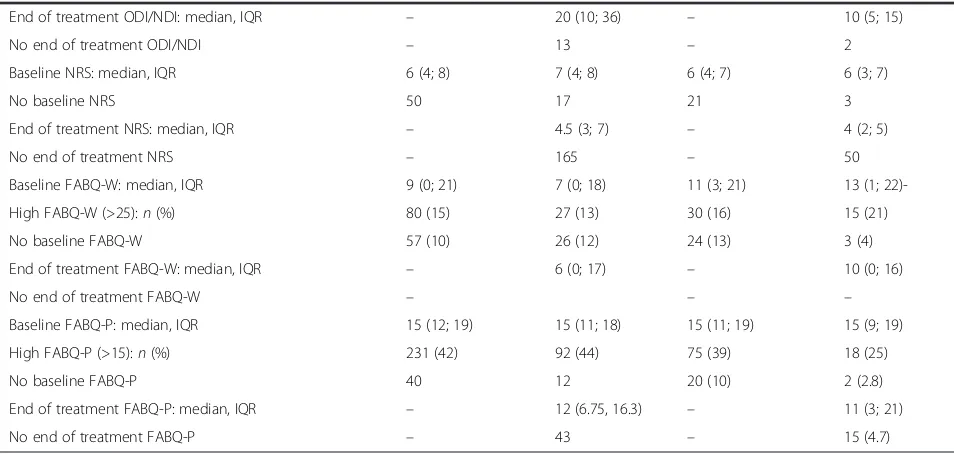
Table 1Baseline Characteristics of the patient population with reported weight and height(Continued)
End of treatment ODI/NDI: median, IQR – 20 (10; 36) – 10 (5; 15)
No end of treatment ODI/NDI – 13 – 2
Baseline NRS: median, IQR 6 (4; 8) 7 (4; 8) 6 (4; 7) 6 (3; 7)
No baseline NRS 50 17 21 3
End of treatment NRS: median, IQR – 4.5 (3; 7) – 4 (2; 5)
No end of treatment NRS – 165 – 50
Baseline FABQ-W: median, IQR 9 (0; 21) 7 (0; 18) 11 (3; 21) 13 (1;
22)-High FABQ-W (>25):n(%) 80 (15) 27 (13) 30 (16) 15 (21)
No baseline FABQ-W 57 (10) 26 (12) 24 (13) 3 (4)
End of treatment FABQ-W: median, IQR – 6 (0; 17) – 10 (0; 16)
No end of treatment FABQ-W – – –
Baseline FABQ-P: median, IQR 15 (12; 19) 15 (11; 18) 15 (11; 19) 15 (9; 19)
High FABQ-P (>15):n(%) 231 (42) 92 (44) 75 (39) 18 (25)
No baseline FABQ-P 40 12 20 (10) 2 (2.8)
End of treatment FABQ-P: median, IQR – 12 (6.75, 16.3) – 11 (3; 21)
No end of treatment FABQ-P – 43 – 15 (4.7)
nnumber of subjects;IQRinterquartile range;ODIOswestry Disability Index (range 0–100),NDINeck Disability Index (range 0–100);FABQfear avoidance questionnaire;FABQ-Wwork sub-scale (range 0–42);FABQ-Pphysical activity subscale (range 0–24);BMIbody mass index
Table 2Distribution of the patients according to the BMI subgroups
LBP cross-sectional LBP longitudinal NP cross-sectional NP longitudinal
Patients:n 548 211 191 71
Underweight (BMI < 18 kg/m2):n(%) 11 (2)a 5 (2)a 6 (3)a 4 (6)a
Lean (BMI 18- < 25 kg/m2):n(%) 198 (36) 83 (39) 94 (49) 33 (46)
Overweight (BMI 25- <30 kg/m2):n(%) 194 (35) 79 (37) 61 (32) 24 (34)a
Obesity class I (BMI 30- < 35 kg/m2):n(%) 94 (18) 31 (15)a 22 (12)a 7 (10)a
Obesity class II–III (BMI≥35 kg/m2):n(%) 51 (9) 13 (6)a 8 (4)a 3 (4)a
a
[image:7.595.56.540.625.723.2]prognostic factors for the end of treatment disability were baseline NDI, high baseline pain, and high fear avoidance beliefs of physical activity. However, the findings in the NP population need to be interpreted with caution as the sam-ple size requirements for sub-group analyses were not met. Therefore, we must consider that we might have missed a relevant influence of BMI on NP-related disability.
Results in light of the literature
[image:8.595.57.538.98.550.2]Whether or not obese patients respond differently to non-pharmacological treatment approaches for spinal pain is controversial [25–27, 44]. While one cohort study found that obese patients responded similarly to treatment compared to their lean counterparts [44], other studies found that obesity was associated with a Table 3Results Cross-sectional Analysis for Disability (ODI or NDI)
BMI category Beta (95 % CI) p-value
LBPa Lean (reference) – –
Underweight 3.02 (−8.06; 14.10) 0.59
Overweight 1.17 (−2.17; 4.52) 0.49
Obesity class I 5.41 (0.75; 10.07) 0.02
Obesity class II–III 7.58 (2.13; 13.03) 0.01
Low education 11.20 (5.45; 16.94) 0.00
Blue collar jobs 1.23 (−2.56; 5.01) 0.53
Not working 3.06 (−0.62; 6.73) 0.10
Work-related RF 7.82 (0.33; 15.32) 0.04
High pain baseline 15.59 (12.86; 18.31) 0.00
FABQ-W high 5.30 (−0.13; 10.73) 0.06
FABQ-W N/A 4.98 (0.31; 9.66) 0.04
Underweight x Low education −11.99 (−36.47; 12.50) 0.33
Overweight x Low education −4.48 (−11.94; 2.99) 0.24
Obesity class I x Low education −6.12 (−14.48; 2.25) 0.15
Obesity class II–II x Low education −12.33 (−22.80;−1.87) 0.02
NPb Lean (reference)
Underweight 4.57 (−1.70; 10.83) 0.15
Overweight −1.11 (−3.61; 1.40) 0.38
Obesity class I −0.32 (−3.90; 3.26) 0.86
Obesity class II–III −0.95 (−6.90; 5.00) 0.75
Age −0.04 (−0.13; 0.06) 0.43
Male gender −1.32 (−3.82; 1.19) 0.30
No relationship 2.19 (−0.17; 4.55) 0.07
Blue collar jobs 1.21 (−2.65; 5.07) 0.53
Not working 2.21 (−0.78; 5.20) 0.14
Work-related RF 3.37 (−1.12, 7.85) 0.14
High baseline pain 5.84 (3.03; 8.66) <0.001
High FABQ-P 4.53 (2.07; 6.98) <0.001
High FABQ-W 3.45 (−0.26; 7.15) 0.07
FABQ-W N/A −1.23 (−5.35; 2.89) 0.55
Pre-defined confounders were: low education (high school or less), blue collar jobs includes crafts or trade worker, agricultural or elementary worker, high FABQ-W, FABQ-W N/A = not working, high pain (NRS > 6), age, gender, not in a relationship
High pain (NRS > 6), FABQ, fear avoidance questionnaire, fear avoidance work sub-scale (FABQ-W) high > 25; fear avoidance beliefs physical sub-scale (FABQ-P) high >15
Work related risk factor: working full time at alternate or limited duty job because of a medical condition; not working because of pain or ill health; looked but can’t find a job; not working because of the main complaint in a job-related injury; pending workers compensation case
a
Confounder included in the final model when they changed the effect between BMI and ODI/NDI by at least 10 %. Interactions with BMI were included if they were significantly different from zero (p < 0.05)
b
failure to improve [26, 27, 45]. Furthermore, retrospect-ive studies suggest that obese patients express higher levels of fear avoidance than their lean counterparts and therefore are at risk for worse treatment response [25] and respond poorer to cognitive behavioral therapy, a treatment aimed at addressing fear of movement [24]. Our findings support that a higher BMI is associated with more disability at baseline in patients with LBP. A previously observed interaction between fear avoidance beliefs and obesity [25] was not found in this study. Additionally, while overweight subjects with LBP re-ported higher baseline ODI than lean subjects, the end of treatment ODI was lower (on average −3.90 points, 95 % CI−7.4; −0.41) and they reported the highest rate of MID (48 %). The OR for MID was 1.15 and the 95 % CI crossed 1 and therefore the finding was not statisti-cally significant (95 % CI 0.99; 1.34). During treatment, severely obese patients (class II–III) experienced less decrease in disability than the other groups (+3.43 points (95 % CI −3.81; 10.68) and had the lowest MID rate (33 %) indicating that these patients experienced a worse treatment response compared to the other groups. Again, the OR for MID was not statistically significant (OR 1.30 (95 % CI 0.69–2.44). In addition, the rate of follow-up assessment was 25 % in the severely obese patients compared to 33 % in obese class I patients and 40 % in overweight patients which may indicate a higher rate of unfinished treatments in severely obese patients. It may be hypothesized that overweight patients are moderately deconditioned and respond well to physical therapy treatment. Severely obese patients may have, in addition to LBP, other problems including gait insecurity and sarcopenia which may require other treatment strat-egies than those included in their LBP regimen [46]. This finding should be further evaluated in follow-up Table 4BMI category as prognostic factor for disability (ODI/NDI)
at the end of treatment
BMI category Beta (95 % CI) p-value
LBPa Lean (reference) –
Underweight −4.92 (−18.1; 8.27) 0.45
Overweight −3.90 (−7.4;−0.41) 0.03
Obesity class I −0.83 (−6.1; 4.46) 0.76
Obesity class II–III 3.43 (−3.81; 10.68) 0.35
ODI baseline 0.59 (0.49; 0.69) <0.001
FAB-P high 7.76 (4.39; 11.13) <0.001
FAB-W high −0.82 (−7.1; 5.4) 0.79
FAB-W high NA 2.42 (−2.69)7.53) 0.35
No relationship 3.03 (−0.43; 6.49) 0.09
Work-related RF 3.03 (−2.25; 8.32) 0.25
Chronic pain 4.49 (0.34; 8.64) 0.03
Treatment duration 0.04 (−0.02; 0.09) 0.16
NPa Lean (reference) –
Underweight −0.23 (−6.58; 6.12) 0.94
Overweight 0.91 (−2.23; 4.05) 0.57
Obesity class I −0.46 (−5.39; 4.48) 0.85
Obesity class II–III −4.65 (−11.98; 2.69) 0.21
NDI baseline 0.61 (0.43; 0.78) <0.001
Work-related RF 4.07 (−0.35; 8.48) 0.07
Treatment duration 0.03 (−0.02; 0.08) 0.25
Positive Beta coefficient indicates less decrease in ODI/NDI; negative Beta coefficient indicates more decrease in ODI/NDI than in the reference group (lean patients)
a
No significant interactions between BMI and other potential prognostic factors were found for low back and neck pain patients
All confounders included in the final model changed the influence of BMI on the outcome ODI/NDI at least 10 % in univariate comparison
[image:9.595.58.540.537.703.2]studies, as it suggests that the amount of excess weight modifies the treatment response. Our patient population included insufficient patients with severe obesity to draw conclusions, and therefore our findings have to be con-firmed in studies specifically addressing this patient population. The long-term effects of our findings are un-known and to the best of our knowledge no study has been conducted with sufficient numbers of obese pa-tients to address the question of long-term outcome.
Significant weight reduction has been shown to im-prove physical and mental outcome for those with LBP [47]. It has been shown that improved fitness slowed the decline in mobility in overweight adults with type 2 dia-betes [48]. It may be that overweight patients are able to perform recommended spine exercises when compared
to obese and severely obese subjects. Previous research has shown an association between body fat and the in-tensity and disability from LBP [49], and that weight re-duction after bariatric surgery improved joint pain, gait, and perceived mobility [46]. Severely obese patients with LBP might start at a state of deconditioning where an exercise protocol is difficult to follow and the typical treatment duration may be insufficient for a clinically important or sustainable effect. Our findings indicate that further research is needed to study the effect of body weight on the ability of obese patients with LBP to participate in exercises, to ascertain the effectiveness of current treatment strategies and optimal treatment dur-ation. In addition, the economic impact of a treatment approach addressing both body weight and LBP may be substantial and yield better long-term outcomes not only of LBP but also for other comorbidities associated with obesity such as cardiovascular and metabolic disorders.
Only a few studies have addressed the impact of prognostic factors on NP patients [9, 10, 50], and to the best of our knowledge, no study has investigated the in-fluence of body weight on the treatment response in patients with NP. Our findings concur with epidemio-logical studies that found no influence of body weight on disability in NP patients [51]. However, due to the small patient samples in the BMI subgroups, our find-ings have to be interpreted with caution and further re-search is needed to clarify, in particular, the role of severe obesity on NP.
Strength and limitations
The strength of this study is that all patients treated at an urban physical therapy clinic with LBP or NP were included in the analysis. Therefore, this study is based on real patients in a busy spine pain clinic. Great care
[image:10.595.57.290.110.263.2]Fig. 3Distribution of NDI at baseline and end of treatment. Raw NDI data: NDI mean and 95 % Cl; Le, lean; Ov, overweight; Ob.I, obesity class I; Ob.II–III, obesity class II–III
Table 5Results longitudinal analysis for 30 % change as MID in ODI or NDI
BMI category % with MIDa OR (95 % CI)
p-value
LBPb Lean (reference) 36.3 – –
Underweight 33.3 1.19 (0.68; 2.09) 0.63
Overweight 48.0 1.15 (0.99; 1.34) 0.35
Obesity class I 46.4 1.14 (0.92; 1.40) 0.25
Obesity class II–III 33.3 0.98 (0.73; 1.33) 0.91
NP Lean (reference) 41.9
Underweight 50 1.12 (0.58–2.19) 0.73
Overweight 41.7 1.00 (0.72–1.39) 0.98
Obesity class I 57.1 1.03 (0.64–1.64) 0.91
Obesity class II–III 66.7 1.30 (0.69–2.44) 0.41
Results adjusted for the following confounders with at least 10 % change in the effect between BMI on ODI/NDI
a
raw rate of MID
b
[image:10.595.58.540.542.703.2]was taken to address the potential influence of patient heterogeneity by systematically considering evidence-supported prognostic factors [30]. Subgroup analyses may lead to both overestimation and underestimation of an effect. To the best of our knowledge, this is the first study on the influence of body weight on disability in spinal pain that used sample size calculation for subgroup analyses to assess the validity of the re-sults. Further, all subgroups and prognostic factors were defined a priori, tests of interaction were per-formed, and subgroup-specific estimates with the corresponding confidence intervals are provided to illustrate the differences.
The following describes three study limitations to address in follow-up studies. First, the sample size of patients with NP or LBP followed-up during treatment was small in the high BMI subgroups (obesity class II– III). Therefore, wide confidence intervals were ob-served and the small sample size might explain the lack of statistically significant findings. Further, the number of patients who completed the treatment was very low in some categories and these results need further confirmation in larger samples. Second, the data was used from a clinical registry based on self-reported questionnaires completed on a voluntary basis. The reported weight and height was not con-firmed and no further analysis of the body fat distribu-tion was available. Overweight individuals may report lower weight and therefore, the BMI in these subjects may be underestimated. Therefore, the proportion of obese patients may have been higher in our sample. While we cannot ignore that obese patients may be more likely to withhold reporting their body weight, we found no systematic difference in the baseline characteristics of all patients included in the registry and the patients included in this analysis. Third, the sample size calculation for the subgroup analysis, based on preset criteria, required a sample size of 33 patients per group for a longitudinal analysis compar-ing the lean patients with the obese patients. There were insufficient patients with NP available to rule out a type 2 error and therefore our findings for the neck pain population need to be interpreted with caution.
Implications for research
Further research should address the influence of se-vere obesity on the treatment response in patients with LBP. Our study showed that obese patients with LBP feel more disabled. Experimental research sug-gests that obesity is associated with altered muscle protein synthesis [52]. Further, it has been suggested, that the presence of obesity-related comorbidities (e.g. diabetes, hypertension) are associated with more
morbidity and mortality [53, 54]. The influence of obesity on response to treatment for LBP with and without the presence of comorbidities should be fur-ther investigated. Weight loss after bariatric surgery has been shown to be associated with less LBP, NP, and other joint pain and may therefore need to be considered as an added therapeutic strategy in obese patients with LBP [55]. We found no indication that obesity was associated with worse treatment outcome in NP patients. However, the patient sample available for this analysis was small and this should be addressed in lar-ger studies.
Implications for clinical practice
While our findings have some limitations, they pro-vide some insight into a patient population treated at a busy back pain clinic. Our findings indicate that obese patients with LBP express more disability at baseline and we found some indication that they may not recover as well as overweight and lean subjects. Treatment interventions might therefore incorporate approaches addressing body weight or use alternative approaches to exercise routines. It has been shown that improved fitness slowed the decline in mobility in overweight adults with type 2 diabetes [48]. Our find-ings suggest that severe obesity might require specific guidance and that severely obese patients might ex-perience more disability associated with LBP when compared to lean and overweight patients. When not considered, this might lead to a negative feedback for the patient and lead to early termination of physical therapy in these patients and worse outcomes, includ-ing chronic, disablinclud-ing pain.
Conclusion
Overweight and obesity are associated with higher levels of disability before treatment in LBP patients, but not in NP. In obese class II–III patients with LBP, the rate of MID was lowest, indicating that these pa-tients experienced worse treatment response com-pared to the other groups. Further studies should address the impact of severe obesity on LBP recovery. In particular, treatment strategies combining weight management, cardiovascular fitness, physical limita-tions and low back pain rehabilitation should be investigated.
Availability of supporting data
Appendix
Table 6Baseline characteristics of all patients in the OIOC registry
LBP cross-sectional LBP longitudinal NP cross-sectional NP longitudinal
General Characteristics
Patients 805 305 256 91
Age: median (IQR) 52 (39; 63) 52 (41; 62) 50 (38; 59) 51 (39; 62)
No age reported 55 9 26 2
Gender female:n(%) 429 (53) 168 (55) 144 (56) 56 (62)
No gender 52 9 25 2
BMI: median (IQR) 26.6 (23.1; 30.2) 26.1 (22.8; 29.1) 24.8 (22.4; 28.3) 24.7 (22.5; 28.1)
No BMI:n(%) 257 (32) 94 (31) 65 (25) 20 (23)
Married or in a relationship:n(%) 321 (40) 130 (43) 99 (39) 43 (47)
No relationship:n(%) 397 (49) 150 (49) 122 (48) 42 (46)
Not reported:n(%) 87 (11) 25 (8) 35 (14) 6 (7)
Low education (no high school diploma):n(%) 75 (9) 19 (6) 10 (4) 2 (2)
High school diploma and higher education:n(%) 609 (76) 248 (81) 196 (74) 74 (81)
No education reported:n(%) 121 (15) 38 (12) 50 (20) 15 (16)
Insurance Type
Medicare/Medicaid:n(%) 275 (34) 104 (34) 51 (19) 19 (21)
No fault:n(%) 5 (0.01) 3 (0.01) 11 (4) 5 (5)
Workers compensation:n(%) 45 (6) 22 (7) 14 (5) 7 (8)
Other (private, others):n(%) 425 (53) 166 (54) 155 (61) 58 (64)
Not reported:n(%) 54 (7) 10 (3) 25 (10) 2 (2)
Occupation
White collar worker:n(%) 212 (26) 82 (27) 88 (34) 29 (32)
Blue collar worker:n(%) 111 (13) 39 (13) 27 (11) 11 (12)
Not reported:n(%) 109 (13) 32 (11) 40 (16) 9 (10)
Work Status
Retired:n(%) 109 (14) 48 (16) 24 (9) 11 (12)
Not working:n(%) 331 (41) 129 (42) 71 (28) 29 (32)
Not working because of ill health or pain:n(%) 128 (16) 52 (17) 24 (9) 9 (10)
Workers compensation case to the main complaint:n(%) 26 (3) 14 (5) 8 (3) 6 (7)
Working full time/part time 367 (46) 146 (48) 144 (56) 55 (60)
Limited duty 21 (3) 7 (2) 6 (2) 2 (2)
Self-reported measures
Baseline ODI/NDI: median, IQR 30 (18; 46) 28.9 (18; 44) 16 (9; 24) 14.4 (9.5; 21.6)
End of treatment ODI/NDI: median, IQR – 22 (10; 35.6) – 11 (4.4; 16.1)
No end of treatment ODI/NDI – 18 – 3
Baseline NRS: median, IQR 6 (4; 8) 6 (4; 8) 6 (3; 8) 6 (3; 8)
No baseline NRS 86 24 30 6
End of treatment NRS: median, IQR – 4 (3; 6) – 4 (2; 5)
No end of treatment NRS – 239 – 68
Baseline FABQ-W: median, IQR 9 (0; 21) 8 (0; 19) 12 (3; 21) 11 (0; 21)
Competing interests
The authors declare no financial interests or affiliations with institutions, organizations, or companies relevant to the manuscript. All authors had full access to the data, interpreted the analysis and commented on the final manuscript.
Authors’contributions
MW, MC, SSW conceived of the study and were responsible for the acquisition of data. UH and MW conducted the analysis. MW drafted the manuscript. All authors interpreted the data, were involved in revising the manuscript critically for important intellectual content and gave their final approval of the version to be published.
Acknowledgments
This study was performed in collaboration with many experienced researchers and clinicians. The authors thank the research team of the Occupational and Industrial Orthopaedic Center (OIOC), New York University (NYU) Langone Medical Center in New York for their very valuable discussions and support. In particular we thank Dr. Angela Lis, who is responsible for the clinical registry and worked many hours to ensure data collection and quality. A special word of thanks is extended to the clinical and administrative staff that collected the patient information, entered the forms into the registry system, and worked on the quality of the data. Finally, we thank Mr. Rudi Hiebert for compiling the de-identified data forms.
Author details
1Horten Centre for Patient Oriented Research and Knowledge Transfer,
Department of Internal Medicine, Zurich University, University Hospital Zurich, Pestalozzistrasse 24, CH-8032 Zurich, Switzerland.2NYU Hospital for Joint Diseases, Occupational and Industrial Orthopaedic Center (OIOC), New York University, 63 Downing Street, New York, NY 10014, USA.3Division of General Internal Medicine, Bern University Hospital, Bern University, Freiburgstrasse 8, CH-3010 Bern, Switzerland.
Received: 10 September 2015 Accepted: 19 March 2016
References
1. Flegal KM, Carroll MD, Ogden CL, Curtin LR. Prevalence and trends in obesity among US adults, 1999-2008. JAMA. 2010;303(3):235–41. 2. Ricci JA, Chee E. Lost productive time associated with excess weight in the
U.S. workforce. J Occup Environ Med. 2005;47(12):1227–34.
3. Capodaglio P, Castelnuovo G, Brunani A, Vismara L, Villa V, Capodaglio EM. Functional limitations and occupational issues in obesity: a review. Int J Occup Saf Ergon. 2010;16(4):507–23.
4. Vismara L, Menegoni F, Zaina F, Galli M, Negrini S, Capodaglio P. Effect of obesity and low back pain on spinal mobility: a cross sectional study in women. J Neuroeng Rehabil. 2010;7:3.
5. Mantyselka P, Kautiainen H, Vanhala M. Prevalence of neck pain in subjects with metabolic syndrome–a cross-sectional population-based study. BMC Musculoskelet Disord. 2010;11:171.
6. Ma VY, Chan L, Carruthers KJ. Incidence, prevalence, costs, and impact on disability of common conditions requiring rehabilitation in the United States: stroke, spinal cord injury, traumatic brain injury, multiple sclerosis, osteoarthritis, rheumatoid arthritis, limb loss, and back pain. Arch Phys Med Rehabil. 2014;95(5):986–95. e981.
7. Balagué F, Mannion AF, Pellisé F, Cedraschi C. Non-specific low back pain. Lancet. 2012;379(9814):482-91. doi:10.1016/S0140-6736(11)60610-7. Epub 2011 Oct 6.
8. Hogg-Johnson S, van der Velde G, Carroll LJ, Holm LW, Cassidy JD, Guzman J, Côté P, Haldeman S, Ammendolia C, Carragee E et al: The burden and determinants of neck pain in the general population: results of the bone and joint decade 2000–2010 Task Force on neck pain and its associated disorders. J Manipulative Physiol Ther. 2009;32(2, Supplement):S46–60. 9. Carroll L, Hogg Johnson S, Côté P, van der Velde G, Holm L, Carragee E,
Hurwitz E, Peloso P, Cassidy JD, Guzman J et al: Course and prognostic factors for neck pain in workers: results of the Bone and Joint Decade 2000-2010 Task Force on Neck Pain and Its Associated Disorders. Spine (Philadelphia, Pa 1976). 2008;33(4 Suppl):S93–100.
10. Carroll L, Hogg Johnson S, van der Velde G, Haldeman S, Holm L, Carragee E, Hurwitz E, CÃtÃP, Nordin M, Peloso P et al: Course and prognostic factors for neck pain in the general population: results of the Bone and Joint Decade 2000-2010 Task Force on Neck Pain and Its Associated Disorders. Spine (Philadelphia, Pa 1976). 2008;33(4 Suppl):S75–82. 11. Chou R, Loeser JD, Owens DK, Rosenquist RW, Atlas SJ, Baisden J, Carragee
EJ, Grabois M, Murphy DR, Resnick DK et al: Interventional therapies, surgery, and interdisciplinary rehabilitation for low back pain: an evidence-based clinical practice guideline from the American Pain Society. Spine. 2009; 34(10):1066–77.
12. Hurwitz EL, Carragee EJ, van der Velde G, Carroll LJ, Nordin M, Guzman J, Peloso PM, Holm LW, Cote P, Hogg-Johnson S et al: Treatment of neck pain: noninvasive interventions: results of the Bone and Joint Decade 2000-2010 Task Force on Neck Pain and Its Associated Disorders. Spine. 2008;33(4 Suppl): S123–52.
13. Hill J, Whitehurst DGT, Lewis M, Bryan S, Dunn K, Foster N, Konstantinou K, Main C, Mason E, Somerville S et al: Comparison of stratified primary care management for low back pain with current best practice (STarT Back): a randomised controlled trial. Lancet. 2011;378(9802):1560–71. 14. Pransky G, Borkan JM, Young AE, Cherkin DC. Are we making progress? The
tenth international forum for primary care research on low back pain. Spine. 2011;36(19):1608–14.
15. Bener A, Alwash R, Gaber T, Lovasz G. Obesity and low back pain. Collegium Antropologicum. 2003;27(1):95–104.
16. Anandacoomarasamy A, Caterson I, Sambrook P, Fransen M, March L. The impact of obesity on the musculoskeletal system. Int J obesity (2005). 2008; 32(2):211–22.
17. Auffinger B, Lam S, Kraninger J, Shen J, Roitberg BZ: The Impact of Obesity on Surgeon Ratings and Patient-Reported Outcome Measures After Degenerative Cervical Spine Disease Surgery. World Neurosurg. 2014;82(1-2): e345-52. doi:10.1016/j.wneu.2013.09.053. Epub 2013 Oct 18.
18. Perrot S, Allaert FA, Concas V, Laroche F.“When will I recover?”A national survey on patients’and physicians’expectations concerning the recovery time for acute back pain. Eur Spine J. 2009;18(3):419–29.
19. Shiri R, Karppinen J, Leino-Arjas P, Solovieva S, Viikari-Juntura E. The association between obesity and low back pain: a meta-analysis. Am J Epidemiol. 2010;171(2):135–54.
20. Dionne CE, Koepsell TD, Von Korff M, Deyo RA, Barlow WE, Checkoway H. Predicting long-term functional limitations among back pain patients in primary care settings. J Clin Epidemiol. 1997;50(1):31–43.
21. Wertli MM, Burgstaller JM, Weiser S, Steurer J, Kofmehl R, Held U. Influence of catastrophizing on treatment outcome in patients with nonspecific low back pain: a systematic review. Spine. 2014;39(3):263–73.
[image:13.595.58.538.100.185.2]22. Wertli MM, Rasmussen-Barr E, Held U, Weiser S, Bachmann LM, Brunner F: Fear-avoidance beliefs-a moderator of treatment efficacy in patients
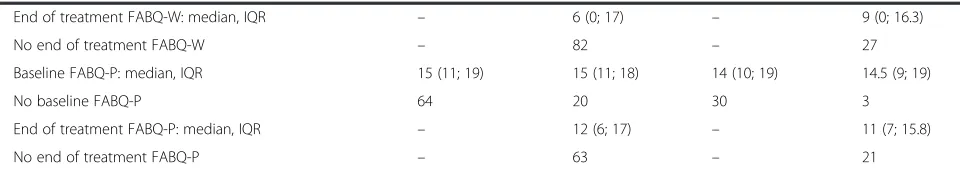
Table 6Baseline characteristics of all patients in the OIOC registry(Continued)
End of treatment FABQ-W: median, IQR – 6 (0; 17) – 9 (0; 16.3)
No end of treatment FABQ-W – 82 – 27
Baseline FABQ-P: median, IQR 15 (11; 19) 15 (11; 18) 14 (10; 19) 14.5 (9; 19)
No baseline FABQ-P 64 20 30 3
End of treatment FABQ-P: median, IQR – 12 (6; 17) – 11 (7; 15.8)
with low back pain: a systematic review. Spine J. 2014;14(11):2658-78. doi:10.1016/j.spinee.2014.02.033. Epub 2014 Mar 12.
23. Leboeuf-Yde C. Body weight and low back pain. A systematic literature review of 56 journal articles reporting on 65 epidemiologic studies. Spine. 2000;25(2):226–37.
24. Sellinger JJ, Clark EA, Shulman M, Rosenberger PH, Heapy AA, Kerns RD. The moderating effect of obesity on cognitive-behavioral pain treatment outcomes. Pain Med. 2010;11(9):1381–90.
25. Vincent HK, Omli MR, Day T, Hodges M, Vincent KR, George SZ. Fear of movement, quality of life, and self-reported disability in obese patients with chronic lumbar pain. Pain Med. 2011;12(1):154–64.
26. Malmqvist S, Leboeuf-Yde C, Ahola T, Andersson O, Ekstrom K, Pekkarinen H, et al. The Nordic back pain subpopulation program: predicting outcome among chiropractic patients in Finland. Chiropr Osteopath. 2008;16:13. 27. Macfarlane GJ, Thomas E, Croft PR, Papageorgiou AC, Jayson MI, Silman AJ.
Predictors of early improvement in low back pain amongst consulters to general practice: the influence of pre-morbid and episode-related factors. Pain. 1999;80(1-2):113–9.
28. Lis A, Weiser S, Campello MA, Hiebert R, Nordin M. Development of a conservative care registry for patients with spine pain. Spine J. 2012; 12(9):S55–6.
29. vvon Elm E, Altman DG, Egger M, Pocock SJ, Gotzsche PC, Vandenbroucke JP, Initiative S: Strengthening the Reporting of Observational Studies in Epidemiology (STROBE) statement: guidelines for reporting observational studies. BMJ. 2007;335(7624):806–8.
30. Pincus T, Santos R, Breen A, Burton AK, Underwood M. A review and proposal for a core set of factors for prospective cohorts in low back pain: A consensus statement. Arthritis Care Res (Hoboken). 2008;59(1):14–24.
31. Röder CR, El-Kerdi AE-K, Grob DG, Aebi MA. A European spine registry. Eur Spine J. 2002;11(4):303–7.
32. Roder C, Chavanne A, Mannion AF, Grob D, Aebi M. SSE Spine Tango–content, workflow, set-up. http://www.eurospine.org/spine-tango.htm Tango. Eur Spine J. 2005;14(10):920–4.
33. Chou R, Qaseem A, Snow V, Casey D, Cross JT, Shekelle P, Owens D: Diagnosis and treatment of low back pain: a joint clinical practice guideline from the American College of Physicians and the American Pain Society. Ann Intern Med. 2007;147(7):478–91.
34. Fritz JM, Irrgang JJ. A comparison of a modified oswestry low back pain disability questionnaire and the quebec back pain disability scale. Phys Ther. 2001;81(2):776–88.
35. Howard V. The neck disability index: State-of-the-Art, 1991-2008. J Manip Physiol Ther. 2008;31(7):491–502.
36. Ostelo RW, Deyo RA, Stratford P, Waddell G, Croft P, Von Korff M, Bouter LM, de Vet HC: Interpreting change scores for pain and functional status in low back pain: towards international consensus regarding minimal important change. Spine. 2008;33(1):90–4.
37. BMI classification [http://apps.who.int/bmi/index.jsp?introPage=intro_3.html] Access year 2015.
38. Hoy D, Brooks P, Blyth F, Buchbinder R. The Epidemiology of low back pain. Best Practice Res Clin Rheumatol. 2010;24(6):769–81.
39. Downie WW, Leatham PA, Rhind VM, Wright V, Branco JA, Anderson JA. Studies with pain rating scales. Ann Rheum Dis. 1978;37(4):378–81. 40. Waddell G, Newton M, Henderson I, Somerville D, Main CJ. A Fear-Avoidance
Beliefs Questionnaire (FABQ) and the role of fear-avoidance beliefs in chronic low back pain and disability. Pain. 1993;52(2):157–68.
41. Wertli MM, Rasmussen-Barr E, Weiser S, Bachmann LM, Brunner F. The role of fear avoidance beliefs as a prognostic factor for outcome in patients with nonspecific low back pain: a systematic review. Spine J. 2014;14(5):816–36. e814.
42. Rothman KJ, Greenland S, Lash TL. Introduction to stratified analysis. In: Sonya S, editor. Modern epidemiology, vol. 1. Third Editionth ed. Philadelphia, PA 19106 USA: Lippincott William & Wilkins; 2008. p. 258–82. 43. R: a language and environment for statistical computing
[http://www.R-project.org/] Access year 2015.
44. Mangwani J, Giles C, Mullins M, Salih T, Natali C. Obesity and recovery from low back pain: a prospective study to investigate the effect of body mass index on recovery from low back pain. Ann R Coll Surg Engl. 2010;92(1):23–6. 45. Cuesta-Vargas AI, Gonzalez-Sanchez M. Obesity effect on a multimodal
physiotherapy program for low back pain suffers: patient reported outcome. J Occup Med Toxicol (London, England). 2013;8(1):13.
46. Vincent HK, Ben-David K, Conrad BP, Lamb KM, Seay AN, Vincent KR. Rapid changes in gait, musculoskeletal pain, and quality of life after bariatric surgery. Surg Obes Relat Dis. 2012;8(3):346–54.
47. Khoueir P, Black MH, Crookes PF, Kaufman HS, Katkhouda N, Wang MY. Prospective assessment of axial back pain symptoms before and after bariatric weight reduction surgery. Spine J. 2009;9(6):454–63. 48. Rejeski WJ, Ip E, Bertoni A, Bray G, Evans G, Gregg E, Zhang Q: Lifestyle
change and mobility in obese adults with type 2 diabetes. N Engl J Med. 2012;366(13):1209–17.
49. Urquhart DM, Berry P, Wluka AE, Strauss BJ, Wang Y, Proietto J, Jones G, Dixon JB, Cicuttini FM: 2011 Young Investigator Award winner: Increased fat mass is associated with high levels of low back pain intensity and disability. Spine. 2011;36(16):1320–5.
50. Wong JJ, Côté P, Quesnele JJ, Stern PJ, Mior SA. The course and prognostic factors of symptomatic cervical disc herniation with radiculopathy: a systematic review of the literature. Spine J. 2014;14(8):1781–9.
51. Rasmussen Barr E, Bohman T, Hallqvist J, Holm LW, Skillgate E. Do physical activity level and body mass index predict recovery from persistent neck pain in men and women of working age? A population-based cohort study. Eur Spine J. 2013;22(9):2077–83.
52. Murton AJ, Marimuthu K, Mallinson JE, Selby AL, Smith K, Rennie MJ, Greenhaff PL: Obesity appears to be associated with altered muscle protein synthetic and breakdown responses to increased nutrient delivery in older men, but not reduced muscle mass or contractile function. Diabetes. 2015; 64(9):3160-71. doi:10.2337/db15-0021. Epub 2015 May 26.
53. Murton AJ, Marimuthu K, Mallinson JE, Selby AL, Smith K, Rennie MJ, Greenhaff PL: Edmonton Obesity Staging System: association with weight history and mortality risk. Appl Physiol Nutr Metab. 2011;36(4):570–6. 54. Abdullah A, Wolfe R, Mannan H, Stoelwinder JU, Stevenson C, Peeters A.
Epidemiologic merit of obese-years, the combination of degree and duration of obesity. Am J Epidemiol. 2012;176(2):99–107.
55. Cakir T, Oruc MT, Aslaner A, Duygun F, Yardimci EC, Mayir B, Bulbuller N: The effects of laparoscopic sleeve gastrectomy on head, neck, shoulder, low back and knee pain of female patients. Int J Clin Exp Med. 2015;8(2):2668–73.
• We accept pre-submission inquiries
• Our selector tool helps you to find the most relevant journal
• We provide round the clock customer support
• Convenient online submission
• Thorough peer review
• Inclusion in PubMed and all major indexing services
• Maximum visibility for your research
Submit your manuscript at www.biomedcentral.com/submit