International Research Journal of Natural and Applied Sciences Vol. 3, Issue 7, July 2016 IF- 3.827 ISSN: (2349-4077)
© Associated Asia Research Foundation (AARF)
Website: www.aarf.asiaEmail : [email protected] , [email protected]
CHARACTER CORRELATION AND PATH COEFFICIENT IN BLACK GRAM
[Vigna Mungo (L.) Hepper]
J. Sateesh Babu, Y. Pushpa Reni and M.V. Ramana
Regional Agricultural Research Station, Lam, Guntur-522034, A.P
ABSTRACT
India has distinction of being world's largest producer of pulses. The production of
pulses in the country is 132.46 lakh tones from an area of 223.64 lakh hectares, with productivity
of 592 kg per hectare (Anonymous, 2007). Among the pulses, black gram is important pulse crop
grown in Andhra Pradesh, Madhya Pradesh, Orissa, Karnataka, Maharashtra, Tamil Nadu and
Uttar Pradesh during Kharif season. As seed yield is very complex character and depends upon
numerous genetic factors interacting with the environment, it is always advisable to find out the
interrelationship of yield component with highly heritable characters and giving selection
pressure on these characters, which accounts for the indirect selection. To accumulate optimum
contribution of yield contributing characters, it is essential to know the correlation of various
characters along with path coefficients. The present study was undertaken to estimate phenotypic
and genotypic associations between yield contributing characters alongwith path analysis for
developing suitable selection criterion for blackgram improvement.Twenty five genotypes of
blackgram (Vigna mungo (L) were evaluated during rabi 2015 for the estimation of genetic
variability parameters, correlation coefficient and path coefficient analysis. The genotypes
differed significantly for all characters. High GCV and PCV was observed for number of pods
per plant (34.54%; 35.23%) followed by seed yield (32. 52%; 34.95%), number of branches per
plant (26.10%, 29.69%) and Plant height (16.88%,21.62%).High heritability coupled with high
the impact of additive gene action. Number of branches per plant showed significantly positive
correlation with yield both at phenotypic and genotypic level. Plant height showed significant
negative correlation with yield both at phenotypic and genotypic level. Maximum direct effect of
number of branches per plant on seed yield was observed.
INTRODUCTION
Blackgram [Vignamungo (L) Hepper] is a self-pollinated crop with low percentage of natural out
crossing. It belongs to family fabaceae. The center of origin of blackgram is in India. Its seeds
are highly nutritious with protein (24-26%), carbohydrates (60%), fat (1.5%), minerals, amino
acids and vitamins. The biological value improves greatly, when wheat or rice is combined with
Blackgram because of the complementary relationship of the essential amino acids such as
arginine, leucine, lysine, isoleucine, valine and phenylalanine etc. India is the largest producer
and consumer of blackgram in the world. Blackgram has been distributed mainly in tropical to
sub-tropical countries where it is mainly grown in India, Pakistan, Sri-Lanka, Burma, and some
countries of South East Asia. Its annual production is 17.60 lakh tones from 32.60 lakh hectare
area in India with an average productivity of 534 kg/ha. In Madhya Pradesh, the annual
production of blackgram is 2.31 lakh tones from an area of 5.92 lakh hectares. However average
productivity is 390 kg/ha, which is very low, and thus its genetic yield potential in warranted
(Source: - Project co-ordinates (MULLaRP) Report, IIPR, Kanpur 2011-2012). Genetic
variability and their assessment for qualitative and quantitative traits of economic importance are
prerequisite for any crop-improvement programme. The knowledge of correlation and path
analysis is important to understand the association between the yield and its contributing
character to find out guidelines for better selection of quantitative traits. Success of yield
improvement largely depends upon the magnitude and nature of genetic variability present in
yield contributing traits. If the variability in among germplasm the population is largely of
genetic nature with least environmental influence, the probability of isolating genetically
superior genotypes is high. Correlation studies also provide better understandings of yield
components that help the plant breeder during selection (Robinson et al.1951 and Johnson et
al.1955). The present study was carried out to understand genetic variability among 75
blackgram germ plasm collected from geographically diverse ecology of India, and to isolate
MATERIALS AND METHODS
The experimental material comprised of 25 promising lines of blackgram from different enteres
of india were grown in randomized block design with three replications at Research Farm, Lam,
Guntur during Rabi 2015. Each plot consisted of four rows of 4m length with 10cm plant to
plant and 30cm row to row distance. The observations were recorded on 5 randomly selected
plants from each plot for plant height, number of branches per plant, days to 50 % flowering,
pods per plant, 100-seed weight and seed yield per plant. Correlation between six quantitative
characters was estimated according to the method given by Singh and Chaudhary (1977);
whereas path coefficient analysis was done by method given by Dewey and Lu (1959). The
statistical analysis and variance due to different sources was worked out according to Panse and
Sukhatme (1967). Phenotypic and genotypic coefficients of variation were calculated based on
the method advocated by Burton (1952). Heritability in broad sense and genetic advance as
percent of means were estimated suggested by Jhonson et al. (1955).
RESULTS AND DISSCUSSIONS
Analysis of variance Analysis of variance was carried out for six characters in 25 genotypes
and the results are presented in Table 1. The variance due to treatments (genotypes) was
significant for all six characters. This gives the evidence of magnitude of genetic variability
among genotypes. Genotypes were differed significantly for all the characters . The variance due
to varities was significant for six traits viz.,Days to 50% flowering, Plant height, branches per
plant, pods per plant, 100 seed weight and seed yield, indicating that the sufficient variability
was present for above traits. The estimates of phenotypic coefficients of variation were higher
than genotypic coefficients of variation which indicating that the environmental factors
influencing the characters studied (Table 2). These results are in accordance with the findings of
Panigrahi et al. (2014) and Konda et al. (2009). The highest PCV recorded for pods per plant
(35.22) followed by seed yield (34.94), plant height (29.68) suggesting that sufficient phenotypic
variability was present for these traits in the materials and the favorable effect of environment.
High PCV for grain yield also reported earlier in chickpea by Yaqoob et al. (2010). The highest
GCV recorded for pods per plant(34.54) followed by seed yield (32.52), plant height (26.10)
(Table 2), indicating the presence of variation for these characters in the materials and
agreement with the findings of Panigrahi et al. (2014) for seed yield in blackgram. Heritability
estimates provides the assessment of amount of transmissible genetic variability to total
variability, happens to be the most important basic component that determines the genetic
improvement or response to selection. In the present study, the highest heritability (broad sense)
was recorded for pods per plant 96%), yield (86%),branches per plant (78%) and plant height
(77%)(Table 2) indicating that the selection of these traits are likely to accumulate more additive
genes leading to further improvement of their performance and these traits may be used as
selection criteria in blackgram breeding program. Similar observation were reported in
blackgram by Panigrahi et al. (2014) for branches per plant Malik et al. (2006) in soyabean for
pods per plant, branches per plant and grain yield per plant. The high genetic advance was
recorded for pods per plant (69.77) followed by seed yield (62.34), plant height (47.28), Days to
50% flowering(27.14). Hence, priority should be given to those traits which recorded higher
estimates of genetic advance as percent of mean while deciding selection strategies and selection
of these characters may be effective. Similar results reported in blackgram by Panigrahi et al.
(2014). Low genetic advances were observed branches per plant (4.07)and 100 seed weight
(5.37). Similar low genetic advance as percent of mean for 100 seed weight was reported in
blackgram by Parameswarappa and Kumar (2005).However, heritability values coupled with
genetic advance would be more reliable (Johnson et al., 1955) and useful in formulating
selection procedure. In the present study, heritability estimates in broad sense and genetic
advance as percent of mean were estimated. High genetic advance as percent of mean coupled
with high heritability was observed for pods per plant, seed yield per plant and plant height
suggesting that the importance of additive gene action and selection of these characters may be
effective for improvement of productivity in blackgram.
The estimates of genotypic and phenotypic correlation coefficients between different
characters of black gram genotypes are presented in Table 1. In present investigation number of
branches per plant showed highly significant positive correlation with seed yield per plant at both
phenotypic and genotypic level. It suggested that increase in growth related traits, number of
branches per plant, number of pods per plant, pod characters and seed characters might
contribute to high yields in black gram. This situation meant to select high yielding genotypes of
black gram, it was essential to consider the above characters with their increasing magnitude. It
helped in simultaneous improvement of all the positively correlated characters. Similar results
On the basis of correlation studies more emphasis is to be given on number of branches per plant
contributing characters based on their strong correlation with seed yield per plant in black gram.
When more number of variables were considered in correlation, the association becomes more
complex and does not have the meaningful interpretation obvious. Hence, genotypic correlation
partitioned in to direct and indirect effects to specify the cause and their relative importance,
(Table 2). Number of branches per plant exhibited positive direct effect on seed yield per plant.
This character has also been identified as major direct contributors towards seed yield in
blackgram by earlier workers (Umadevi and Meenakshi 2005 and Konda 2008). Plant height
showed negative direct effect on seed yield per plant. This character had positive indirect effect
through days to 50% flowering, and pods per plant which resulted in negative and significant
correlation with seed yield per plant. Higher positive direct effect exhibited by branches per plant
with seed yield per plant but it had high negative indirect effect via days to 50 per cent
flowering, number of pods per plant and 100 seed weight.
Conclusion : Magnitude of phenotypic coefficients of variation in selected blackgram
germplasm was higher than genotypic coefficients of variation, indicating that environmental
factors are influencing studied characters. High genetic advance and high heritability was
recorded for pods per plant, seed yield and plant height hence selections based on the traits could
Table :1 Analysis of variance for yield and yield attributing characters of 25 blackgram
genotypes during rabi 2015
Source Variation Replication Accessions Error
df 2 24 48
character Mean sum of square
Days to 50% flowering 0.280 2.614*** 0.224
Plant height (cm) 3.64 222.513*** 39.14
Branches/plant 0.026 1.3655*** 0.121
Pods/plant 0.777 355.95*** 4.686
100 seed weight (g) 0.003 0.074*** 0.015
[image:6.612.66.491.330.505.2]Yield (Kg/ha) 35670.45 257909.83*** 12657.38
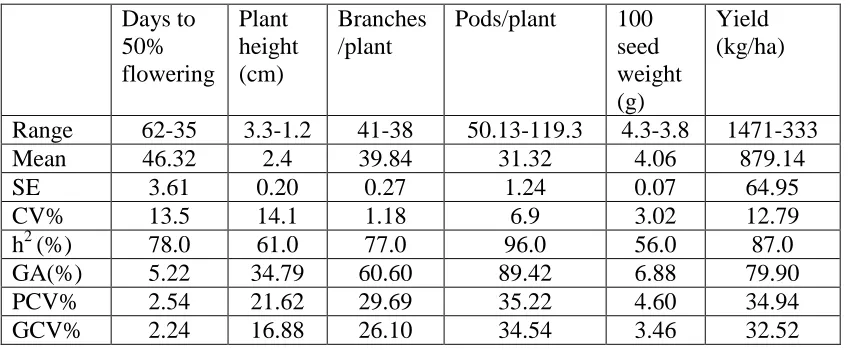
Table 2 : variability and genetic parameter for different character s of blackgram
Days to 50% flowering
Plant height (cm)
Branches /plant
Pods/plant 100
seed weight (g)
Yield (kg/ha)
Range 62-35 3.3-1.2 41-38 50.13-119.3 4.3-3.8 1471-333
Mean 46.32 2.4 39.84 31.32 4.06 879.14
SE 3.61 0.20 0.27 1.24 0.07 64.95
CV% 13.5 14.1 1.18 6.9 3.02 12.79
h2 (%) 78.0 61.0 77.0 96.0 56.0 87.0
GA(%) 5.22 34.79 60.60 89.42 6.88 79.90
PCV% 2.54 21.62 29.69 35.22 4.60 34.94
Table 2: Estimates of phenotypic and genotypic (in parenthesis) correlation coefficients between yield and yield components in 25 blackgram (vigna mungo L.) genotypes
Character Plant
height (cm)
Branches /plant
Pods/plant 100 seed weight (g)
Yield (Kg/ha)
Days to 50% flowering P -0.1617 0.0715 -0.0204 -0.0859 0.0207
G (-0.1420) (0.0458) (-0.0267) (-0.1257) (-0.0007)
Plant height (cm) P -- -0.2772* -0.2538* 0.0369 -0.2451*
G -- (-0.2616) (-0.3339) (-0.0068) (-0.3315)
Branches/plant P -0.2772* -- 0.0606 0.0123 0.7133***
G (-0.2616) -- (0.0925) (0.0061) (0.8535)
Pods/plant P -0.2538* 0.0606 -- 0.2063 -0.0098
G (-0.3339) (0.0925) -- (0.2860) (-0.0263)
100 seed weight (g) P 0.0369 0.0123 0.2063 -- -0.0791
G (-0.0068) (0.0061) (0.2860) -- (-0.0969)
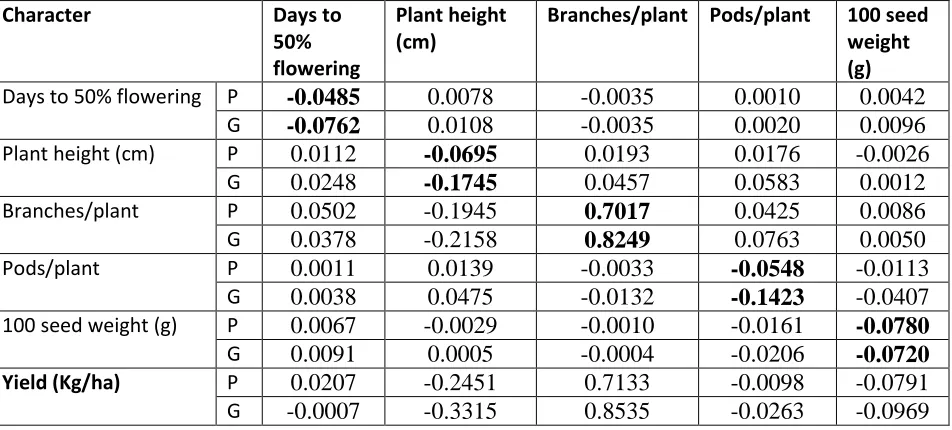
Table 3: Estimates of direct (bold) and indirect effect s of yield components in in 25 blackgram (vigna mungo L.) genotypes
Character Days to
50% flowering
Plant height (cm)
Branches/plant Pods/plant 100 seed
weight (g) Days to 50% flowering P -0.0485 0.0078 -0.0035 0.0010 0.0042
G -0.0762 0.0108 -0.0035 0.0020 0.0096
Plant height (cm) P 0.0112 -0.0695 0.0193 0.0176 -0.0026
G 0.0248 -0.1745 0.0457 0.0583 0.0012
Branches/plant P 0.0502 -0.1945 0.7017 0.0425 0.0086
G 0.0378 -0.2158 0.8249 0.0763 0.0050
Pods/plant P 0.0011 0.0139 -0.0033 -0.0548 -0.0113
G 0.0038 0.0475 -0.0132 -0.1423 -0.0407
100 seed weight (g) P 0.0067 -0.0029 -0.0010 -0.0161 -0.0780
G 0.0091 0.0005 -0.0004 -0.0206 -0.0720
Yield (Kg/ha) P 0.0207 -0.2451 0.7133 -0.0098 -0.0791
G -0.0007 -0.3315 0.8535 -0.0263 -0.0969
REFERENCES
Anonymous. (2007). Directorate of Pulses Development (Bhopal), Annual Progress report-2007.
[image:7.612.71.547.342.557.2]Chauhan, M.P., Mishra, A.C. and Singh, A.K. (2007). Correlation and path analysis in urdbean. Legume Res., 30 (3): 205-208.
Dewey, D.R. and Lu, K.H. (1959). A Correlation and path coefficient analysis of component of wheat grass production. Agron J., 51 : 515-518.
Johnson HW, Robinson HF, Comstock RE (1955). Estimation of genetic and environmental variability in soybeans. Agronomy J 47: 314-318.
Konda, C.R., Salimath, P.M. and Mishra, M.N. (2008). Correlation and path coefficient analysis in black gram (Vigna mungo (L.) Hepper).
Konda CR, Salimath PM, Mishra MN (2009). Genotype and environment interaction for yield and its components in blackgram (Vigna mungo L. Hepper). Leg Res 32(3): 195-198.
Malik MFA, Qureshi AS, Ashraf M, Ghafoor A (2006). Genetic variability of the main yield related characters in soybean. Int J Agri Biol 8(6): 815.
Panigrahi KK, Mohanty A, Baisakh B (2014). Genetic divergence, variability and character association in landraces of blackgram (Vigna mungo L.) Hepper) from Odisha. J Crop and Weed 10(2): 155-165.
Panse VG, Sukhatme PV (1967). Statistical methods for agricultural workers. 2 nd Edition, ICAR New Delhi, India pp 381.
Parameswarappa SG, Kumar D. Lamani (2005). Genetic estimates, association and path coefficient analysis in blackgram. Karnataka J Agric Sci 18(1): 21-23.
Singh, R.K. and Chaudhari, B.D. (1977). Biometrical methods in quantitative genetic analysis. Kalyani Publishers, New Delhi. pp.3938.
Santha, S. and Paramasivam, K. (1999). Correlation and path analysis in rice follow black gram (Vigna mungo). Madras Agric. J., 86 (7-9): 397-400.
Umadevi. M. and Meenakshi. N.G. (2005). Correlation and path analysis for yield and yields components in black gram (Vigna mungo (L.)Hepper.) Madras Agric. J. 92 (10-12): 731-734.
Venkatesan, M., Veeramani, N., Anbuselvam, J. and Ganesan, J. (2004). Correlation and path analysis in black gram (Vigna mungo L.) Legume Res., 27 (3): 197-200.