2019 International Conference on Computation and Information Sciences (ICCIS 2019) ISBN: 978-1-60595-644-2
GPU-based Real-time Porous Medium
Dynamic Network Simulation
Chenxi Li, Min Li and Yanbing Tang
ABSTRACT
Porous medium network simulation is to accurately describe the seepage law of multiphase fluids in porous media. Researchers have studied the relationship between various macroscopic physical properties of multiphase fluids (e.g. relative permeability, capillary pressure and fluid saturation) from theoretical, experimental, and computer simulation. This research introduces the construction method of stochastic pore network model and describes the calculation steps of pore network pressure field. In this research, the computational efficiency of the GPU-based pore network was compared with CPU. The calculation speed and simulation model scale of the pressure domain of the random pore network were improved.
1. INTRODUCTION
In the study of the microscopic pore-throat structure of tight oil, it is necessary to construct a pore network model corresponding to the tight oil reservoir. This model is used to dynamically simulate the oil-water two-phase percolation process of tight oil reservoirs under different water flooding conditions, wettability and fluid properties [1].
At present, it has been possible to obtain two-phase percolation flow patterns, relative permeability, oil saturation and fluid distribution characteristics under
Chenxi Li, Network & information center, Southwest Petroleum University, Chengdu, 610500, China
Ming Li, State Key Laboratory of Oil and Gas Reservoir Geology and Exploitation, Southwest Petroleum University
different displacement conditions, injection multiples, and displacement times by simulation. However, there are still problems in the current calculation methods that need to be improve.
2. THEORIES
2.1Generation of stochastic pore network model
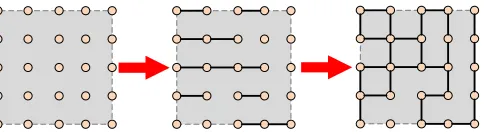
Taking the two-dimensional square mesh network model as an example, this paper introduces the modeling method of percolation network model. The percolation network model is characterized by the shape rules of the model, and the position of the nodes are fixed. Take a two-dimensional uniform square network with a node number 5 × 5 as an example, shown in Figure 1.
1) Determine the size and number of nodes of the network model. 2) Calculate the coordinates of each node in the network model. 3) Using a random method, determine whether there is tube bundle connection between adjacent nodes in the x direction and the y direction (50% in the x direction and 70% in the y direction).
[image:2.612.177.419.379.446.2]
Figure 1. Example of percolation network model construction.
2.2Pressure field simulation of network model
The difference between the inflow and outflow at any network node over a period of time is always equal to 0[2], denoted as:
, 1
0
i z
i j j
Q
Once the pressure on all nodes in the network is obtained, the fluid volume of the network input and output can be calculated. In this research, the direct solving method was used [3].
By performing a pressure conservation calculation on each node in the network model, a linear equation group equal to the number of pressure nodes of the unknown node can be obtained.
1) Assign an initial value to each node in the network; 2) Establish a relational expression between pressure and flow between nodes.
0(i, j, k) 1(i - 1, j, k)
6(i, j, k + 1)
3(i, j - 1, k)
2(i + 1, j, k)
x y
z
[image:3.612.219.379.229.371.2]4(i, j + 1, k) 5(i, j, k - 1)
Figure 2. Schematic diagram of simple cubic network node unit.
This paper uses a simple two-dimensional pore network as an example, as shown in Figure 3.
0 1
2 4
3 5
6 7
Flo w in
Flo w o ut
Figure 3. Two-dimensional pore network pressure field calculation.
[image:3.612.200.399.479.581.2]0 z
ij i
q
G p q
1 12 14 1 01
12 2 23 2
23 3 34 36 3
14 34 4 45 4
45 5 56 5
36 56 6 6
0 0 0
0 0 0 0
0 0 0
0 0 0
0 0 0 0
0 0 0 0
g g g p q
g g g p
g g g g p
g g g g p
g g g p
g g g p
ij
g is the conductivity of the current network connection; piis the pressure of each network node; qijis the pressure of the network connection.
Solving this matrix can get the pressure of each node in the network, and then can calculate the flow at the inlet and outlet of the model.
2.3Dynamic network computing based on GPU
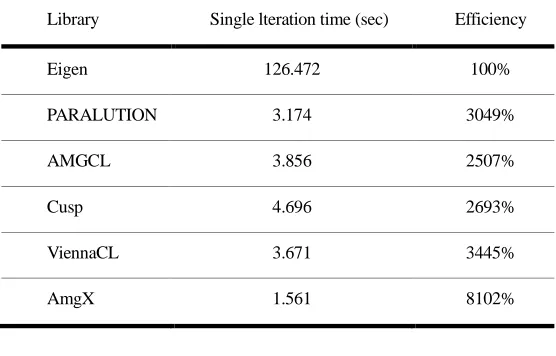
In order to calculate the pressure field more effectively, this paper used several matrix solving libraries such as Eigen, PARALUTION, AMGCL, Cusp, ViennaCL and AmgX for comparison.
[image:4.612.103.493.503.620.2]The experiment uses Eigen's running time as a reference to compare the efficiency of each GPU line calculation library. The benchmark platform we used is shown in Table II.
TABLE I. COMPARISON OF MATRIX LIBRARIES.
Library Cross-platform1 OpenMP CUDA OpenCL Stable release CUDA version Eigen ● ● / / 2018.12 / PARALUTION ● ● ● ● 2016.1 CUDA8 AMGCL ● ● ● ● 2018.5 CUDA9 Cusp ● / ● / 2014.10 CUDA7 ViennaCL ● ● ● ● 2016.1 CUDA8 AmgX ○2 ○3 ● / 2018.2 CUDA10 1.The Cross-platform in this table refer to Windows, Linux and macOS systems;
TABLE II. COMPUTING PLATFORM.
CPU Intel i7-7700HQ/Intel E5 2680 v3 x 2
GPU GTX 1060M/GTX Titan(Kepler)
OS Windows 10 1809
Development language C/Python/MATLAB
3. RESULTS
[image:5.612.158.436.330.508.2]The experiments in this paper used a pore network of about 2 million nodes (the number of network pores is 10*10*10). The calculation efficiency is based on the CPU operation time. The experimental results are shown in Table III and Figure 4:
TABLE III. Runtimes comparison of each computing library.
Library Single lteration time (sec) Efficiency
Eigen 126.472 100% PARALUTION 3.174 3049% AMGCL 3.856 2507% Cusp 4.696 2693% ViennaCL 3.671 3445% AmgX 1.561 8102%
Figure 4. Efficiency comparison of each computing library. 3049%
2507% 2693% 3445%
8102%
0% 3000% 6000% 9000%
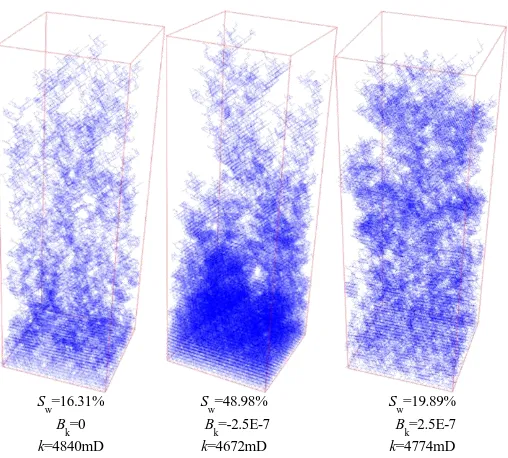
Figure 5. porous medium dynamic network simulation result
(σ/<r>=1.05, z=6, θ=40°).
As can be seen from the results above, NVIDIA's AmgX library is superior to other matrix library in solving performance. meanwhile, AmgX using multi-layer matrix decomposition to realize and solve large-scale matrix solution[4]. In the recent experiments, the matrix has been expanded to a level of 10 million and speedup to 100 times faster than CPU.
4. CONCLUSIONS
The AmgX library based on CUDA platform accelerates the calculation of the pressure field in the pore network simulation operation. At the same time, the high efficiency and ease of use of AmgX not only directly assists reservoir simulation studies, but also supports in subsequent deep learning reservoir simulation studies.
REFERENCES
1. Cheng. J. Chen. 2017. "Water flooding experiment and dynamic network simulation of tight oil reservoirs," Southwest Petroleum University.
S w=16.31%
B k=0 k=4840mD
S w=48.98% B
k=-2.5E-7 k=4672mD
S w=19.89% B
2. M. Li, Y. Tang, Y. Bernabé, J. Zhao, X. Li, and T. Li. 2017. “Percolation connectivity, pore size, and gas apparent permeability: Network simulations and comparison to experimental data,” Journal of Geophysical Research: Solid Earth, vol. 122, no. 7, pp. 4918-4930.
3. Wenlian Xiao. 2013. "Study on Nonlinear Effective Stress of Low Permeability Rock Permeability," Ph.D., Southwest Petroleum University.
4. J. Eaton. 2015. AmgX 2.0:Scaling toward CORAL [Online].Available: