QUANTIFYING THE IMPACT OF ENVIRONMENTAL POLICY ON
ENGINEERING DESIGN DECISIONS
BY
KATE S.WHITEFOOT
A dissertation submitted in partial fulfillment of the requirements for the degree of
Doctor of Philosophy (Design Science) in The University of Michigan
2011
Doctoral Committee:
Professor Steven J. Skerlos, Co-Chair
Assistant Professor Meredith L. Fowlie, Co-Chair, University of California-Berkeley Professor Panos Y. Papalambros
ii
ACKNOWLEDGEMENTS
First, I would like to acknowledge contributions to specific aspects of this work. Chapters 3 and 4 are based on a paper coauthored with Meredith Fowlie and Steven Skerlos, Chapter 4 is based on work coauthored with Steven Skerlos, and Chapter 5 is based on a paper coauthored with Hilary Grimes-Casey, Carol Girata, Ross Morrow, Greg Keoleian, and Steven Skerlos. Contributions of these coauthors are gratefully acknowledged. Thank you to Kevin Bolon for hugely important help obtaining and managing consumer demand and vehicle characteristic data sets. Katie Caruso
contributed to the literature review of consequential lifecycle assessment and Deokkyun Yoon assisted with some of the vehicle simulation work; their help is certainly
appreciated. The demand estimation code used to generate estimates in Chapter 3 was provided by Ashley Langer, who also very generously offered much of her time to discuss estimation strategies with me and troubleshoot through the code. This work has been supported by the National Science Foundation and the Rackham Graduate School at the University of Michigan; this support is gratefully acknowledged.
I want to especially thank my committee members for their support, time, and good ideas. I have been extremely fortunate to work with a committee so rich in both intellect and interest in the subject of my research. Thank you to Steve for all of his guidance as well as the friendly bantering on everything from springtime allergies to travel stories from Buenos Aires. Steve has been instrumental to the development of this work, largely by constantly questioning each step. Thank you to Meredith for all of her encouragement and her patience, and for many, many Skype conversations. She has been enormously valuable to my education in economics and the role of a researcher in
iii
talented students to which I owe the development of my philosophy of research; and finally for many good conversations and occasional spats about politics. Thank you to John for bringing a lot of realism about policy to my work and for his very thorough and much appreciated examination of my research. And finally, thank you to Ying for connecting me with the IO economics community at the University of Michigan and for bringing a sense of the larger concerns and opportunities in IO economics to my work.
Many thanks to everyone in the Optimal Design Lab, the EASTlab, and the Design Science program; I gratefully appreciate all of your friendship and support over the many years. Special thanks to J. Michalek, Bart Frischknecht, and Ross Morrow for their influence on my research, my philosophies on science and academia, and on many other things in life. I have been lucky enough to benefit from a large community of mentors at the University of Michigan and elsewhere and I especially want to thank Fred Feinberg, Rich Gonzalez, Gloria Helfand, and Ryan Kellogg. I also greatly appreciate the support of my family throughout this journey.
Finally, and most importantly, I am immensely thankful to my partner (in so many things), John. He has not only supported me through this process with
iv
PREFACE
A note to the multidisciplinarian:
A colleague of mine, Bart Frischknecht, once referred to scholars of multidisciplinary studies as cave men and women, finding their own way in the wilderness, far away from the glitzy cities of established disciplines. But I prefer the analogy of the multidisciplinarian as a traveler between cities. The ideal
multidisciplinarian is able to speak multiple languages, serving as an informed
ambassador, contributing to issues that are valued by the classical disciplines in which they reside. Yes, some of their ways may seem strange to single-disciplinarians because they are influenced by multiple cultures, but they should be fluent in the methods and motivations of each of the disciplines they claim and able to clearly communicate their work and its value in the language of each discipline.
The need for ambassadors between disciplines is clear in issue areas such as the environment. Environmental concerns have a pesky tendency to ignore all of the nice and neat imaginary boundaries we have established, between jurisdictions, environmental media, and scholarly disciplines. Understanding and addressing formidable
environmental matters such as climate change will require an integration of knowledge from the environmental sciences, economics, engineering, politics, and more. This dissertation contributes to a piece of this puzzle, establishing a methodology connecting economic analysis of policy with engineering modeling of the physical constraints and tradeoffs inherent in product design and production.
This work will attest to how close I have come to the ideal of a
v
TABLE OF CONTENTS
ACKNOWLEDGEMENTS ... ii
PREFACE ... iv
LIST OF TABLES ... vi
LIST OF FIGURES ... vii
CHAPTER 1: INTRODUCTION ... 1
CHAPTER 2: BACKGROUND ... 4
2.1 Economic Literature... 4
2.2 Engineering literature... 10
2.3 Lifecycle Assessment... 17
CHAPTER 3: MODEL DEVELOPMENT ... 22
3.1 Vehicle Development Process ... 22
3.2 Engineering Design Model ... 24
3.3 Demand Model... 37
3.4 Cost Estimation ... 48
3.5 Appendix A: Modeling combinations of technology features ... 51
3.6 Appendix B: Evaluation of Engineering Model ... 53
CHAPTER 4: EVALUATING FUEL ECONOMY STANDARDS USING AN ENGINEERING MODEL OF ENDOGENOUS PRODUCT DESIGN . 55 4.1 Introduction ... 55
4.2 Overview of CAFE ... 56
4.3 Industry Model ... 59
4.4 Counterfactual Simulations ... 61
4.5 Conclusions ... 69
CHAPTER 5: ANALYZING THE POTENTIAL FOR UNDESIRABLE DESIGN INCENTIVES FROM FOOTPRINT-BASED FUEL ECONOMY STANDARDS ... 71
5.1 Introduction ... 72
5.2 Background on Reformed CAFE ... 73
5.3 Methodology ... 77
5.4 Results and Discussion ... 86
5.5 Summary and Recommendations ... 89
CHAPTER 6: APPLICATIONS TO LIFECYCLE ASSESSMENT ... 92
6.1 Introduction ... 93
6.2 cLCA-MDD Modeling Approach ... 95
6.3 LCA Uncertainties ... 102
6.4 Case Study Part 1: Industrial decision ... 103
6.5 Case Study Part 2: Policy decision ... 110
6.6 Summary and Conclusions ... 112
CHAPTER 7: SUMMARY AND FUTURE OPPORTUNITIES ... 114
vi
LIST OF TABLES
Table 3.1 Ranges and intervals of vehicle simulation parameters ... 29
Table 3.2 Technology costs and effects on fuel economy and 0-60 acceleration time .... 30
Table 3.3 Estimation results for fuel consumption in technology and design model ... 35
Table 3.4 Estimation results for cost of technology and powertrain design ... 35
Table 3.5 Summary of Vehicle Characteristic Data ... 38
Table 3.6 Heterogeneous Demand Parameter Results ... 42
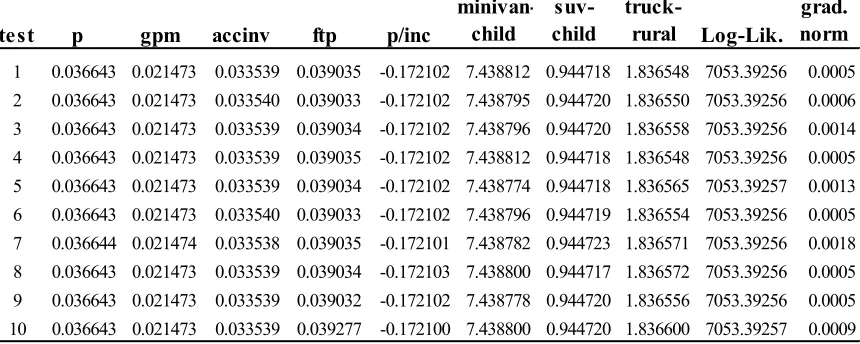
Table 3.7 Initial-value tests of heterogeneous demand parameter estimates ... 43
Table 3.8 Homogeneous demand parameter results ... 44
Table 3.9 First stage instrumental variable results ... 44
Table 3.10 Lagrange multiplier estimates ... 49
Table 3.11 Shadow costs estimates of unreformed CAFE regulation ... 50
Table 3.12 Sensitivity of production costs to estimates of Lagrange multipliers ... 50
Table 4.1 Comparison of observed attributes and baseline simulation ... 63
Table 4.2 Impact of MY2014 CAFE on producer and consumer welfare ... 64
Table 5.1 Ranges of demand parameters in literature and corresponding model coefficients ... 84
vii
LIST OF FIGURES
3.1 Simplified representation of an automotive development process. ... 23
3.2 Iso-cost and iso-technology production possibility frontiers. ... 27
3.3 Screen shot of the AVL Cruise simulation interface ... 28
3.4 Estimated iso-cost production possibility frontiers for selected vehicles ... 36
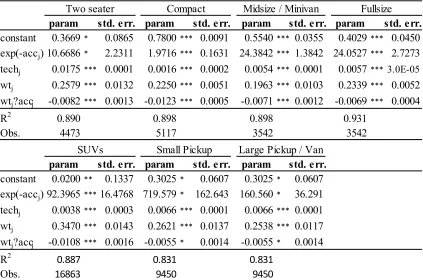
3.5 Comparison of compact-segment model to MY-2006 vehicle data ... 37
3.6 Select vehicles’ technology costs and willingness-to-pay to increase fuel economy 45 3.7 Relationship of ordered technology feature combinations to production cost conditional on 0-60 mph acceleration time ... 51
3.8 Relationship of ordered technology feature combinations to fuel consumption conditional on 0-60 mph acceleration time ... 52
3.9 Comparison of compact vehicle engineering model predictions to observed MY2006 data and MacKenzie (2009) model results ... 53
3.10 Comparison of midsize vehicle engineering model predictions to observed MY2006 data and MacKenzie (2009) model results ... 54
5.1 MY2014 footprint-based fuel economy targets as specified by CAFE ... 75
5.2 Simulation results given midpoint consumer preferences. ... 88
6.1LCI system boundaries using an (A) aLCA approach, and (B) cLCA-MDD approach. ... 97
6.2 GHG emissions dependent on vehicle miles travelled using an aLCI approach. ... 107
6.3 Comparison of lifecycle GHG emissionsresults as a function of fuel price. ... 108
6.4 Changes in lifecycle GHG emissions resulting from the decision to downsize the protagonist vehicle’s engine. ... 109
6.5 GHG emission results evaluated over scenarios of fuel price parameter and VMT model. ... 110
6.6 GHG emission results evaluated over scenarios of fuel price parameter and VMT model. ... 112
1
CHAPTER 1:
INTRODUCTION
“Technology, combined with improved design, can greatly aid the quest for sustainability. Indeed, the notion that technological choice is crucial for environmental improvement lies at the core of industrial ecology” —Marian Chertow (2000)
The design of products is well recognized as a crucial component to achieve sustainable development (Anastas and Zimmerman 2003; Chertow 2000). Indeed, a majority of the environmental impact of a product is predetermined early on in the design stage (Hauschild et al. 1999;Borland and Wallace 2000). Potential opportunities to reduce environmental impacts through design have triggered a number of policy actions aimed at inducing environmentally preferred design changes. The Corporate Average Fuel Economy regulation and appliance standards in the United States and the Energy-Using Products directive in the E.U. aim to induce product design that minimizes energy use (Directive 2005/32/EC). The E.U.’s Waste Electrical and Electronic Equipment directive and Japan’s producer take-back requirements aim to encourage product designs that reduce waste streams from disposal (Directive 2002/96/EC; Ogushi and Kandlikar 2007). And, cap and trade policies implemented in the E.U. and proposed in the U.S. Congress create the incentive for capped firms to modify products to reduce emissions as well as sending a price signal to consumers, which raises demand for products with lower embodied emissions (Directive 2003/87/EC; H.R. 2454).
2
Existing literature in economics and engineering design has developed methods to study these domains but an integration of these methods of the extent necessary to inform policy and industrial decision-making is still needed.
This dissertation presents an approach of integrating state-of-the-art models of consumer demand and engineering design to examine the relationship between
environmental policy and product design. Climate change policies impacting the automotive industry will serve as the specific focus of the research although the
methodology is directly applicable to other product categories. Specifically, the approach presented in this dissertation is appropriate to analyze industries that can be characterized as differentiated-product oligopolies in which policymakers are interested in increasing energy efficiency, and manufacturers make design decisions that affect energy efficiency and other product attributes that influence product demand. These characteristics
encompass many industries that are relevant to policies targeting product design, such as light- and heavy-duty vehicles, household appliances, and certain consumer electronic industries.
A model of the U.S. automotive market is presented, representing consumer purchase decisions and firm design and pricing decisions for the full line of vehicles produced in a year. The methodology integrating engineering design models with economic analyses produces three contributions. First, the combined model allows for policy analysis of the full-scale automotive industry considering design options that may be profit-optimal in the presence of the policy even if the design options are not
observable in current data. Second, the structure of engineering design decisions made throughout the product development process is used to address the difficulty of
econometrically identifying demand parameters for design attributes. Third, cost parameters are estimated using engineering data when available and derived from the econometric demand model when engineering cost estimates are difficult to obtain.
3
is then applied to three separate case studies. In Chapter 4, the combined model is used to evaluate a policy instrument in terms of its ability to incite the design changes targeted by the policy and its impact on firm profits. Chapter 5 uses the developed methodology to examine potential influences of a policy instrument on additional design changes that are not necessarily the target of the policy. Applications of the approach to lifecycle
4
CHAPTER 2:
BACKGROUND
“If I have seen further it is only by standing on the shoulders of giants.” —Isaac Newton
2.1Economic Literature
A mature body of literature in economics focuses on modeling the impact of a change on the Nash equilibrium of a market, which specifies a set of decisions from which no individual firm has a profitable incentive to deviate (e.g., Fundenberg and Tirole 1993; Viscusi et al. 2005). This literature has developed well-known methods to estimate consumer preferences for differentiated products, a category that includes all designed-product industries, such as the automotive, consumer electronic, and appliance industries. While this research predominantly assumes that the designs of products are exogenously determined, increasing attention is being given to the product design decisions that producers make in addition to pricing decisions (e.g., Fan 2008; Sweeting 2007; Klier and Linn 2008; Knittel 2009; Seim 2006).
The standard theory of neoclassical economics for differentiated-product
industries consists of firms maximizing profits with respect to the prices of their products given the prices that their competitors have chosen. The equilibrium of this system, called Bertrand equilibrium, is therefore defined as the prices for all products that
5
Typically, consumer demand is represented in this literature by a discrete choice utility model. In this model the utility, 𝑢𝒏𝒊, or satisfaction consumer n receives from product i,is composed of an observed portion and an unobserved portion of utility: 𝑢𝒏𝒊 = 𝓯(𝑝𝑖,𝒙𝒊,𝒅𝒏,𝜽𝒏) +𝜺𝒏𝒊. The observed portion of utility can generically be specified as a function of price, pi, observed product attributes, xi, consumer demographics, dn, and parameters, θn, which the researcher estimates. The unobserved portion of utility, 𝜺𝒏𝒊, depends on unobserved product attributes and other unobserved data and is commonly assumed to be independently and identically distributed according to the Type 1 Extreme value distribution (e.g., Louviere 2003, Train 2003). This assumption allows the
probability, 𝑃𝒏𝒊, that consumer n will purchase product i out of the set of products 𝕴to be written in closed form:
𝑃𝒏𝒊= 𝒆
𝓯(𝑝𝑖,𝒙𝒊,𝒅𝒏,𝜽𝒏)
∑𝒋∈𝕴𝒆𝓯�𝑝𝑗,𝒙𝒋,𝒅𝒏,𝜽𝒏� 2.1
In much of the applied economics literature that studies differentiated-product industries, the abilities of firms to change product designs is not considered or is largely underemphasized (e.g., Goldberg 1998; Jacobsen 2010; Nevo 2000). The majority of this work is concerned with firm pricing decisions in response to a policy intervention or change in the market, such as a merger, with all product designs considered fixed. This model formulation could be thought of as a representation of the short-run firm response (less than a year for many industries) but over longer time-spans, firms are able to adjust the designs of their products as well as the prices. Increasingly, researchers in the
environmental economics and industrial organization have recognized the importance of accounting for firm decisions regarding product design, but many opportunities exist to advance the methods of modeling these decisions.
2.1.1 Environmental economics literature
In the environmental economics literature, significant interest has been given to studying the ability of policy instruments to induce technological change, but
6
an investment that leads to a reduction in production costs. For example, Jung et al. (1996) analyze policy instruments with respect to the ability to increase the supply of renewable electricity. In this study, firms pay some cost for the pollution they emit and the firm can choose to invest in a technology that reduces their pollution level. Fischer and Newell (2008) analyze the efficiency of policy instruments to encourage renewable energy diffusion, representing technology adoption as functions translating R&D investment and learning-by-doing experience to cost reductions for renewable energy.
These approaches model important mechanisms by which policy instruments influence design decisions but they ignore potential tradeoffs and constraints involved with these decisions. Extending these approaches to account for engineering constraints and tradeoffs associated with implementing specific technologies and design strategies may yield different results regarding the efficiency and effectiveness of environmental policy instruments. For example, higher efficiency dishwashers require longer cycle times (Consumer Reports 2010), which may deter consumers from purchasing them. A policy analysis that does not account for this tradeoff may undervalue the importance of providing additional incentives to consumers to purchase higher efficiency dishwashers. This dissertation presents an approach of explicitly accounting for relevant engineering tradeoffs and constraints in the analysis of policy instruments.
2.1.2 Industrial organization economics literature
As well as contributing to the environmental economics literature, this dissertation is relevant to industrial organization (IO) economics. The IO economics community has a long history of studying the structure of markets and the organization of firms. The decisions firms make regarding product design are an important aspect of firm competition and the structure of many differentiated-product industries. Much of the existing work modeling product design decisions has focused on relatively
7
is just beginning to develop methods to analyze these design decisions (e.g., Gramlich 2008; Klier and Linn 2008; Knittel 2009).
In order to estimate the longer run costs of the Corporate Average Fuel Economy (CAFE) regulation, Austin and Dinan (2005) and Kleit (2004) introduce an oligopolistic equilibrium model of CAFE where product design is not completely fixed, but instead firms adjust the fuel economy of their vehicles by implementing fuel-efficiency technologies. Changes in fuel economy enter the equilibrium model by assuming
consumers treat the net-present value of a vehicle’s lifetime fuel savings as a reduction in the vehicle’s purchase price. All other vehicle attributes are considered exogenous. Unit production costs are modeled as increasing in response to fuel economy improvements according to technology cost curves. The only technologies included in the models are those that are assumed to increase fuel economy while having no effect on other vehicle attributes. The same strategy is incorporated in Jacobsen’s (2010) study of CAFE.
While this approach advanced the state-of-the-art by incorporating technology decisions into an oligopolistic equilibrium using the standard Bertrand model where product prices change but all other aspects of the product are considered exogenous, the assumptions necessary to apply this method are not supported by consumer research. Incorporating decisions on fuel-saving technologies into the Bertrand model requires the assumption that consumers value fuel consumption as the net-present value of future fuel savings. However, Turrentine and Kurani (2007) present interviews of households across consumer-segment groups finding “no household that analyzed their fuel costs in a systematic way in their automobile purchases”. These findings imply that consumers do not trade off net-present future fuel savings equally with purchase price and therefore consumer valuation of fuel economy should be estimated separately from purchase price.
Fischer (2010) develops a theoretical model of the automotive industry in which consumer valuation of fuel economy is not restricted to the net-present value of future fuel savings and is allowed to vary between consumers of different vehicle segments. She finds that an oligopoly of automotive firms over-provide fuel economy in vehicle
8
firms to increase fuel economy as an increase in production costs and assumes all other vehicle attributes are exogenous and unaffected by changes to fuel economy.
This assumption that automakers will respond to fuel economy policies by implementing only design strategies that increase fuel economy and have no effect on other attributes is not justified. Many design options that increase fuel economy—for example, turbocharging, variable valve timing, and hybridization—will either increase or decrease acceleration performance.
Recognizing the importance of studying firm decisions that impact energy efficiency and other product attributes that trade off with efficiency, a few researchers have estimated the engineering tradeoffs between product attributes in the automotive industry. Knittel (2009) econometrically estimates the tradeoffs that automotive
manufacturers face between the fuel economy, weight, and engine power of vehicles sold in the United States over the period of 1980–2006. He documents both movements along and shifts in the production possibility frontier (PPF) of these three vehicle attributes, representing the set of attribute combinations where no attribute can be improved without a loss in another attribute. Klier and Linn (2008) also econometrically model engineering tradeoffs between endogenous vehicle attributes on the supply side, coupling this model with a demand-side estimation to analyze the medium-run response to the CAFE
regulation. The authors exploit an engine data set to estimate tradeoffs between endogenous attributes—including horsepower, fuel economy, and weight—using variation in observed attributes of vehicle models with the same engine program.
A notable challenge of econometrically estimating the engineering tradeoffs between product attributes is that the PPFs for a product are dependent on many product attributes, both observed and unobserved. Accounting for correlation between
9
monitor, satellite radio, and an upgraded stereo system. The addition of these extra features affects fuel economy and typically increases demand, violating the certeris paribus assumption in counterfactuals. Moreover, many vehicle options have variations in design features that are even more difficult to obtain data on than the features listed above. For example, the coefficient of friction of engine components such as piston rings, material coatings, and lubricants impacts fuel economy, acceleration performance, and production costs but this information is rarely reported by manufacturers or available in even such detailed vehicle data sets as WARDs Automotive.
This dissertation contributes to this challenge by integrating an engineering model of product design to identify the tradeoffs between product attributes. Physics-based engineering simulations are used to construct the PPFs between fuel efficiency,
acceleration performance, and production costs. This engineering-based approach confers two advantages. First, engineering tradeoffs between fuel economy and other product attributes can be identified without conflating changes in unobserved attributes that typically affect both fuel efficiency and consumer demand. Second, the engineering model can capture many combinations of product attributes that are not observed in the market to date, but are technologically feasible. This is important because these
unobserved vehicle designs may be optimal under relevant policy regimes. In fact, manufacturers have stated that they will rely on further implementing advanced technologies in order to meet fuel economy standards in the future (Amend 2010).
10
In previous work, some researchers have used functions of non-price attributes of vehicles as instruments (e.g., Berry et al. 1995; Train and Winston 2007, Beresteanu and Li 2008, Petrin 2002). This choice of instruments is subject to the criticism that firms presumably choose these non-price attributes and prices simultaneously, and therefore the instruments are not independent of unobserved utility. This dissertation contributes to this research by using the well-documented structure of the automotive design process to identify vehicle attributes that are determined in earlier stages than the endogenous attributes of interest. The key identifying assumption is that powertrain architecture (e.g., hybrid), drive type (e.g., all-wheel-drive), and major vehicle dimensions are chosen earlier in the development process than detailed design variables in the powertrain that affect both fuel economy and acceleration performance. This assumption is supported by detailed descriptions of the automotive development process (Braess and Seiffert 2005; Sörenson 2006; Weber 2009).
2.2Engineering literature
2.2.1 Decision-based Design literature
The engineering design literature has a long history of modeling the engineering tradeoffs and constraints inherent in product design and their relation to the objectives of a firm. While the discipline of engineering design originally was viewed as a problem-solving process aimed at minimizing costs subject to constraints of functional
requirements, it has developed into a systems analysis of a decision-making process that aims to maximize the value of a designed product to a firm considering costs and
consumer demand for design alternatives (Hazelrigg 1998; Lewis et al. 2006; Wassenaar and Chen 2003). This line of research provides a valuable foundation for integrating representations of consumer demand together with models of engineering tradeoffs and constraints necessary to understand the relationships between policy and product design decisions.
11
performance to design attributes but also customer decision models that appropriately link design attributes to product demand. The DBD literature has integrated such representations of customer decisions, especially applied to automotive design, by borrowing and adapting existing demand models from the social sciences (e.g., Besharati et al. 2006; Frischknecht and Papalambros 2008; Michalek et al. 2004; Shiau and
Michalek 2009), estimating new versions (e.g., Kumar et al. 2007; Kumar et al. 2009; Shiau and Michalek 2009; Wassenaar et al. 2005), and exploring scenarios of uncertain demand (Besharati et al. 2006; Moon et al. 2010; Suh et al. 2007). Reviews of methods in this literature are available in Donndelinger et al. (2008), Frischknecht (2009), and
Michalek (2005).
This literature has been formative to DBD research by coupling consumer utility models with design optimization but representations of both consumer demand and the economic structure of the industry are often simplified such that the analyses do not suitably represent the industries they aim to study. With respect to demand
representations, this literature largely does not address the correlation between observed product attributes and unobserved product attributes, as described in Section 2.1. Without accounting for this issue, it is likely that the estimates of consumer utility parameters are biased.
For example, Kumar et al. (2007) estimate consumer utility coefficients for various vehicle product attributes, including price, interior dimensions, power, fuel economy, and interactions with these attributes and consumer demographics. The estimated coefficient on price of this model is positive, indicating that consumers prefer vehicles with higher prices. The authors identify that this unexpected sign is likely due to a correlation of price with premium attributes of vehicles, which are often difficult data to obtain, but do not attempt to correct the contamination of this parameter. As a result, this demand estimation is not appropriate for design studies or other counterfactual
simulations because the relationship between consumer utility and price changes
independent of other product attributes has not been identified. While this is an extreme example, where the sign of the estimated price coefficient is positive, similar
contamination of demand parameters are likely to exist in many demand models
12
2006; Wassenaar and Chen 2003; Wassenaar et al. 2005). Properly designed stated-choice surveys (e.g., Luo et al. 2005; Orsborn et al. 2009; Reid et al. 2010) can avoid this issue but this approach relies on the assumption that consumer survey results represent actual purchasing behavior, which has been shown to not necessarily be the case (see for example, Kagal and Roth 1995; Slovic 1995).
With respect to representations of the economic structure of the industry, the DBD literature often uses simplified models where competitor decisions are not
considered or only a subset of products in the industry are modeled. Li and Azarm (2000) and Jiao and Zhang (2005) represent a single firm’s design decisions accounting for competing products but all competitor decisions are considered fixed. Williams et al. (2008) similarly consider all competitor decisions as fixed, but do account for the decisions of retailers that buy products from the manufacturer and sell them to the end consumer. Lewis and Mistree (1998) use economic approaches of equilibrium to model competing and cooperative decisions between engineering designers within the same firm but do not account for any strategic decision-making between firms.
A subset of DBD research has recognized the influence of economic structure of an industry, including relevant government regulations, on firms' optimal design
decisions. Georgiopoulos et al. (2002) model the optimal product mix of a hypothetical automotive firm producing a passenger car and a light truck subject to the constraint of U.S. fuel economy standards, demonstrating the influence the regulation has on optimal design decisions. Kwak et al. (2007) develops a method to optimize the disassembly sequence of products to conform to the constraints of take-back requirements prevalent in Europe and Japan. And, Shiau and Michalek (2009) demonstrate that the economic structure of the market, namely whether manufacturers control prices directly or through a franchised or common retailer, affects optimal design decisions.
13
objectives are aligned (or opposed) depends on the technology considered, the extent of competition in the market, consumer preferences, and the regulatory environment.
Perhaps the most closely related research in the DBD literature to the
contributions of this dissertation is presented in Michalek et al. (2004) and Shiau et al. (2009). In both studies, the authors investigate optimal vehicle powertrain designs and pricing decisions in response to specific policy measures and evaluate the policies with respect to the design responses. Michalek et al. (2004) determines the equilibrium of a hypothetical industry in which firms each produce a midsize vehicle model under multiple policy scenarios—including a minimum production constraint for diesel
vehicles, a fine proportional to carbon dioxide emissions from produced vehicles, and an increase in the penalty for violating the fuel economy standard. Using the same
hypothetical industry example, Shiau et al. (2009) evaluates the ability of U.S. fuel economy standards to induce design changes. The authors illustrate that if fuel economy standards are increased but the fines associated with violating the standards are not increased, then firms may have no incentive to improve the fuel economy of their vehicles. The results of these studies indicate that policy outcomes (e.g., realized reductions in CO2 emissions) depend substantially on how they are linked to design
decisions.
14
Georgiopoulos et al. 2002; Kumar et al. 2009; Michalek et al. 2004; Shiau and Michalek 2009; Wassenaar et al. 2005). Solutions to the firm optimization problem depend on both the types of products represented in the system and the extent to which product
heterogeneity is captured. Consequently, the full-scale model should more closely represent the automotive industry.
2.2.2 Automotive engineering literature
In addition to contributing to the DBD engineering literature, this dissertation is relevant to a subset of engineering literature that focuses on the potential to improve vehicle fuel efficiency by implementing various technologies and, less frequently, compromising other aspects of vehicle performance. This literature can roughly be divided into two categories. The first category examines the potential for fuel efficiency improvements based on known technology advances (e.g., DeCicco et al. 2001; NHTSA 2008). The second category aims to predict future improvements in fuel efficiency by extrapolating historical trends (e.g., An and DeCicco 2007; Cheah et al. 2008;
MacKenzie 2009).
The common approach used in this first category is defining discrete packages of technology options and determining the impact of these technology packages on fuel efficiency using engineering vehicle simulations. For example, DeCicco et al. (2001) determine the maximum feasible increases in fuel efficiency from 2010–2015 considering a number of technology packages, including low tire rolling resistance, increased
aerodynamic efficiency, low-friction engines, lightweighting, and gasoline direct-injection engines. The authors find that average new-vehicle fuel economy can be
increased to 36 mpg. Assuming that the costs of implementing these technology packages translates into vehicle prices by assuming markups are 1.8 times the manufacturing costs, results indicate that this improvement of fuel economy causes an increase of average vehicle prices by $1,300.
15
These results indicate that the maximum feasible increase in average new-vehicle fuel economy is 39.9 mpg for passenger cars and 31.3 mpg for light trucks, and the increase that equates costs and benefits is 38.8 mpg for passenger cars and 30.5 for light trucks. Using a markup factor of 1.5 times manufacturing costs, these results imply an increase in average new-vehicle prices of $3,264 and $2,785 for passenger cars and light trucks, respectively, to achieve the maximum feasible increase and $2,367 and $2,509,
respectively, to achieve the equal costs and benefits increase.
This dissertation takes a similar approach of determining the impact of specific technologies on fuel efficiency and acceleration performance using engineering vehicle simulations. However, the methods presented in this dissertation do not aim to determine the maximum feasible improvement in fuel efficiency but rather the change in fuel efficiency and other vehicle attributes in response to policy instruments considering consumer preferences for vehicles and profit objectives of manufacturers. Furthermore, this research does not rely on the condition that vehicle production costs translate into vehicle prices through assumptions on markups; instead, manufacturers are modeled as setting prices as well as choices on technology options and vehicle attributes in order to maximize their profits.
A separate body of literature examines the impact of technology change on fuel efficiency and other aspects of vehicle performance by examining historical trends in the automotive industry instead of determining the impact of specific technology options. For example, An and DeCicco (2007) propose an indicator of technology change in the automotive industry, noting that the product of the sales-weighted average of vehicle size, specific power, and fuel economy—specifically, the ratio of horsepower to weight
multiplied by interior volume and fuel economy—increased linearly over the period of 1977–2003. Using this indicator, called the Performance-Size-Fuel Economy Index (PSFI), the authors infer periods when technology gains were applied to improvements of fuel efficiency, improvements of size or acceleration performance, or some combination. Cheah et al. (2008) and MacKenzie (2009) use the same indicator to examine the
16
Cheah et al. (2008) define a measure of the allocation of technology gains
towards fuel efficiency based on the PSFI indicator, called the Emphasis on Reduction of Fuel Consumption (ERFC). This measure represents the ratio between the realized fuel consumption reduction over a specified period and the potential fuel consumption reduction holding vehicle size and specific power constant, which is calculated based on sales-weighted average trends of the PSFI. The authors determine that between 1995 and 2006 the ERFC was 8% in the United States, 54% in Germany, and 83% in Italy.
Additionally, the authors calculate that fuel consumption could be reduced 26% by 2035 if all technology gains were applied to fuel efficiency, and could be reduced 33% by also compromising acceleration performance such that the sales-weighted average time to accelerate from 0–60 mph increased by 5 s.
Similar to Cheah et al. (2008), MacKenzie (2009) uses the ERFC to determine the potential to increase fuel efficiency in the future but also couples the technology indicator with the willingness of consumers to pay for fuel efficiency and acceleration
performance. Using the ERFC to represent the decision to implement technology and tradeoff fuel efficiency with acceleration performance, he models the impact of an increase in gasoline prices and the impact of CAFE standards on the sales-weighted average fuel economy and acceleration performance. This approach models the automotive industry as effectively a single decision-maker who adjusts the ERFC in response to these system changes. The automotive industry is assumed to make decisions on ERFC to maximize the value of the sales-weighted average vehicle attributes to consumers. Results of this approach indicate that a CAFE standard of 39 mpg on passenger cars in 2020 imposes a cost of $200 per car in terms of consumer value compared to a 2005 baseline.
17
demand model that considers not only preferences for fuel efficiency and acceleration performance, but also vehicle price, size, segment, and additional vehicle attributes such as brand and luxury accessories. This approach enables modeling the design and pricing decisions of each automotive manufacturer in competition with each other with respect to the prices and attributes of their individual vehicles.
2.3Lifecycle Assessment
Lifecycle assessment (LCA) is a method of conducting an inventory of the materials, energy, wastes, and emissions flows through the lifecycle of a product, process, or system and assessing the impact of these flows on the environment (SETAC 1993; ISO 1997). An LCA analysis consists of defining the boundaries of the relevant system; gathering data on environmental flows within the system, modeling system processes to calculate approximate input and output flows when data aren’t available; evaluating the potential environmental impacts associated with the inventory data; and interpreting the results to inform decision-making. Over the past decade, practitioners in industry, academia, and government have used LCA as a means of understanding
environmental impacts across lifecycle stages of products and environmental media (e.g., water, air) (Schmidt 2000). One common application of LCA is informing consumer choice among product alternatives to fulfill a particular need.
18
environmental outcomes, are governed by the economic structure of the industry, consumer demand, and engineering constraints and tradeoffs.
Some recent LCA analyses include consideration of certain economic factors such as demand elasticities (e.g., Ekvall and Andræ 2006; Sandén and Karlström 2007;
Schmidt and Weidema 2008) but these studies are limited by considerably simplified assumptions. Most notably, they focus only on commodity products, which are uniform across all producers, and predominantly consider only the decision of whether to increase production of the product. Furthermore, economic parameters such as demand elasticities used in these studies are usually estimates adopted from existing literature without a substantive discussion on the assumptions associated with the estimation and in some cases (e.g., Ekvall and Andræ 2006), these parameters are derived purely from conjecture without a strong basis in econometrics. Development of these methods so that they are appropriate for informing policymaking will require an integration of state-of-the-art econometric approaches and increased transparency of any assumptions associated with parameter estimates. This dissertation contributes to these developments.
19
greenhouse gas emissions using the developed model and Chapter 6 provides the blueprint for connecting the model or similar models to lifecycle inventory data.
The industrial ecology and LCA literature has distinguished two types of LCA methodologies: attributional LCA (aLCA), which describes the environmentally relevant flows to and from a lifecycle, and consequential LCA (cLCA), which describes how these flows may change in response to possible decisions (e.g., Finnvedan et al. 2009; Curran et al. 2005; Ekvall and Weidema 2004). cLCA extends the boundaries of an aLCA to include not only the flows of the product lifecycle of interest but also any flows of other products that are significantly affected. The system expansion approach of cLCA presents the structure necessary to study a number of indirect “ripple effects”, which have been identified as an important area of research in industrial ecology (Hertwich 2005). Ripple effects that are most commonly included in cLCA studies to date are the impact of increasing production of a product on the displacement of competing products.
Researchers in this literature have begun to implement cLCAs to study systems of commodities. For example, Schmidt and Weidema (2008) present a cLCA of the decision to increase vegetable oil production. The authors identify palm oil as the marginal source of vegetable oil and determine the products that are displaced from palm oil production— specifically that barley and soy meal are displaced by palm kernel meal, which is a co-product of palm oil. The increase in environmental flows resulting from the increase in palm oil production is compared to the decrease in environmental flows from displaced production of barley and soy meal. Using similar methods, Thomassen et al. (2008) studies the effects of an increase in milk production considering the secondary impacts of increased production of dairy-cow meat, which displaces beef-cow meat and pork
products, and the increased production of the soy feedstock, which co-produces soybean oil that displaces palm oil. Schmidt (2008) conducts a cLCA of increased demand of wheat in Denmark, exploring various scenarios of increasing supply: increasing yield, land use, displacing other crops, increasing imports, or some combination.
20
include effects on the production of substitutes, demand for related products, technology costs, and changing preferences. The authors illustrate how ripple effects concerning technology adoption could be incorporated into cLCA, accounting for the effect of investing in a new technology—namely fuel cell buses—on the future cost of the
technology and, consequently, the future demand for the technology. However, this study relies on very simplified assumptions of product demand, namely that once the marginal production cost of fuel cell buses reaches the cost of diesel buses, only fuel cell buses will be used.
Studies such as these have linked LCA with representations of supply and demand characterizing commodity industries, but further advancement of cLCA methods are needed to appropriately analyze differentiated products, such as light- and heavy-duty vehicles. Analyzing designed products requires extending the current cLCA approach to closely interact with models of consumer preferences for differentiated products and engineering models of product design, which are inherently coupled in differentiated-product systems. In the case of differentiated-differentiated-product markets, such as automobiles and consumer electronics, demand depends on the product attributes and prices of all products that a consumer may consider purchasing. In these cases, the extent to which one particular product displaces competing products is often not known a priori and needs to be estimated for the particular study. Moreover, a change in the system—for example, a new policy intervention or a change in a competitor’s product—is likely to induce firms to adjust the prices and designs of their products, which can significantly affect upstream and downstream environmental flows from the system. Both the
economic structure of the market and the design tradeoffs inherent in production are key determinants of these price and design responses and resulting environmental impacts. Understanding the cause-effect chains in such a system requires bridging methods from economics and engineering design together with lifecycle assessment.
21
22
CHAPTER 3:
MODEL DEVELOPMENT
"Design almost invariably involves compromise. Sometimes stated objectives may be in direct conflict with each other, as when motorists demand both good acceleration and low petrol consumption. Rarely can the designer simply optimize one
requirement without suffering some losses elsewhere.” —Bryan Lawson (1997)
“Getting to the heart of the reasons people purchase and use different products and services can open up new opportunities for resolving the environmental problems associated with them.” —Ralph Horne, Tim Grant, and Karli Verghese (2009)
This chapter describes an empirically tractable approach to integrate engineering design models with economic analyses of industrial policies. The analysis begins by highlighting some relevant features of the automotive design process to both the engineering-design and demand-side models. Then, construction of the engineering design model is described, which represents the ability of firms to trade off fuel
efficiency, acceleration performance, and production costs. Next, the development of the demand model is described. Finally, the demand model is used to estimate production costs that are not captured in the engineering design model.
3.1Vehicle Development Process
The design response of an automotive manufacturer to government policies depends substantially on the structure of the vehicle development process. This process is a structured sequence of interrelated decisions, many of which constrain choices made at later stages (Sörensen 2006). The typical design process begins with concept
development, followed by a system-level design that defines the geometric layout of the vehicle (including target vehicle dimensions), followed by detailed design of all
subsystems (Sörenson 2006; Weber 2009).
23
hybrid), variations (e.g., four-door sedan), major dimensions, transmission types (e.g., automatic, torque classes) and engine versions (Braess and Seiffert 2005; Weber 2009). For a redesigned model, the development process begins with the determination of any changes to major properties of the vehicle and specifications for subsystems, such as how many drivetrain configurations or engine options will be available. In both new design and redesign contexts, there are certain earlier design decisions that must be finalized before the detailed engineering design of vehicle subsystems can begin (Braess and Seiffert 2005; Sörenson 2006; Weber 2009).
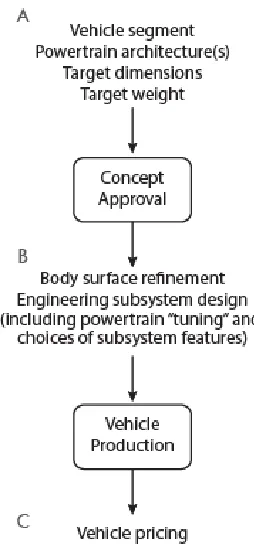
[image:31.612.258.385.391.665.2]Figure 3.1 provides a stylized representation of this development process. This figure is somewhat misleading insofar as it suggests that the design process proceeds in sequential, clearly defined stages. In fact, iteration loops and overlapping tasks often exist between the stages presented. This caveat notwithstanding, it is possible to identify a stage in current automotive development processes where vehicle segment, powertrain architecture (e.g., conventional gasoline, hybrid, diesel), and major dimensions are finalized but “tuning” of powertrain variables is still possible.
Figure 3.1 Simplified representation of an automotive development process.
24
The structure of the automotive development process informs the demand- and supply-side models in two important ways. On the demand side, we use the variation in vehicle attributes determined in earlier stages of the design process (i.e., Stage A in Figure 3.1) to instrument for endogenous variables in our demand-side estimation, which are determined later in the design process (Stage B). On the supply side, we take as given the vehicle segment, powertrain architecture, and other vehicle dimensions that are determined in the earlier stages of the design process (Stage A). Conditional on these features and attributes, we model manufacturers’ choice of fuel economy and acceleration performance (Stage B) and vehicle pricing strategies (Stage C). Ideally, the supply side would be modeled as a two-stage game to represent the sequence of choosing product attributes before prices (or prices with smaller adjustments of product attributes). However, given the scale of the model, solving the second-stage using traditional Newton-based methods is computationally infeasible and faster methods such as fixed-point calculations that account for the CAFE constraint have not yet been developed (Morrow 2008).
3.2 Engineering Design Model
Credible modeling of endogenous attribute selection in the design of technical products such as automobiles requires accurate representation of engineering and economic tradeoffs. We cannot directly observe all of the tradeoffs that firms make during different stages of the vehicle design process. We can, however, generate detailed engineering models of the tradeoffs that play an important role in determining vehicle fuel efficiency in medium-run design decisions.
25
by estimating a “surrogate model” using a flexible parametric regression on data generated from detailed vehicle simulations.1
3.2.1 Medium-run design decisions affecting fuel efficiency
Our analysis of firms’ response to the CAFE regulations focuses on medium-run vehicle design decisions and short-run vehicle pricing decisions (Stage B and C in Figure 3.1). At this point in the vehicle development process, many major parameters of the vehicle have been determined including the segment of vehicle, key internal and external dimensions, and the powertrain architecture (e.g., conventional gasoline, hybrid, and diesel). The automotive manufacturer can still adjust fuel efficiency and acceleration performance at this point in the design process by “tuning” a number of variables in the powertrain (e.g., engine displacement and the final drive ratio) and including technology features (e.g., a high efficiency alternator). For example, consider a given vehicle design such as the Honda Accord. If Honda wants to increase the fuel efficiency of the Accord, it could decrease the displacement size of the engine, or it could simply change the programming in the powertrain electronic control unit to favor fuel efficiency over
acceleration performance. Each of these adjustments to improve fuel efficiency will cause some loss in acceleration performance.
Another means of improving fuel efficiency at this stage in the design process involves incorporating various extra “technology features” to the vehicle design. Examples include high efficiency alternators, low resistance tires, and improved aerodynamic drag of the vehicle body (NHTSA 2008). Adding one or more of these features increases the cost of vehicle production. Depending on the specific technology features chosen, acceleration performance may increase, decrease, or remain the same. For example, cylinder deactivation of the engine can improve fuel efficiency by
effectively decreasing the size of the engine but, because it only is active during coasting, it will not affect acceleration. Reducing aerodynamic drag of the vehicle body can
improve both fuel efficiency and acceleration performance, whereas early shifting logic can improve fuel efficiency but will reduce acceleration performance. These technology
26
features only affect demand through their influence on fuel efficiency and acceleration performance; they do not have intrinsic value to the consumer.
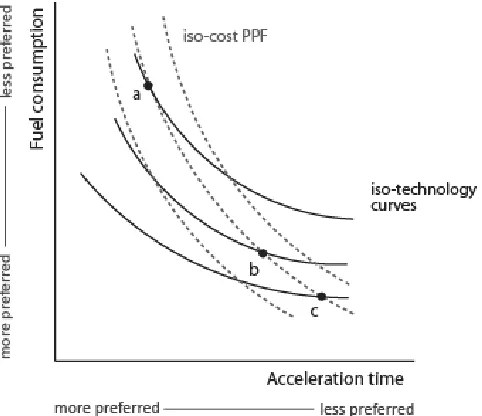
Although our goal is to identify the continuous iso-cost PPFs that define the relationship between fuel economy, acceleration performance, and production costs dependent on these medium-run design decisions, vehicle simulations and automotive data suggest that these PPFs are not in fact continuous. To illustrate this, again consider a given vehicle design such as the Honda Accord. The Accord could be described by its position on the two dimensional fuel-efficiency vs. acceleration-performance space. Honda can decrease the fuel consumption of the Accord without adding any additional technology features by trading off acceleration performance, which could be represented by the Accord moving along an “iso-technology curve” as in Figure 3.2. Considering that Honda could move along this curve in large increments by replacing the engine, smaller increments by decreasing the displacement size of the existing engine, or fine increments by adjusting the electronic control unit, approximating these possibilities as continuous is reasonable. However, incorporating technology features into the vehicle to increase fuel efficiency often causes discrete shifts in vehicle attributes. These discrete shifts of the iso-technology curves in the fuel-efficiency vs. acceleration-performance space cause discontinuities in the iso-cost PPFs as illustrated in Figure 3.2.
Ideally, we may like to model the discontinuities in the iso-cost PPFs caused by discrete technology options. However, because of the large number of discrete
combinations of technology features, further described in Section 3.4, this is
computationally infeasible. We address this challenge by approximating the effect of the technology features as a continuous variable. To do this, we first construct the iso-technology curves for each combination of iso-technology features, and then order the technology-feature combinations by the position of their corresponding iso-technology curves. Finally, we approximate the technology features as continuous in the
27
Figure 3.2 Iso-cost and iso-technology production possibility frontiers.
Iso-cost PPFs are discontinuous (a to b to c) due to the discrete effect technology features have on possible attribute combinations
3.2.2 Vehicle simulations
We use detailed engineering simulations to construct the “baseline”
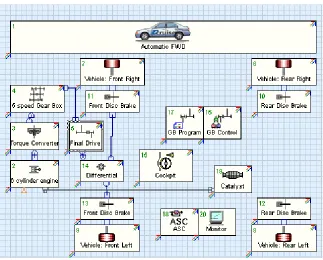
iso-technology curves. This represents the engineering tradeoffs between fuel consumption and 0-60 mph acceleration time for a vehicle with no extra technology features. To determine the baseline iso-technology curves, we use the vehicle simulations software AVL Cruise to characterize the engineering tradeoffs between fuel efficiency and 0-60 mph acceleration time for each vehicle class, then construct a surrogate model of these tradeoffs. AVL Powertrain Engineering, Inc. (AVL) is an independent company, founded in 1948 and headquartered in Austria, specializing in the development of powertrain systems, simulation methods, and engine instrumentation and test systems. The vehicle simulation software Cruise, developed by AVL, is commonly used by automotive original equipment manufacturers to aid in powertrain development (Mayer 2008).
28
Converter, Gear Box, Final Drive, and Differential modules. The Combustion Engine module calculates the fuel consumption, speed, and torque of the engine based on user inputs, such as fuel consumption maps, and input information from other vehicle subsystems, including the load on the acceleration pedal from the Cockpit (driver) module and the external temperature from the Vehicle module. It then transmits information about the torque and speed to the transmission modules.
The modular structure of Cruise allows researchers to simulate multiple vehicle architectures by customizing the subsystem modules (e.g., front or rear wheel drive, automatic or manual transmissions), and modifying various input parameters. For
[image:36.612.164.487.304.564.2]example, with the Vehicle module, a user can adjust the aerodynamic drag coefficient of the vehicle body and the curb weight of the vehicle.
Figure 3.3Screen shot of the AVL Cruise simulation interface
Using Cruise, a total of 29,575 vehicle simulations were conducted. Design input parameters were varied at small intervals so that we can observe the influence of each of these parameters and their interactions on attributes of interest (i.e. acceleration
29
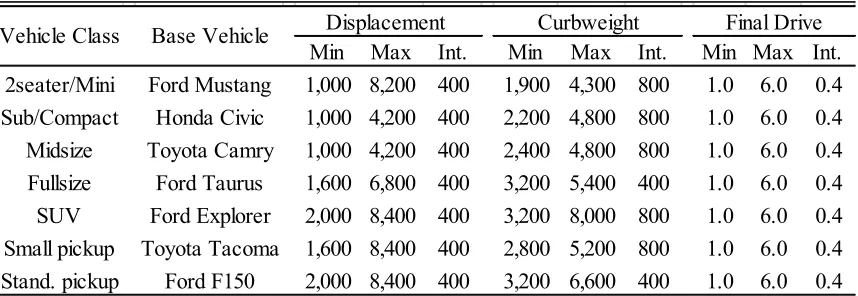
test procedures. Acceleration performance is determined by simulating a shifting program of the vehicle from standstill to 60 mph. Table 3.1 summarizes the range of parameter values we consider in our analysis. These include the powertrain variables that can be changed in the medium run (i.e., engine displacement and final drive ratio) as well as longer run design attributes that are continuous (i.e., curb weight), which are used to more accurately construct the PPFs for a specific vehicle conditional on these longer run design attributes.
[image:37.612.113.542.389.537.2]All other input parameters into the AVL Cruise simulations were determined from a representative base vehicle for each class.2
Table 3.1 Ranges and intervals of vehicle simulation parameters
Many of these parameters (e.g., front-wheel drive) are determined prior to the medium-run decisions we are interested in, but for some parameters (e.g., transmission gear ratios), it is possible that they could be modified in the same time period. In these cases, omitting these potential design options will only make our estimates of the costs of CAFE more conservative, representing an upper bound, because we are not accounting for design options that may be cost-effective.
Notes: This table lists the min, max, and interval of input parameters used in the “AVL Cruise” vehicle simulations. Engine Displacement is in cm3, Curbweight is in lb, and Final Drive is the final drive gear ratio. All other input parameters for the simulations (e.g., front-wheel drive) were taken using data for the “base vehicle”.
Our next step is to determine how the addition of one or more technology features affects the position of the iso-technology curve relative to the baseline. To accomplish this, we combine the AVL Cruise simulations and data from NHTSA (2008). We consider only a subset of the types of technology features identified by NHTSA in our
2 The classes are based on EPA segment classifications, with some grouping of segments based on
similar ranges of input design variables and similar predicted outputs from AVL Cruise.
Min Max Int. Min Max Int. Min Max Int. 2seater/Mini Ford Mustang 1,000 8,200 400 1,900 4,300 800 1.0 6.0 0.4 Sub/Compact Honda Civic 1,000 4,200 400 2,200 4,800 800 1.0 6.0 0.4 Midsize Toyota Camry 1,000 4,200 400 2,400 4,800 800 1.0 6.0 0.4 Fullsize Ford Taurus 1,600 6,800 400 3,200 5,400 400 1.0 6.0 0.4 SUV Ford Explorer 2,000 8,400 400 3,200 8,000 800 1.0 6.0 0.4 Small pickup Toyota Tacoma 1,600 8,400 400 2,800 5,200 800 1.0 6.0 0.4 Stand. pickup Ford F150 2,000 8,400 400 3,200 6,600 400 1.0 6.0 0.4
30
[image:38.612.107.541.225.504.2]analysis. The majority of technology features we omit from our analysis are only available in longer run planning stages, but some features are eliminated because of the challenges in simulating their effects (e.g., variable valve timing). Consistent with NHTSA, we omit the ability to lightweight vehicles by substituting vehicle components with lighter materials.3
Table 3.2 Technology costs and effects on fuel economy and 0-60 acceleration time Similar to excluding some design options, omitting these technology features will only make our estimated costs of CAFE more conservative.
Notes: cost represents the unit production cost in $/vehicle produced, % mpg is the percentage increase in combined highway-city fuel economy, and % acc is the percentage reduction in 0-60 mph acceleration time in seconds. Cost and fuel economy figures are taken from NHTSA (2008). The change in acceleration is calculated in the engineering vehicle simulation model, AVL Cruise.
NHTSA (2008) estimated the effect of each technology feature listed in Table 3.2 on fuel economy, in terms of the percentage improvement, based on values reported by automotive manufacturers, suppliers, and consultants. We use these estimates to
determine how the baseline iso-technology curve changes with the addition of one or more technology features. To do this we also need to know the impact of each technology
3 NHTSA does not consider lightweighting in order to evaluate the ability of manufacturers to meet CAFE standards without reducing the weight of vehicles because of concerns that this will increase traffic safety risks. Chapter 5 discusses this concern in more detail.
Technology cost %mpg %acc cost %mpg %acc cost %mpg %acc cost %mpg %acc Low friction lubricants 3 0.5 0.3 3 0.5 4.1 3 0.5 0.6 3 0.5 0.6 Engine friction reduction 126 1 0.3 84 1 5.6 126 1 1.5 126 1 1.2 Aggressive shift logic 38 1 -0.2 38 1 -5.0 38 1 -0.2 38 1 -0.3 Early torque converter lockup 30 0.5 - 30 0.5 - 30 0.5 - 30 0.5 -High efficiency alternator 145 1 0.3 145 1 5.6 145 1 1.5 145 1 1.2 Aerodynamic drag reduction 38 3 0.3 38 3 5.1 38 3 0.5 38 3 0.3
Low rolling resistance tires 6 1 0.1 6 1 2.5 6 1 0.2 6 1 0.1
Cylinder deactivation n/a n/a 203 4.5 - 203 4.5
-Technology cost %mpg %acc cost %mpg %acc cost %mpg %acc Low friction lubricants 3 0.5 1.6 3 0.5 0.4 3 0.5 0.7 Engine friction reduction 126 1 3.1 126 1 0.7 168 1 1.5 Aggressive shift logic 38 1 0.0 38 1 -0.2 38 1 -2.8 Early torque converter lockup 30 0.5 - 30 0.5 - 30 0.5 -High efficiency alternator 145 1 3.1 145 1 0.7 145 1 1.5 Aerodynamic drag reduction 38 3 1.4 38 2 0.5 38 2 0.4 Low rolling resistance tires 6 1 0.5 6 1 0.2 0 1 0.1 Cylinder deactivation 203 4.5 - 203 4.5 - 229 4.5
-SUV Sm Pickup
Two Seater
Lrg Pickup / Van
31
feature on 0-60 acceleration time, which is not reported by NHTSA. We determine these impacts by simulating each technology feature in AVL Cruise to a level that matches the improvement in fuel economy reported by NHTSA. For example, NHTSA reports a 0.5% improvement in fuel economy from using “low friction lubricants” in compact vehicles. We simulate this impact by reducing the friction losses in the engine of our representative compact vehicle model until we observe fuel economy improving by 0.5% and then observe the percentage improvement of 0-60 acceleration time. When NHTSA provided a range of fuel economy improvement for a technology feature, the lower bound of this range is used, consistent with our other assumptions in creating a conservative
engineering design model. The results of these simulations are reported in Table 3.2.
3.2.3 Costs of medium-run design decisions
In addition to representing the impact of medium-run design decisions on vehicle attribute performance, we also need to account for the effect of these decisions on
production costs. We use two separate sources of data to estimate these costs, one describing costs dependent on the powertrain variables, which we use to determine costs along the baseline iso-technology curve, and another data set detailing production costs for each technology feature. The production costs of the baseline iso-technology curve— representing the costs dependent on choices of engine size and final drive ratio without any extra technology features—is taken from Michalek et al. (2004). The authors collected cost data from manufacturing, wholesale, and rebuilt engines of varying
displacements. The additional production costs resulting from each technology feature is taken from NHTSA (2008), which are shown in Table 3.2. These cost data were
estimated by NHTSA based on reported values from automotive manufacturers,
suppliers, and consultants, and are currently used to perform cost-benefit analyses of the CAFE regulations.
We treat the costs of technology features and the costs of adjusting powertrain variables as additively separable. Engines are manufactured separately from other
32
with only two exceptions. Two technology features—engine friction reduction and cylinder deactivation—do affect the engine subsystem. Even in these cases, it is reasonable to approximate technology costs as additively separable from the baseline production cost of the engine. For example, engine friction can be reduced by using lubricants, the costs of which are independent of all medium-run decisions considered.4
3.2.4 Model of engineering tradeoffs and costs
Ideally, all of the detailed information about design tradeoffs that are captured by the AVL Cruise model would be incorporated directly into our model of supply-side design and pricing decisions. However, because of the computational time required to execute the vehicle simulations, and the large number of discrete combinations of technology features, this is computationally infeasible. Instead, we approximate these relationships with a surrogate model using a flexible parametric form.
Taking all possible combinations of technology features gives automotive firms, depending on the vehicle segment, 128–256 options to choose from for each vehicle. From this set, we consider only those combinations of features that are cost effective— meaning that there is no lower cost combination that could achieve the same or better level of acceleration performance and fuel efficiency. Although this reduces the set of technology feature combinations to between 20 and76, depending on the vehicle
segment, it is still computationally infeasible to model this number of choices per vehicle for each manufacturer in our counterfactual simulations, so further simplifications are necessary.
We approximate the discrete choices of technology features as a continuous variable, tech, ranging from zero (the baseline case) to the maximum number of cost-effective combinations of technology features for each vehicle class. Note that a
particular value for tech maps to a specific combination of technology features (e.g., low resistance tires and a high efficiency alternator) and does not represent the number of
4 The case of cylinder deactivation poses a larger challenge for treating technology costs as additively separable from engine costs. Given large changes in engine displacement achieved by switching the engine architecture (e.g., replacing a V-8 engine with a V-6) would slightly reduce the costs of cylinder
33
technology features. The set of cost-effective technology feature combinations is ordered by increasing fuel efficiency (decreasing fuel consumption) for the same acceleration performance, which is also increasing in cost. Therefore, a higher value of tech
corresponds to a higher fuel efficiency and higher cost vehicle conditional on 0-60 acceleration time. The impact of the continuous approximation on the results is relatively small with the average gap between discrete features less than 1 mpg. Furthermore, we provide some evidence in Section 3.5 that the particular specification we use to estimate the relationships of the continuous tech variable to fuel consumption and cost preserves important properties of the discrete technology combinations.
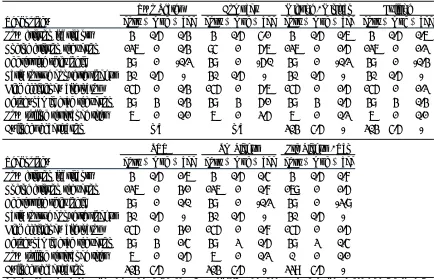
We use the results of the engineering simulations together with data on the technology features and technology costs to estimate Equations 3.1 and 3.2, which together define the PPFs between vehicle fuel consumption, acceleration performance, and the portion of production costs dependent on design decisions, 𝑤𝑗. Several
specifications for each equation were tested; the equations below performed the best under the Akaike Information Criterion.
𝑒𝑓𝑓𝑗=𝜅1𝑠+𝜅2𝑠𝑒−𝑎𝑐𝑐𝑗+𝜅3𝑠𝑡𝑒𝑐ℎ𝑗+𝜅4𝑠𝑡𝑒𝑐ℎ𝑗∙ 𝑎𝑐𝑐𝑗2 +𝜅5𝑠𝑤𝑡𝑗+𝜅6𝑠𝑤𝑡𝑗∙ 𝑎𝑐𝑐𝑗+𝜀𝑗 3.1
𝑤𝑗 =𝜎1𝑠+𝜎2𝑠𝑒−𝑎𝑐𝑐𝑗 +𝜎3𝑠𝑡𝑒𝑐ℎ𝑗+𝜎4𝑠𝑤𝑡𝑗+𝜎5𝑠𝑤𝑡𝑗∙ 𝑎𝑐𝑐𝑗+ 𝜈𝑗 3.2
The subscript j in Equations 3.1 and 3.2 denotes the vehicle design in vehicle class s, where the specific design represents a combination of design parameters which were input into the vehicle simulations as described in Section 3.2.2.
The dependent variable in Equation 3.1 is the fuel efficiency of a vehicle, eff, in terms of gallons per 1,000 miles. The 0-60 acceleration time is denoted acc , wt is the curb weight of the vehicle, and tech is the scalar measure of technological features