Protective factors and college student drinking
patterns in pre and post Katrina New Orleans
David Florkowski1, Gayle Walter2, John Kowalczyk3, Peter B. Anderson3
1Physician Information Technology Office, British Columbia Medical Association, Vancouver, Canada; *Corresponding Author:
2University of Dubuque, Dubuque, USA 3Walden University, Minneapolis, USA
Received 13 October 2013; revised 21 November 2013; accepted 1 December 2013
Copyright © 2013 David Florkowski et al. This is an open access article distributed under the Creative Commons Attribution License,
which permits unrestricted use, distribution, and reproduction in any medium, provided the original work is properly cited.
ABSTRACT
Rates of heavy drinking, tobacco use and illicit substance use peak among college students be- tween 18 and 25 years of age. Attitudes, per- sonal characteristics, and behaviors that are cal- led protective factors could play a role in redu- cing college students’ use of alcohol and drugs. We studied the relationships between selected protective factors and alcohol consumption in college students from a public commuter uni- versity in New Orleans, Louisiana pre- and post- Hurricane Katrina utilizing the Core Alcohol and Drug Survey (CADS) Long Form. We applied Hirschi’s social control theory to examine the relationships between drinking and the identi- fied protective factors. Three research questions with null and alternative hypotheses were tested to explore the impact of Hurricane Katrina on protective factors and drinking utilizing linear/ logistic and multivariate regression models to test the hypotheses. We found that post-Katrina students were on average about 1.5 years older and drank approximately 1.5 more drinks per week than pre-Katrina students. Both pre and post Katrina age, gender, and race/ethnicity were significantly related to drinking among these groups of college students such that older stu- dents, women, and non-Whites tended to have reduced odds of drinking. There were no statis- tically significant relationships between indi- vidual protective factors or any group of pro- tective factors and drinking after controlling for age, gender, and race/ethnicity indicating that these 3 individual characteristics that cannot be altered were stronger predictors of drinking than any other factors we tested.
Keywords: Protective Factors; College Drinking; Hurricane Katrina; New Orleans
1. BACKGROUND
In the United States, the rates of heavy drinking, to- bacco use, and illicit substance use peak between 18 and 25 years of age and there is some evidence to indicate that protective factors play a role in college students use of alcohol and drugs [1]. Protective factors are attitudes and behaviors that contribute to reducing the risk of il- licit drug use by offsetting the correlation between sub- stance use and risk factors [2]. The protective factors identified for the purposes of this article are cultural in- fluences and family values, extracurricular involvement, exercise, academic performance, religious affiliation, housing environment, and work status.
According to the researchers who conducted the Moni- toring the Future national survey, “In 2010, college stu- dents were modestly higher in lifetime, annual, and 30- day use of alcohol than the non-college group; the differ- ence was largest in the 30-day rate 65% vs. 55% [3]. College students also had a higher prevalence of occa- sions of heavy drinking (five or more drinks in a row in the past two weeks)—37% versus 28% among their age peers. Nearly half of all college students (44%) were reported to have been drunk in the prior 30 days com-pared to 29% of the noncollege respondents. The rates of daily drinking were similar for the two groups at 3.6% versus 3.4% of the respondents drinking daily [3].
The Core Institute to detect any marked differences in alcohol consumption among college students in Louisi- ana compared to college students throughout the rest of the United States [3]. In Louisiana in 2007, 78.7 percent of college students drank alcohol in the past year com- pared to the US average of 84.0. In 2009, the percent- ages were 79.8 (Louisiana) and 84.2 (US), respectively. Also in Louisiana in 2007, 17.7 percent of college stu- dents participated in heavy alcohol use (3 or more times per week) compared to the US average of 23.5 percent. In 2009, the percentages were 17.5 (Louisiana) and 23.0 (US), respectively [4]. The authors concluded that there was not a significant difference in the drinking behaviors among college students in Louisiana compared to college students in the United States based on this sample.
2. PROTECTIVE FACTORS
2.1. Cultural Influences and Family Values
The amount of time and attention given by a parent to a child can affect the child’s risk of alcohol use. Lo et al.,
[5], surveyed 98,822 students in Alabama that were en- rolled for the 2002 spring term. Two variables were used to assess the frequency of alcohol use over lifetime and frequency of alcohol use past 30 days. The research study provided evidence that strong family ties did offer protection against the use of alcohol and other drugs [5]. In a separate study, students from a sample of under- graduate students were almost 1.5 times likely to abstain from alcohol if their mother abstained from alcohol as those whose mother was a drinker [6]. Family factors are indeed associated with higher levels of alcohol use and other problem behaviors. Marital conflict, stressful events, and violence within the family are all associated with increased alcohol use [7].
2.2. Extracurricular Involvement
Laboratory research suggests that an inverse relation- ship exists between substance use and substance-free reinforcement, but limited research has been conducted on the prevention of substance abuse and substance-free reinforcement. A study was conducted using a sample of college students who had just recently completed an al- cohol intervention program to evaluate the relationship between alcohol use and enjoyment from substance-free activities [8]. Regression analyses revealed a negative association between alcohol consumption and substance- free enjoyment for the female college students but not for males [8]. On an interesting note, there was greater av- erage enjoyment from substance-free activities was asso- ciated with greater motivation drinking among both males and females. Weinstock [9] also performed a meta- analysis evaluating exercise as an intervention for haz- ardous drinking. Alcohol consumption has been re-
ported to take the place of participation in substance-free activities, such as exercise. Exercise has numerous phy- sical and mental health benefits and has been shown to help individuals cope with stress [9]. Many college stu- dents drink alcohol as a response to stress so it makes perfect sense to replace alcohol use with participation in a substance-free exercise regimen. The summary of the meta-analysis reveals that engaging in alternative sub- stance-free activities appears to be associated with re- ductions in alcohol use in college students, especially for those who are currently not seeking treatment [9]. The esearch assessing the implications of participation in extra-curricular activities is limited and our current study will help to fill this gap in research.
2.3. Exercise
In our study, the association of protective factors against alcohol consumption in college students in Lou- isiana was evaluated before and after Hurricane Katrina in 2005. Several studies have addressed protective and risk factors related to drinking among college students. Ward and Gryczynski [10] completed a study that exam- ined alcohol use among students involved in recreational sports. A survey was distributed to 1000 students drawn from a stratified, random sample from undergraduates at a 4-year university [10]. Alcohol use was assessed by self-report and was measured by 7 different variables. The data set included 494 respondents after accounting for cases with missing values and then weighting the data. After completing multivariate regression, a significant positive relationship was found (p < 0.5) between stu- dents who participated in organized recreational sports and the number of drinks per day and drinks per month compared to students who did not participate in organ- ized recreational sports, accounting for other variables such as race, sex, and Greek membership [10].
Huang et al. who found that non athletes were found to
be almost 2 times as likely to abstain as athletes [6]. An- other study by Martens and Martin [12] also performed a study on college athletes drinking motives and competi- tive seasonal status using the Athletic Drinking Scale (ADS). Results supported other findings that athlete- specific drinking motives increased during the athlete’s competitive seasons. Therefore, the athlete’s drinking patterns may be most strongly influenced by their sport and teammates during the competitive season, whereas during the off-season, athletes may be more influenced by the drinking tendencies and general drinking motives of the typical non-athlete [12].
2.4. Academic Performance
The role of posttraumatic stress (a possible outcome for people who experienced the devastation of hurricane Katrina) and problem drinking has been examined in its relationship to university academic performance [13]. The transition from high school to college is met with increased responsibilities but also freedom from parental control which may lead to increased risk taking [13]. Two risks that are frequently experienced by university students are heavy drinking and traumatic events [13]. A study conducted by Bachrach and Read further explored the relationship between post-traumatic stress disorder during the first year of college to academic performance and whether alcohol behavior mediates the relationship between Posttraumatic Stress Disorder (PTSD) and poor academic outcomes [13]. PTSD is a mental health diffi- culty that can occur after a person experiences a trau- matic event such as war, assault, or disaster [14]. Initial screening surveys were sent to incoming freshmen from two universities in the summer prior to arriving on cam- pus. The recruitment took place in three cohorts during the fall of 2006 and 2007. A portion of the subset sample was targeted for longitudinal follow-up based on re- sponses to trauma-related questions where 649 students had endorsed at least one symptom in each PTSD cluster. To measure alcohol use, respondents were given a stan- dard drink conversion chart to ensure accuracy in report- ing the number and amount of alcohol consumed. Ac- cording to the CDC, a standard drink is equal to 14.0 grams (0.6 ounces) of pure alcohol which is usually found in 12-ounces of beer, 8-ounces of malt liquor, 5- ounces of wine, or 1.5-ounces or a “shot” of 80-proof distilled spirits or liquor [15]. Relative to participants who never had PTSD, those who developed PTSD over the course of the year had lower end-of-year GPA (p = 0.001), but when and additional ANCOVA was perfor- med, there was not a statistically significant finding in the use of alcohol (p = 0.78) [13].
2.5. Religious Affiliations and Practices
Another protective factor addressed in our study was the effect of religiosity as it pertains to alcohol use on college campuses. Religious groups can be considered to be social reference groups for many students and provide a set of standards for social acceptance and the control of alcohol consumption [16]. Wells conducted a study on religiosity and campus culture in relationship to alcohol consumption among college students using the reference group theory. The sample included students (N = 250) attending a religiously affiliated private college and stu- dents (N = 280) enrolled at a large secular state univer- sity. A convenience sample was chosen based on the length of the survey and the willingness of faculty to facilitate the survey during classes. The College Alcohol Survey was used to study alcohol consumption and was the dependent variable. Religiosity was the independent variable and was measured by the “The Religiosity Mea- sure”. The mean alcohol consumption for the students at the religious institution was 11.9 (SD = 27.6) drinks in the 30 days prior to the survey, which was significantly lower than the 26.9 (SD = 53.1) drinks per 30 days for students attending the secular university (U = −7.55, p < 0.5) [16]. The relationship between level of religiosity and alcohol was also examined and demonstrated a nega- tive correlation showing that as religiosity increased, alcohol consumption decreased.
In another study, Harden used twin and sibling pairs drawn from the National Longitudinal Study of Adoles- cent Health to test whether religious adolescents had a later age at first drink than their non-religious co-twins and/or co-siblings [17]. Contrary to the study by Wells, the religious adolescents did not differ from their non- religious siblings in their mean age at first drink. Family or cultural environments play more of a role in early drinking rather than religiosity. However, when compar- ing unrelated teenagers, religious involvement was asso- ciated with a six-month delay in initiating alcohol use [17]. In addition, students who spent 6 or more hours per week in religious group practices, compared with those who did not participate, were approximately 7 times as likely to abstain. Religious group participants who spent 1 - 2 or 3 - 5 hours per week were not significantly dif- ferent from those who did not participate [6].
2.6. Housing Environment
that asked, “Where do you live now? That is, where do you stay most often?” The options were gender-specific dorms (n = 68) or co-ed dorms (n = 442) [18]. The par- ticipants’ alcohol use was assessed by measuring the frequency of binge drinking and alcohol consumption using a 6-point scale. Results indicated that students liv- ing in gender-specific housing were less likely to con- sume alcohol (F = 13.03, p < 0.01) and engage in binge drinking (F = 6.41, p < 0.05) than students living in co- ed housing [18].
2.7. Work Status
Approximately 57% of college students work while attending [19]. The authors in this study examined a col- lege student cohort to evaluate the association between hours worked and binge drinking. A random sample of 1700 undergraduates was acquired from a southeastern university in the United States. The students’ work hours were categorized in three categories for analyses: low (< 10 hours), medium (10 - 19 hours), and high (≥20 hours) [19]. Binge drinking was a dependent variable and was measured by self-reported data. After logistic regression analyses, those who worked more than 20 hours per week were 1.56 times more likely to be binge drinkers (p = 0.023) [19]. Binge drinking is considered having five or more drinks in a two-hour period for males, and hav- ing four or more drinks in a two-hour period for females [15]. The results revealed an association between number of hours worked (>20) and the odds of binge drinking. Compared with students who worked 1 - 9 hours per week for salary/wages, those who did not work were almost two times as likely to abstain from the use of al- cohol [6].
3. RESULTS
On average, the participants in both surveys had about 2 protective factors (see Table 1). Each participant could
have a minimum of zero to a maximum of 7 protective factors. Overall, spring 2006 semester participants drank more than 4 drinks per week compared to only 3 drinks per week among spring 2005 participants. This differ- ence in average consumption of alcoholic drinks among the two study groups was statistically significant. The mean age of participants among 2005 spring semester was 22 years (ranging from 18 years to 63 years of age). The mean age of participants in 2006 spring semester was 23 years with youngest participant of 17 yr of age and oldest participants of 51 yr of age. This difference in age among two groups was also statistically signifi- cant.
Research question one: What are the relationships be- tween age, gender, race/ethnicity, and the selected pro- tective factors (i.e., Cultural Influences and Family Va-
lues; Extracurricular Involvement; Exercise; Academic Performance; Religious Affiliation and Practices; Hous- ing Environment; and Work Status), and alcoholic drinks consumed per week among study participants?
Null hypotheses:
1) There is no effect of age of the participant on num- ber of alcohol drinks consumed per week by the par- ticipants after adjusting for effect of gender, race/ethni- city, number of protective factors and semester.
2) There is no effect of gender of the participant on the number of alcohol drinks consumed per week by the par- ticipants after adjusting for effect of age, race/ethnicity, number of protective factors and semester.
3) There is no effect of race/ethnicity of the participant on the number of alcohol drinks consumed per week by the participants after adjusting for effect of age, gender, number of protective factors and semester.
[image:4.595.310.536.460.550.2]4) There is no effect of the number of protective fac- tors available to the participant on the number of alcohol drinks consumed per week by the participants after ad- justing for effect of age, gender, race/ethnicity and se- mester.
Table 2 shows the results of simple and multiple lin-
ear regression models. With each year increase in age of the participant, alcohol use was reduced by 0.01 drinks per week. The effect of age doubled after adjusting for effects gender, race and number of protective factors. So for each 1 year increase in age of the participant alco-
Table 1. Characteristics of study population, continuous varia-
bles.
2005 Semester 2006 Semester Mean
(Range)
Mean (Range)
t-Test Statistic p-Value
Protective Factors 2.3 (0 - 8) 2.2 (1 - 9) −0.06 0.51
Age 21.65 (18 - 63) 23.24 (17 - 51) −3.62 <0.001*
Number of Drinks 2.9 (0 - 50) 4.4 (0 - 50) −1.49 0.002*
Note: *p-value is <0.05, denotes statistically significant difference in mean
[image:4.595.311.537.610.697.2]of two study groups.
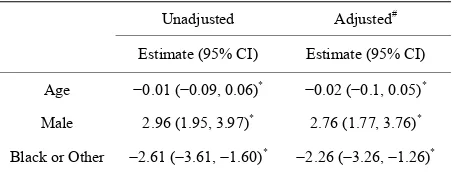
Table 2. Relationship between number of alcoholic drinks con-
sumed and other study characteristics.
Unadjusted Adjusted#
Estimate (95% CI) Estimate (95% CI)
Age −0.01 (−0.09, 0.06)* −0.02 (−0.1, 0.05)*
Male 2.96 (1.95, 3.97)* 2.76 (1.77, 3.76)*
Black or Other −2.61 (−3.61, −1.60)* −2.26 (−
3.26, −1.26)*
Note: OR = Odds Ratio, 95% CI = 95% Confidence Interval; “Number of
Alcohol drinks per week” is modeled as outcome; *Odds ratio is considered
statistically significant if 95% Confidence Interval excludes 1; #Each odds
holic drink consumption was reduced by 0.03 per week given all other covariates were constant. This effect of age on number of drink consumed per week was statisti- cally significant. Males drank significantly more (almost 3) drinks per week compared to female participants in both survey groups. After adjustment for effect of other covariates the effect of gender remained significant. Par- ticipants who were any race other than White drank al- most 3 less drinks per week compared to participants with White race. This difference in drinking rate reduced to little more than 2 less drinks after adjusting for the effect of age, sex, and protective factors. However the effect remained statistically significant.
A participant in spring 2006 semester consumed about 1.5 more drinks per week compared to spring 2005 se- mester participant. However, this difference was not sta- tically significant. This difference remained non-signi- ficant even after adjusting for the effect of age, gender, race and number of available protective factors (see Ta- ble 3). Similarly, each additional protective factor did
not impact drinking significantly.
Research Question two: What are the relationships be- tween age, gender, race/ethnicity, the selected protective factors, and drinking patterns in the past two weeks among study participants?
Null Hypotheses:
1) There is no effect of the number of available pro- tective factors on alcohol drinking within past two weeks among study participants after adjusting for effect of age, gender and race/ethnicity of the participant.
2) There is no effect of age of the participant on alco- hol drinking within past two weeks among study partici- pants after adjusting for effect of gender, race/ethnicity and availability of protective factors to the participant.
3) There is no effect of gender of the participant on alcohol drinking within past two weeks among study par- ticipants after adjusting for effect of age, race/ethnicity and availability of protective factors to the participant.
4) There is no effect of race/ethnicity of the participant
[image:5.595.312.537.447.517.2]on alcohol drinking within past two weeks among study participants after adjusting for effect of age, gender and availability of protective factors to the participant.
Table 4 shows results of simple and multiple logistic
regression predictive models. This logistic regression analysis was done separately for spring 2005 and spring 2006 participants. In multiple logistic regression models, the effect of each independent variable is adjusted for the effect of other remaining covariates in the model. For example, in Table 4 the effect of the protective factors
on drinking was adjusted for the effects of age, gender and race.
Among spring 2005 semester participants, the pre- sence of any 5 protective factors did not show any effect on alcohol drinking within last two weeks (OR = 0.99). Although after adjustment for the effects of age, gender and race, those participants who reported the presence of 5 or more protective factors showed 30% less odds of drinking within last two weeks compared to participants without any protective factors, this effect was not statis- tically significant. For spring 2005 semester and 2006 spring semester participants one year increase in age reduced the odds of drinking in the past two weeks by 5% after adjusting for effects of other covariates, this difference was statistically significant.
Female participants in spring 2005 semester had 40% less odds of drinking alcohol in the past two weeks com-
Table 3. Relationship between number of alcoholic drinks con-
sumed and other study characteristics.
Unadjusted Adjusted#
Estimate (95% CI) Estimate (95% CI)
Spring 2006 Semester 1.5 (0.51, 2.49) 1.17 (0.19, 2.14)
Protective factors 0.033 (−0.36, 0.43) 0.004 (−0.37, 0.38)
Note: OR = Odds Ratio, 95% CI = 95% Confidence Interval; “Number of
Alcohol drinks per week” is modeled as outcome;Odds ratio is considered
statistically significant if 95% Confidence Interval excludes 1. #Each odds
[image:5.595.59.542.583.715.2]ratio is adjusted for effects of other covariates.
Table 4. Association between past alcohol drinking and various study characteristics by semester.
2005 Spring Semester^ 2006 Spring Semester^
Unadjusted Adjusted# Unadjusted Adjusted#
OR (95% CI) OR (95% CI) OR (95% CI) OR (95% CI)
Protective Factor 0.99 (0.85, 1.17) 0.91 (0.75, 1.10) 0.88 (0.74, 1.05) 0.92 (0.75, 1.14)
Protective Factor (Factors = 5) 0.99 (0.45, 2.19) 0.63 (0.25, 1.58) 0.54 (0.22, 1.32) 0.66 (0.23, 1.88)
Age (1 yr Increase) 0.96 (0.92, 1.00) 0.95 (0.91, 0.99)* 0.95 (0.91, 0.99)* 0.94 (0.89, 0.92)*
Female 0.59 (0.38, 0.93)* 0.61 (0.38, 0.97)* 0.42 (0.27, 0.66)* 0.41 (0.26, 0.65)*
Black or Other 0.36 (0.23, 0.56)* 0.34 (0.21, 0.56)* 0.48 (0.30, 0.78)* 0.59 (0.35, 0.98)*
Note: OR = Odds Ratio, 95% CI = 95% Confidence Interval; ^“Alcohol drinking in past two weeks” was modeled as outcome & “Non-drinking” was modeled
pared to male counterparts. However, this gender effect is more pronounced among spring 2006 participants. Spring 2006 females had 60% less odds of drinking in the past two weeks compared to male participants in that semester. This effect of gender on past alcohol drinking was statistically significant in both semester groups.
Among spring 2005 semester students, those partici- pants identifying as a non-white race had 66% less odds of drinking in the past two weeks compared to Whites after adjusting for the effects of other covariates. Simi- larly, for spring 2006 semester participants being a non- White (Black or other race) resulted in a 40% lower odds of drinking alcohol in the past two weeks compared to participants of White race This effect of race/ethnicity was also statistically significant in both semesters.
Research Question 3: Is the relationship between hav- ing a full time job, higher grades (b- or better) or partici- pation in religious groups more protective for drinking alcohol within the past two weeks compared to other protective factors (i.e., Cultural Influences and Family
Values; Extracurricular Involvement; Exercise; and Hous- ing Environment)?
Null hypothesis: There is no difference in the effect of having a fulltime job, better grades (b- or greater) or par- ticipation in religious groups and other protective factors on drinking alcohol in the past two weeks.
A logistic regression model was fitted to assess effect of presence of a special group of protective factors on alcohol drinking within the past two weeks (Table 5).
Participants who worked full time, earned b- or greater grades, and participated in religious groups has almost 17% higher odds (risk) of drinking in the past two weeks compared to participants without those specific protec- tive factors. The effect remained almost the same after adjusting for age, gender and race. This effect however, was not statistically significant (95% CI 0.84 - 1.68).
[image:6.595.309.537.611.735.2]For some of the multiple regression models, the statis- tical program, G* power version 3.1.5 for Windows, ex- cluded any observation which has missing information of one or more independent variables. For example, during the analysis for Tables 2 and 4 (Multiple linear regres-
Table 5. Effect of special group of protective factors on past
alcohol drinking.
Alcohol Drinking vs.Non-Drinking
Unadjusted Adjusted#
OR (95% CI) OR (95% CI)
Special Group vs. Other Group 1.17 (0.86 - 1.58) 1.19 (0.85 - 1.68)
Note: OR = Odds Ratio, 95% CI = 95% Confidence Interval; “Alcohol drinking in past two weeks” was modeled as outcome & “Non-drinking” was modeled as reference; Odds ratio is considered statistically significant if
95% Confidence Interval excludes 1. #Odds ratio is adjusted for effects of
Age, Gender and Race/Ethnicity of participant.
sion and Multiple logistic regression), only 699 partici- pants were used as 101 participants were missing one of the values in an independent variable.
Post-hoc power analysis (Table 6):
Our linear multiple regressions have a 99% power to detect the R-square change from zero to 7.68 percent with sample size of 699 at 5% level of alpha and with five independent variables.
4. DISCUSSION
[image:6.595.129.282.619.668.2]We found that in spring 2006 students were slightly, and significantly older than students in the spring of 2005 and that they drank, on average, slightly and sig- nificantly more than students in the spring of 2005. In each cohort as students aged, they drank less, males drank more than females, and white students drank more than students of any other race. None of these results are surprising or different from results reported by other re-searchers. In the study by Walter & Kowalczyk [20], there was a positive association between students who were 21 years of age compared to students under the age of 21 against the odds of heavy drinking. The results were also significant in gender as males were twice as likely to engage in heavy drinking compared to females [20]. Our non-significant results may be the most telling as there were no significant differences in drinking levels based on total number of protective factors or the special group of protective factors (full-time employment, higher grades, and religious practices) compared to others. Ex-pectations based on theory would be that the number of protective factors would be predictive of drinking such that more protective factors would relate to less drinking and that the select group of protective factors we tested would also be predictive of drinking such that having all 3 of the select factors, full-time employment, higher grades, and religious practices would relate to less drink- ing. Pervious researchers [13,16,19] have reported mixed results concerning these specific protective factors. Miller [19] reported that those who worked more than 20 hours per week were 1.56 times more likely to be binge drink- ers. In regards to higher grades, relative to participants
Table 6. Post hoc power analysis.
Semester
Alcohol Spring 2005
Semester Spring 2006 Semester Total
Frequency 204 150 354
Nondrinker
Column Percent 49.51 40.32
Frequency 208 222 430
Drinker
Column Percent 50.49 59.68
who never had PTSD, those who developed PTSD over the course of the year had lower end-of-year GPA (p = 0.001), but when additional ANCOVA was performed, there was not a statistically significant finding in the use of alcohol [13]. Wells [16] posited that the relationship between level of religiosity and alcohol demonstrated a negative correlation showing that as religiosity increased, alcohol consumption decreased.
So, why were protective factors not “protective” for our groups of students? It is possible that the effect was there but too small for us to detect. It is also possible that our respondents were different from other groups used to test theory about protective and risk factors or that our respondents possessed a number of risk or protective fac- tors that we did not test and these other factors were more influential than the ones we tested. We would ar- gue that this last explanation is at least partially true. The impact of Hurricane Katrina was devastating for every- one living in New Orleans and along much of the Gulf coast. The few protective factors we captured in our study could well be overshadowed by other, untested fac- tors that would explain our results. In addition, the 3 in- dividual characteristics that cannot be altered—age, gen- der, and race/ethnicity, were stronger predictors of drin- king than any other factors we tested. In the circum- stance of post-Katrina college student drinking, it was clearly younger, white, college males who exhibited the highest levels of drinking and therefore might be the group at greatest risk for the known consequences of drinking.
REFERENCES
[1] US Department of Health and Human Services, Sub- stance Abuse and Mental Health Services Administration (SAMHSA) Office of Applied Studies (2003) National survey on drug use and health.
[2] Oetting, E., Edwards, R., Kelly, K. and Beauvais, F. (1997) Risk and protective factors for drug use among rural American youth. NIDA Research Monographs, 168, 90-130.
[3] Johnston, L.D., O’Malley, P.M., Bachman, J.G. and Schu- lenberg, J.E. (2011) Monitoring the future national survey results on drug use, 1975-2010. Volume II: College stu- dents and adults ages 19-50. Institute for Social Research, The University of Michigan, Ann Arbor, 312 p.
[4] The Substance Abuse Epidemiology Workgroup (2009) Louisiana Statewide Substance Abuse Epidemiology Pro- file.
[5] Lo, C., Anderson, A., Minugh, P. and Lomuto, N. (2006) Protecting Alabama students from alcohol and drugs: A
multi-level modeling approach. Journal of Drug Issues,
36, 687-718.
[6] Huang, J., DeJong, W., Towvim, L. and Schneider, S. (2008) Sociodemographic and psychobehavioral charac- teristics of US college students who abstain from alcohol.
Journal of American College Health, 57, 395-410.
[7] Windle, M. and Zucker, R. (2010) Reducing underage and youth adult drinking. Alcohol Research & Health, 33, 29-43.
[8] Murphy, J., Barnett, B., Goldstein, A. and Colby, S. (2007) Gender moderates the relationship between substance- free activity enjoyment and alcohol use. Psychology of Addictive Behavior, 21, 261-265.
[9] Weinstock, J. (2007) A review of exercise as intervention for sedentary hazardous drinking college students: Ra- tionale and issues. Journal of American College Health,
58, 539-543.
[10] Ward, B. and Gryczynski, J. (2007) Alcohol use and par- ticipation in organized recreational sports among univer- sity undergraduates. Journal of American College Health,
56, 273-280.
[11] Moore, M. and Werch, C. (2008) Relationship between vigorous exercise frequency and substance use among first year drinking college students. Journal of American College Health, 56, 686-690.
[12] Martens, M. and Martin, J. (2010) College athletes’ drinking motives and competitive seasonal status: Addi- tional examination of the athlete drinking scale. Addiction Research and Theory, 18, 23-32.
[13] Bachrach, R. and Read, J. (2012) The role of posttrau- matic stress and problem alcohol involvement in univer- sity academic performance. Journal of Clinical Psychol- ogy, 68, 843-858.
[14] Nebraska Department of Veteran Affairs (2012) Post trau- matic stress disorder.
[15] Centers for Disease Control (2012) Alcohol and public health. Frequently asked questions.
[16] Wells, G. (2010) The effect of religiosity and campus alcohol culture on collegiate alcohol consumption. Jour- nal of American College Health, 58, 295-304.
[17] Harden, K. (2010) Does religious involvement protect against early drinking? A behavior genetic approach. Jour- nal of Child Psychology & Psychiatry, 51, 763-771.
students. Journal of American College Health, 58, 241-
246.
[19] Miller, K., Danner, F. and Staten, R. (2008) Relationship of work hours with selected health behaviors and aca- demic progress among a college student cohort. Journal of American College Health, 56, 675-679.
[20] Walter, G. and Kowalczyk, J. (2012) The effectiveness of alcohol policies in 4-year public universities. Journal of Community Health, 37, 520-528.