http://dx.doi.org/10.4236/detection.2016.43007
Studying Different Etching Methods Using
CR-39 Nuclear Track Detector
Nada Farhan Kadhum, Layth Abdulhakeem Jebur, Ali A. Ridha
Department of Physics, College of Science, Al-Mustansiriyah University, Baghdad, Iraq
Received 22 April 2016; accepted 10 June 2016; published 13 June 2016
Copyright © 2016 by authors and Scientific Research Publishing Inc.
This work is licensed under the Creative Commons Attribution International License (CC BY).
http://creativecommons.org/licenses/by/4.0/
Abstract
In this research we try to investigate the optimum etching time for the tracks originate in (CR-39) solid state nuclear track detector after irradiated with alpha source (241Am) using three different
etching techniques: the traditional method (water bath), microwaves and ultrasound devices. The track etching parameters: bulk etch rate (VB), track etch rate (VT), track etch rate ratio evaluates (V), critical angle (θC), and etching efficiency (η) were calculated in this research. It’s seen that the optimum etching time was ranging with (60 - 150 min), (20 - 30 min) and (60 - 120 min) when etching with water bath, microwave and ultrasound respectively. Also we observed that the criti-cal angle was (24.29) when etching CR-39 detector with microwave. This value is lower than the critical angles values for the detector etched with water bath or ultrasound; thus it can be the op-timum magnitude because its decrease leads to increasing the number of the tracks appeared in the detector and the etching efficiency.
Keywords
Chemical Etching, Microwave, Ultrasound, CR-39, Track Etching Parameters
1. Introduction
smooth and well defined [2].
The geometry of track etching depends on chemical etching solution along the particle track at a linear rate VT, and a general attack on the etched surface and on the interior surface of the etched track at a lesser rate VB[3].
The bulk etch rate VB is the rate at which the undamaged surface of the detector is being removed during chemical etching. It is calculated from the equation (1) [4]
2
B
D V
t
= (1)
where (D) is the average diameter of the track, which is measured with the use of camera supplied with a soft-ware program.
Track etch rate or the etch rate along the latent track was calculated from the equation (2) [4]
2 2 1 1 D B T B D B V V V V V V + = − (2)
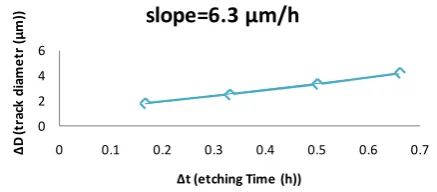
where (VD) is the diameter rate of the tracks which can be calculated from the slope of the relation (VD= ΔD/Δt) between track diameters and etching times.
Etching rate ratio (V) is calculated from Equation (3), by dividing the average of VT on the average of VB for each case [4].
T
B V V
V
= (3)
Critical angle of etching (θC) is determining the appearance of the etched track; it represents the minimum an-gle at which the etched tracks would appear on the detector surface. There is a certain critical anan-gle for each de-tector types; it’s calculated for all cases from Equation (4) [4][5].
1 sin B c T V V
θ
= − (4)
Etching efficiency (ƞ) is the rate between the numbers of tracks etched in the nuclear track detector to the number of incident particles on it. It is calculated from Equation (5) [4][5].
1 B
T V V
η
= − (5)
2. Aim of the Research
1) Estimate the optimum etching time of CR-39 detector to get both the largest track density and faster etch-ing time when etchetch-ing them chemically with the use of three different heatetch-ing techniques; the conventional me-thod (water bath), microwave and ultrasound when irradiated the detector with alpha particles.
2) Calculate the etching parameters (VB, VT, V,θC, ƞ).
3. Experimental Details
3.1. Irradiation
equation:
( )3 2
0.318
Tα =Rα (6)
where (Tα) is the energy of alpha particle in MeV and Rα its range in air measured in cm.
3.2. Chemical Etching
After irradiation the detectors with alpha particles they were chemically etching, chemical etching its usually carried out in thermostatically-controlled bath at temperatures ranging from 40˚C to 70˚C, and the commonest etchant is an aqueous solution of NaOH or KoH at a molarity of from 2 - 6 M and the typical etching times range from 2 - 6 hr.
In this research the detector was etched in 6.25 NaOH solution by three different heating techniques; water-bath, microwave and ultrasound.
3.2.1. Water Bath
The detectors where be etched by putting them in etchant solution in volumetric flask putted inside the water bath tank at a temperature of (70˚C).
3.2.2. Laboratories Microwaves
It’s the technique was first used at 2010 [3] where used the conventional microwave oven operating at frequency of 2.45 GHz to speed the time of etching CR-39 irradiated by alpha particles, second it was used by at 2014 [6] [7] to etch CR-39 irradiated with fission fragments as well as by the commercially microwave oven (LG type) with frequency of (2.45 MHz) and (230 V) voltage and output power of (1300 W).
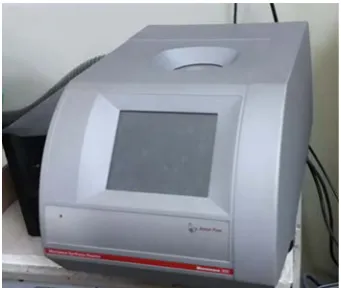
In this research the laboratory microwave instrument shown in Figure 1 was used for the first time to etch the CR-39 detectors instead of the microwave oven, (Monowave300) type from the production company (Anton Parr) Austrian, with a frequency of 2.45 GHz and a temperature of 70˚C for a selected time intervals, its used by placed the etching solution and the detectors in special test tube then putting in a laboratory microwave.
3.2.3. Ultrasound Waves
Ultrasound is considered one of the factors which affect the properties of the SSNTDs [8] the vibration produced by the ultrasound source will excite the molecules of the detector material and the free radicals formed in the damaged regions through particle irradiations [9]. Etching with ultrasound performs by putting the detectors in-side the etching solution in an ultrasound bath with a frequency of 40 KHz and temperature of (70˚C).
3.3. Viewing the Detectors
[image:3.595.228.399.559.703.2]The tracks of alpha produced in the etched detectors are viewed under an optical microscope brand N-200M with a magnification of (400×). The microscope is connected to digital camera and computer to store the pic-tures of the viewing detectors.
4. Calculations
4.1. Etching Time Estimation
The estimation of the etching time for all techniques would complete by testing various times until reaching the optimum one.
4.1.1. When Etching with Water Bath Device
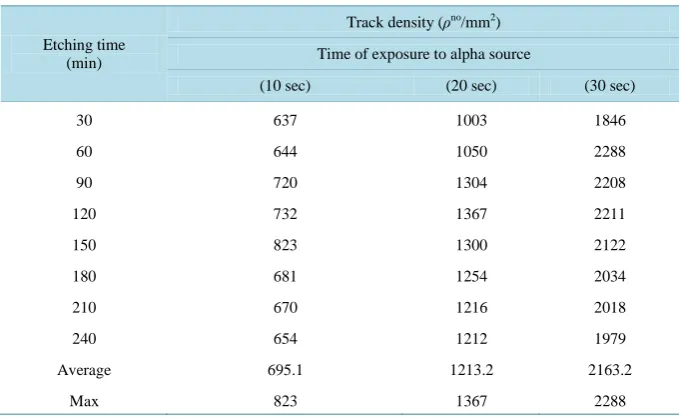
Eight etching times were being select to test the optimum, starting from 30 to 240 min. The utilized etching times, track densities for the three times of irradiation appeared in the detectors, in addition to their maximum and average are listed in Table 1.
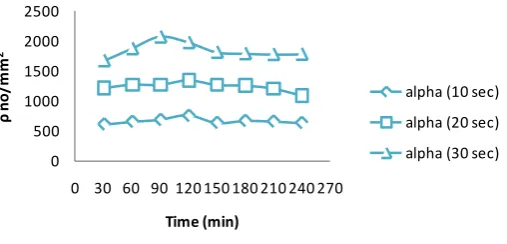
The increasing of the track densities with the increasing of the etching time can be clearly observed in Figure 2.
4.1.2. When Etching with Microwave Device
The exercised etching times and the track densities, in addition to the maximum and average of the track densi-ties are shown in Table 2.
[image:4.595.143.483.337.546.2]The increasing of the track densities with the developing of the latent tracks and the enlarging of them against the increasing of the etching time can be clearly observed in Figure 3.
Table 1. Track densities in CR-39 detector at different doses and various etching times when
using water bath device.
Etching time (min)
Track density (ρno/mm2)
Time of exposure to alpha source
(10 sec) (20 sec) (30 sec)
30 637 1003 1846
60 644 1050 2288
90 720 1304 2208
120 732 1367 2211
150 823 1300 2122
180 681 1254 2034
210 670 1216 2018
240 654 1212 1979
Average 695.1 1213.2 2163.2
Max 823 1367 2288
Table 2. Track densities in CR-39 track detector at the different doses and various etching
times using microwave device.
Etching time (min)
Track density (No/mm2)
Time of exposure to alpha source
(10 sec) (20 sec) (30 sec)
10 654 1124 1453
20 670 1247 1466
30 830 1206 1683
40 708 1057 1630
Average 715.5 1158.5 1558
[image:4.595.146.483.582.724.2]Figure 2. Views of CR-39 detector etched chemically at (30, 90, 150, 240) minutes with water bath.
Figure 3. Views of CR-39 detector etched chemically at (10, 20, 30, 40) minutes with microwave device.
4.1.3. Chemically Etching with Ultrasound Device
The CR-39 track detectors are etched for different Progressive times with an interval of (30 minutes) between them, in order to reach the optimum time. Eight times are used (30, 60, 90, 120, 150, 210, 240) minutes to achieve this. The applied etching times and the track densities appear in the detectors for the three times of ir-radiation, in addition to the maximum and average of the track densities are illustrated in Table 3.
The increasing of the track densities with the developing of the latent tracks and the enlarging of them against the increasing of the etching time can be clearly observed in Figure 4.
4.2. Calculations of Chemical Etching Parameters
The Five chemical etching parameters of CR-39 detectors for the three chemical etching techniques (water bath, microwave and ultrasound) have been calculated. The bulk etch rate of the undamaged surface is calculated from equation (1), where D in equation is the average diameter of the track, which is measured with the use of camera supplied with a software program, by taking the average of several tracks radius measured and then mul-tiplying by two and substituting in the above equation for all our etching times.
[image:5.595.194.436.81.266.2] [image:5.595.192.435.298.489.2]Figure 4. Views of CR-39 detector etched chemically at (30, 90,
150, 240) minutes with ultrasound device.
Table 3. Track densities in CR-39 track detector at the different doses and various etching times using ultrasound device.
Etching time (min)
Track density (no/mm2) Time of exposure to alpha source
(10 sec) (20 sec) (30 sec)
30 614 1212 1672
60 658 1271 1874
90 689 1267 2067.9
120 757 1345 1975
150 640 1265 1814
180 672 1255 1790
210 662 1204 1778
240 638 1088 1721
Average 666.2 1239.5 1836.48
Max 757 1267 2067.9
and etching times. Figures 5-7 represent the slopes for Tables 1-3.
The five etching parameters (VB, VT, V, θC, η) are listed in Table 4 which represent the parameters for; CR-39 detector when irradiated with alpha particles, at the three using devices (water bath, microwave, ultrasound) re-spective.
5. Results and Discussion
5.1. Chemically Etching of CR-39 Detector Irradiated with Alpha
From Tables 1-3 we can plot Figures 8-10 which showing:1) The track density is increased with the increasing of the irradiation time, because the increasing of the al-pha radiation dose.
2) The etching times are being reduced with the increasing of the radiation dose.
[image:6.595.192.437.81.289.2] [image:6.595.145.484.346.531.2]0 5 10
0 1 2 3 4 5
Δ D (t ra ck d ia m et r (µ m ))
Δt (etching Time (h))
slope= 1.84 µm/h
Figure 5. Slope between track diameter and etching time for CR-39 etched with water bath.
0 2 4 6
0 0.1 0.2 0.3 0.4 0.5 0.6 0.7
Δ D (t ra ck d ia m et r (µ m ))
Δt (etching Time (h))
slope=6.3 µm/h
Figure 6. Slope between track diameter and etching time for CR-39 etched with microwave.
0 2 4 6 8 10
0 1 2 3 4 5
Δ D (t ra ck d ia m et r (µ m ))
Δt (etching Time (h))
slope=1.925 µm/h
[image:7.595.202.423.87.184.2]Figure 7. Slope between track diameter and etching time for CR-39 etched with ultrasound.
Table 4. Etching parameters of CR-39 detector irradiated with alpha.
Etching device VB VT V θC η
Water bath 1.15 2.62 2.278 26.03 0.561
Microwave 4.00 9.5 2.375 24.9 0.58
Ultrasound 1.22 2.87 2.352 25.15 0.575
4) The track density when etching with water bath is increased between the etching times (60 - 150 minute). After that the density begins to decrease because the tracks start to overlap each other’s. For microwave the maximum values of the track density would appears at etching time range (20 - 30 minute). For ultrasound the maximum values of the track density would appears at etching time between (60 - 120 minute).
5) The average of the track density of the detectors etched with water bath is more than the average of the track density of the detectors etched with ultrasound.
6) The reason for the ups and down in the chart, the track density begins small number then increases and then decreases.
[image:7.595.203.422.222.318.2] [image:7.595.206.422.355.455.2] [image:7.595.150.484.508.574.2]0 500 1000 1500 2000 2500
0 30 60 90 120 150 180 210 240 270
Tr ac k de ns ity ρ n o/ m m 2
Etching Time (min)
[image:8.595.193.443.84.196.2]Alpha(10 sec) Alpha (20 sec) Alpha (30 sec)
Figure 8. Track density against etching time for (CR-39) etched with
water bath when irradiated at different doses.
0 20 40 60
0 500 1000 1500 2000 Tr ac k de ns ity ρ n o/ m m 2
Etching Time (min)
[image:8.595.187.442.236.343.2]alpha 30 sec alpha 10 sec alpha 20 sec
Figure 9. Track density against etching time for (CR-39) etched with
microwave when irradiated at different doses.
0 500 1000 1500 2000 2500
0 30 60 90 120 150 180 210 240 270
ρ n o/ m m 2 Time (min)
alpha (10 sec) alpha (20 sec) alpha (30 sec)
Figure 10. Track density against etching time for (CR-39) etched with
ultrasound when irradiated at different doses).
1) The etching rate ratio (V) which represent the speed of etching track (VT) relative to the speed of etching surface (VB) have the maximum value when etching in microwave, ultrasound and water bath devices respec-tively. This may be related to the interaction between the microwave radiation and the etching solution during the etching time.
2) The critical angle has the minimum value when etching with microwave than the value when etching with water bath or ultrasound devices. This value can be considers the optimum value because the decreasing of this angle leads to increasing the number of the developed tracks.
3) The registration efficiency for the detectors etched with microwave device is greater than that etched with water bath and ultrasound device.
6. Conclusions
1) The images of tracks viewed in the detectors irradiated for 20 second more clearly because they don’t overlap, so it can be considered the optimum irradiated time in our research.
[image:8.595.189.443.379.501.2]4) The track density increases with the time of exposure.
5) The average of the track densities in all etching techniques is converged somewhat. 6) The greatest etching rate ratio Vobserved when etching with microwave.
7) The etching efficiency when etching with microwave is greater than that etched with water bath or ultra-sound because their critical angle is less.
References
[1] Fleischer, R.L., Price, P.B. and Walker, R.M. (1965) Solid-State Track Detectors: Applications to Nuclear Science and Geophysics. Annual Review of Nuclear Science, 15, 1-28. http://dx.doi.org/10.1146/annurev.ns.15.120165.000245 [2] Tripathy, S.P., Kolekar, R.V., et al. (2010) Microwave-Induced Chemical Etching (MCE): A Fast Etching Technique
for the Solid Polymeric Track Detectors (SPTD). Nuclear Instruments and Methods in Physics Research A, 612, 421- 426. http://dx.doi.org/10.1016/j.nima.2009.10.096
[3] Dazhuang, Z. (2010) Methods Using CR-39 Plastic Nuclear Track Detectors in Radiation Research. Nova Science Publishers, Inc., New York, 10.
[4] Durrani, S.A. and Bull, R.K. (1987) Solid-State Nuclear Detection; Principles, Methods, and Applications. Pergamon Press, UK.
[5] Shahid, M. (2007) Improvements and Calibration of Nuclear Track Detectors of Rare Particle Searches and Fragmen-tation Studies. University degli Bologna, 12.
[6] Nada, F. (2014) Evaluation of the Uranium Concentrations in Human Tissues Samples by Fission Fragments Induced Using CR-39 Nuclear Track Detector. IJAIEM, 3, 98-104.
[7] Hassan, A.Y. (2015) Studying the Radioactivity in Two Human Organs Breast and Uterus Using CR-39 and Lexan Track Detectors. M.Sc. Thesis, University of Al-Mustansiriyah.
[8] Pandey, A.K., Kalsi, P.C. and Iyer, R.H. (1998) Effects of High Intensity Ultrasound in Chemical Etching of Particle Tracks in Solid State Nuclear Track Detectors. Nuclear Instruments and Methods in Physics Research B, 143, 393-399. http://dx.doi.org/10.1016/S0168-583X(97)00735-0