http://dx.doi.org/10.4236/ojss.2013.37037
Soil Quality Mapping Studies Using Nematodes as
Bioindicators
Lakshmy Kamala Sthanu1*, Jaya Divakaran Sarasamma2, Radhakrishnan Thanu Iyer3, Mohandas Chellappan4
1Centre for Environment and Development, Thozhuvancode, Vattiyoorkavu P.O., Thiruvananthapuram, India; 2Department of Envi- ronmental Sciences, University of Kerala, Kariavattom Campus, Thiruvananthapuram, India; 3Division of Geo Informatics, Indian Institute of Information Technology and Management, Kerala, Techno Park Campus, Thiruvananthapuram, India; 4Division of Crop Protection, Central Tuber Crops Research Institute, Sreekaryam, Thiruvananthapuram, India.
Email: *[email protected], [email protected], [email protected], [email protected]
Received October 5th, 2013; revised November 5th, 2013; accepted November 12th, 2013
Copyright © 2013 Lakshmy Kamala Sthanu et al. This is an open access article distributed under the Creative Commons Attribution License, which permits unrestricted use, distribution, and reproduction in any medium, provided the original work is properly cited.
ABSTRACT
Soil quality is one of the most important factors in sustaining the global biosphere and developing sustainable agricul- tural practices. Land use and management practices greatly impact the direction and degree of soil quality changes in time and space. Understanding the effects of land use and management practices on soil quality and its indicators has been identified as one of the most important goals for modern soil science. Soil quality mapping study represents a me- thod for assessing and mapping soil quality changes in time and space in small units. For the present study, changes in the physical, chemical parameters and nematode density of the soils in the rural and urban areas of Thiruvananthapuram district, Kerala, were determined. The soil samples were collected from seven different categories of contaminated soils namely coastal area, sewage disposal area, industrial area, road-side area, agricultural area, market area and gasoline station area, and also from two control stations in rural and urban areas. The soil physico-chemical parameters and ne- matode density were determined. Geostatistics combined with GIS was applied to analyze the spatial variability of soil physico-chemical characteristics and nematode density. This soil quality mapping study provides a basis for identifying tension zones and serves as a triggering mechanism for implementation of soil contamination mitigating strategies.
Keywords: Soil Quality; Mapping Studies; Nematode Density; Spatial Variability; Contaminated Soils
1. Introduction
Industrialization and urbanization have a strong impact on the environment, and its biotic and abiotic components. Many toxins added to the soils by different anthropogenic activities can build up to concentrations that become se- rious threats to plant and animal health (Alloway, 1996) [1]. The presence or absence of indicator species or indicator community reflects environmental conditions. Bio moni- tors provide a direct measurement of a biological effect rather than inferring values using soil extractions (Tara- zona et al., 2005) [2]. The study of regional variations and
the anthropogenic contamination by metals of soils is very important for environmental planning and monitoring in urban areas. Mapping allows for more efficient approach to remediation and monitoring of soil contaminants (For-
tin and Dale, 2005) [3]. Geographical Information System (GIS) is used for the mapping of the contaminants in the study area soils. Based on the GIS analysis, the highest risk sites are identified in which majority of the remedia- tion and monitoring should take place. The major objec- tive of the present study was to monitor the soil quality of selected rural and urban areas in Thiruvananthapuram Dis- trict, Kerala, using nematodes as bioindicators, and also aim- ed to provide base line information on the soil health sta- tus of rural and urban areas of the capital district of Kerala.
2. Materials and Methods
2.1. Study Area
The rural and urban areas in Thiruvananthapuram District, Kerala were selected for the present study (http: www. censusindia.net/2001census results). Thiruvananthapuram
District is located at 8˚26'25" N latitude and 76˚55'25"E longitude. Thiruvananthapuram, the southernmost District in the State of Kerala is the study area. Its southern most extremity, Kaliaikkavila, is only 54 kms away from Kan- yakumari (Cape Comarin), the land’s end of India. The district stretches 78 kms along the shores of the Arabian Sea on the west, Kollam district lies on the north with Thirunelveli and Kanyakumari districts of Tamil Nadu on the east and the south respectively. The district can be di- vided into three geographical regions; highlands, mid- lands and lowlands. The large forest reserves favorably affect the climate and induce rain. Cold weather is expe- rienced in the mountain ranges whereas lower down, the weather is bracing and in the plains, it is generally hot. Though the mean maximum temperature is only around 900F, it is oppressive in the moisture-laden atmosphere of the plains. Humidity is high and rises to about 90 percent during the south-west monsoon. The average rainfall is around 150 cm per annum. It is significant that the district gets rainfall both from the south-west and the north-east monsoons. According to the final figures of 2011census (Census of India, 2011), the population of the district is 3,307,284. The Taluks in Thiruvananthapuram District are Neyyattinkara, Thiruvananthapuram, Nedumangad and Chirayinkeezhu. The district has three major rivers, sev- eral freshwater lakes and more than 300 ponds. The east- ern region is forested, northern regions are mostly under rubber cultivation and the remaining areas have mixed dry land crops of coconut, plantain, tapioca, etc. Built up areas and rice fields complete the land use. Based on the land use pattern, Thiruvananthapuram District has been clas- sified into different categories namely, coastal areas, se- wage disposal areas, industrial areas, road-side areas, agri- cultural areas, market areas, gasoline station areas, benign environment, etc. These areas will be receiving different types of wastes based on the source of contamination. The contaminated sites due to different anthropogenic activi- ties were identified in both rural and urban areas of Thi- ruvananthapuram District after conducting a reconnais- sance survey. Sixteen sampling stations in the rural and urban areas of the Thiruvananthapuram District were se- lected. These include seven different categories of conta- minated soils selected in the rural and urban areas namely coastal area, sewage disposal area, industrial area, road- side area, agricultural area, market area and gasoline sta- tion area. Control soil samples were collected from com- paratively benign environments in both rural and urban areas which were selected as control stations (Table 1).
2.2. Soil Collection
Soil samples (0 - 15 cm depth) from the sampling sta- tions were collected during the pre-monsoon, monsoon and post-monsoon seasons of the study period (April 2009 to January 2010). Composite samples were taken
by mixing the samples collected from five different sites of each station. Soil sampling and analysis of soil phys- ico-chemical characteristics were carried out according to the standard procedures (Gupta, 1999) [4]. The concen- tration of the heavy metals viz. lead, chromium, manga- nese, copper and zinc in the acid digested soil samples were determined (Saxena, 1994) [5] using an Atomic Ab- sorption Spectrophotometer (Model, GBC 932 AA). Karl Pearson’s Product Moment Correlation is used for find- ing significant correlation between nematode densities with all other soil quality parameters in the three differ- ent seasons (SPSS v - 16 for WINDOWS).
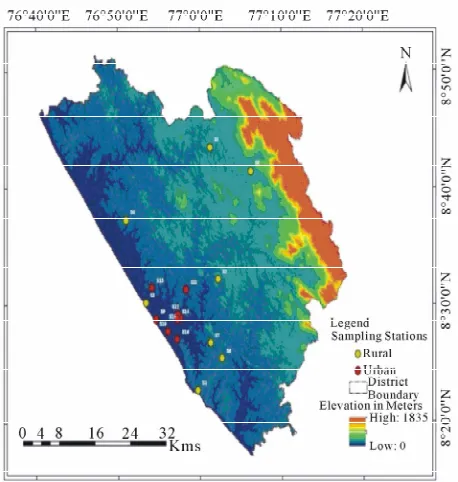
The Geographical coordinates of the sampling stations were collected using Hand-held GPS (Garmin eTrex Vis- ta HCx). The Coordinate values were entered into a spreadsheet with properly assigning IDs for each location. Another spreadsheet was prepared with physico-chemical characteristics and nematode density. In this spreadsheet, the same IDs were entered against respective stations. Both spreadsheets were added in GIS software (Arc GIS version 10) as tables. The table with Geographic coordi- nate values were plotted as point layer using “Display XY” method and subsequently exported as a shape file with WGS84 as reference ellipsoid. The physico-chemi- cal characteristics and nematode density table was joined with the attribute table of the point layer using ID as the foreign key using JOIN method in GIS software (Korte, 2001) [6]. The resultant layer comprised the geometry of stations as points and all the results as associated attrib- ute table (Figure 1). The soil physico-chemical characte-
ristics were analyzed and mapping of significantly corre- lated soil physico-chemical characteristics with nematode density was plotted.
3. Results and Discussion
3.1. Mapping of Physico-Chemical
Characteristics and Nematode Density in Soil
The results of physical characteristics of the soils in the study stations are given in Tables 2(a) and (b) respec-
tively and the soil chemical characteristics analyzed are given in Tables 3(a) and (b) respectively. The results of
heavy metal (Pb, Zn, Mn, Cu, Cr) content in soil are given in Tables 4(a) and (b) respectively. Correlation
studies of soil physico-chemical characteristics with ne- matode density were done.
3.2. Nematode Sampling, Extraction and Density Calculation
Table 1. Portrait of sampling stations in the study area.
Rural Stations Urban Stations
Location Location Name
Latitude Longitude Name Latitude Longitude
Vizhinjam
(Station 1) 8˚33'51" 76˚53'25" Shangumugham (Station 9) 8˚27'50" 76˚55'55" Vilappilssala
(Station 2) 8˚30'18" 76˚53'45" (Station 10) Valiathura 8˚33'51" 76˚53'25" Kochuveli
(Station 3) 8˚30'18" 76˚53'45" Peroorkkada (Station 11) 8˚31'35" 76˚58'03" Mangalapuram
(Station 4) 8˚30'18" 76˚53'45" Thampanoor (Station 12) 8˚29'15" 76˚57'12" Palode
(Station 5) 8˚28'53" 76˚57'08"
Sreekaryam
(Station 13) 8˚30'18" 76˚53'45" Balaramapuram
(Station 6) 8˚27'06" 76˚57'21"
Chalai
(Station 14) 8˚28'52" 76˚57'08" Pallichal
(Station 7) 8˚27'06" 76˚57'31"
Karamana
(Station 15) 8˚28'56" 76˚57'36" Anappara
(Control Station 8) 8˚28'53" 76˚57'08"
Ambalathara
(Control Station 16) 8˚27'06" 76˚57'21"
S1 - S8: Rural Sampling Stations; S9 - S16: Urban Sampling Stations.
Figure 1. Base map showing the sampling stations in the ru- ral and urban areasof.
(45 µ) sieves (ASTM Endecott Sieves) respectively. The residues from 350 mesh sieve was washed and collected into a beaker and allowed to settle for one hour. Then de- canted the supernatant and poured the rest on a wet tissue paper placed on metal gauze in a Petri dish containing water. After two days, collected the nematode containing solution, allowed to settle for decanting and added equal quantity of boiled 4% formalin to kill and fix it. 10 ml of this solution was placed in a nematode Perspex counting
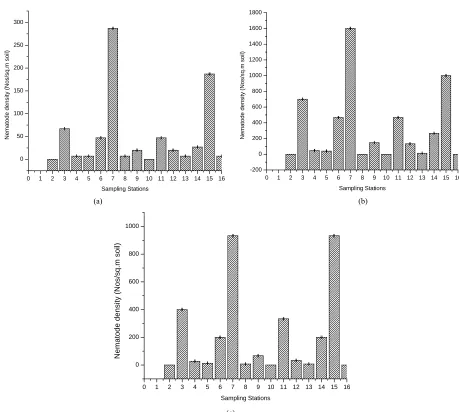
dish (Cobb, 1917) [7] and were observed under a Stere- omicroscope (Model, Leica LED3000 NVI) and their ab- undance was calculated (Southwood and Henderson, 2000) [8] during the three seasons as shown in Figures 2(a)-(c). The soil sample solution was made up to 100 ml
and stirred well. Pipetted 10 ml of this soil solution from three different depths of this 100 ml soil sample solution kept in a beaker and placed in Doncaster’s circular mount- ing tray (Goodey, 1963) [9]. Nematode density is ex- pressed in Number per 100 ml soil.
Electrical conductivity, water holding capacity, mois-ture content, organic matter, total nitrogen content, pho- sphorus content, potassium and copper contents showed positive correlation with nematode density in soil. pH, temperature, pore space, bulk density, chloride, lead, zinc, manganese and chromium contents showed negative cor- relation with nematode density in soil samples collected from both rural and urban area as shown in Tables 5(a)
and (b) respectively. Of the different physicochemical
characteristics studied, water holding capacity, moisture content, organic matter content, pH, zinc and manganese contents only showed significant level of correlation with nematode density. Mapping of significantly correlated soil physico-chemical characteristics with nematode den- sity was plotted. The significance level of correlation co- efficient is given in Table 6.
3.3. Mapping of Significantly Positively Correlated Physico-Chemical
Characteristics and Nematode Density in Soil
[image:3.595.58.287.346.587.2]Table 2. (a) Physical characteristics of rural and urban soils; (b) Physical characteristics of rural and urban soils. (a)
pH Conductivity
(mho/cm)
Temperature (˚C)
St.No. Pre- monsoon
season
Monsoon season
Post- monsoon
season
Pre- monsoon
season
Monsoon season
Post- monsoon
season
Pre- Monsoon
season
Monsoon season
Post monsoon
season
S1 7** 7.7** 7.1** 0.07** 0.049** 0.032** 32.6** 30** 31.5**
S2 5** 5.7** 5** 1.52 0.88** 0.463** 30 29.7 31
S3 5.7** 6.4** 6.3** 0.26** 0.15** 0.094** 32.5** 30** 31.5**
S4 6.1** 7.1** 6.5** 0.26** 0.082** 0.057** 31.6** 30** 31.48*
S5 5.3* 6* 5.5* 1.09** 0.245** 0.326** 29.9** 29** 31**
S6 4.7** 5** 4.9** 3.14** 1.35** 1.343** 31.1** 30** 31.4**
S7 6.2** 7.3** 6.7** 0.14** 0.072** 0.048** 33** 30** 31.4**
S8 5.4 6.2 5.9 0.44 0.225 0.211 29.5 29.8 31
S9 8.7** 8.3** 7.3** 0.06** 0.042** 0.028** 32.6** 30** 31.5**
S10 5.7 5.7** 5.3** 1.33** 0.528** 0.451** 32** 30** 31.3**
S11 5.7 6.3 6.2 0.27** 0.174** 0.099** 32.2** 30** 31.1
S12 6.1** 7.3** 6.7 0.25** 0.073** 0.049** 31.3** 30** 31.4**
S13 5.3** 6.2 5.7** 0.52** 0.225** 0.214** 32** 29.9 31.2**
S14 4.8** 5.3** 4.9** 1.6** 1.305** 0.865** 31* 30** 31.3**
S15 6.9** 7.5** 7* 0.07** 0.064** 0.04** 33** 30** 31.4**
S16 5.7 6.2 6 0.33 0.197 0.118 31.1 29.8 31
(b)
St.No. Pore Space (%) Water holding capacity (%) Bulk density (g/cc)
Pre-monsoon season
Monsoon season
Post-monsoon season
Pre-monsoon season
Monsoon season
Post-monsoon season
Pre-monsoon season
Monsoon season
Post-monsoon season
S1 57.8** 57.8** 57.8** 0.04** 0.05** 0.03** 1.56** 1.58** 1.57**
S2 30.19** 30.2** 30* 1.33** 1.34** 1.32** 0.71** 0.72** 0.71**
S3 38.32** 38.2** 38.1** 0.15 0.17** 0.15** 1.14** 1.14** 1.2
S4 40.12** 40.13** 40.1** 0.15** 0.15** 0.14** 1.23** 1.24** 1.23**
S5 30.28** 30.3** 30.2** 0.79** 0.75** 0.74** 0.5** 0.9** 0.9**
S6 25.43** 25.4** 25.3** 1.84** 1.87** 1.86** 0.2** 0.3** 0.3**
S7 45.25** 45.3** 44.9** 0.13 0.13** 0.11** 1.26** 1.25** 1.25**
S8 32.45 32 32 0.27 0.27 0.25 1.09 1.1 1.11
S9 58.87** 58.86** 58.84** 0.02** 0.03** 0.03** 1.58** 1.6** 1.6**
S10 30.19** 30.2** 30.1** 1.23** 1.25** 1.23** 0.8** 0.8** 0.78**
S11 35.45** 35.5** 35.2** 0.18** 0.2 0.2 1.11** 1.12 1.15**
S12 42.02** 42.1** 41.9** 0.13** 0.14** 0.12** 1.24** 1.25** 1.23**
S13 31.33** 31.34** 31.3** 0.54** 0.54** 0.51** 0.93** 1 0.97**
S14 29.26** 30** 30** 1.84** 1.84** 1.83** 0.3** 0.5** 0.46**
S15 48.3** 48.3** 48.19** 0.11** 0.12** 0.11** 1.28** 1.28** 1.28**
S16 35.09 35.1 34.8 0.25 0.26 0.23 1.11 1.1 1.11
Table 3. (a) Chemical characteristics of rural and urban soils; (b) Chemical characteristics of rural and urban soils. (a)
Chloride (mg/g) Moisture content (%) Organic matter (g %)
St.No. Pre-monsoon
season
Monsoon season
Post-monsoon season
Pre-monsoon season
Monsoon season
Post-monsoo n season
Pre-monsoon season
Monsoon season
Post-monsoon season
S1 0.34** 0.338** 0.339** 1.74** 1.81** 1.76** 0.517** 0.591** 0.569**
S2 0.046** 0.046** 0.045** 12.54** 12.6** 11.8** 3.034** 3.839** 3.836**
S3 0.053** 0.052** 0.052** 5.46** 5.55** 5.54** 1.569** 1.772** 1.765**
S4 0.045** 0.045 0.044** 4.78** 4.9** 4.9** 1.397** 1.626** 1.562**
S5 0.046** 0.046** 0.046** 9.42** 9.62** 9.62** 2.569** 3.696** 3.6**
S6 0.046** 0.047** 0.046** 15.17** 15.25** 15.11** 5.655** 5.769** 4.448**
S7 0.046** 0.044** 0.046** 2.38** 2.4** 2.36** 1.155** 1.579** 1.155**
S8 0.046 0.046 0.045 8.55 8.61 8.59 1.69 2.081 2.512
S9 0.41** 0.406** 0.407** 0.19** 0.22** 0.22** 0.345** 0.367** 0.335**
S10 0.047** 0.047** 0.046** 11.85** 11.9** 11.5** 2.672** 2.838** 3.836**
S11 0.046 0.046 0.045 6.79** 6.82** 6.76** 1.569** 1.94** 1.867**
S12 0.044** 0.044** 0.043** 2.7** 2.9** 2.9** 1.328** 1.688** 1.455**
S13 0.046** 0.046** 0.046 8.67** 8.69** 8.6 2.207** 2.491** 2.255**
S14 0.046** 0.047** 0.046** 13.3** 14** 13.6** 3.5** 3.881** 3.87**
S15 0.046** 0.045** 0.046** 2.35** 2.36** 2.29** 0.69** 0.909** 0.905**
S16 0.046 0.046 0.046** 8.06 8.1 8 1.69 2.081 2.41
(b)
o Total Phosphorus (g %) Total Potassium (g %)
St.No. Pre-monsoon
season
Monsoon season
Post-monsoon season
Pre-monsoon season
Monsoon season
Post-monsoon season
Pre-monsoon season
Monsoon season
Post-monsoon season
S1 24.5** 42** 12.6** 4.42** 3.75** 3.62** 66.52** 64.67** 25.6**
S2 63.1** 105** 182.7** 52.46** 89.82** 75.31** 189.73** 147.41** 106.1**
S3 44.8** 70** 132.3** 6.21** 30.56** 14.41** 125.45** 145.54** 99.33**
S4 43.5** 63** 119.7** 5.31** 27.68** 13.15** 106.25** 143.53** 90.3**
S5 59.6** 91** 157.5** 43.57** 64.11** 69.21** 163.39** 184.6** 100.7**
S6 70** 168** 252** 159.82** 106.43** 76.36** 189.73** 187.32** 155**
S7 30.1** 56** 107.1** 4.45** 7.86** 5.68** 83.48** 128.46** 60.2**
S8 49.2 77 144.9 25.76 44.64 41.65 133.04 168.86 102.88
S9 20.3** 42** 40.8** 3.53** 0.71** 0.78** 34.38 17.08** 25.59**
S10 61** 98** 182.7** 52.46** 66.07** 50.2** 174.55** 398.44** 301**
S11 47** 70 138.6** 10.67** 33.21** 16.41** 127.23 64.51** 102.34**
S12 35.4** 56** 107.1** 5.31** 14.64** 7.78** 85.27 43.53** 84.28**
S13 49.6** 77** 157.5** 40.09** 63.04** 67.95** 144.2** 178.35** 155**
S14 64.4** 154** 195.3** 159.82** 92.14** 75.52** 189.73** 434.82** 415.5**
S15 29.6** 49** 103.83** 4.45** 4.11** 2.73** 66.52 26.56** 52.68**
S16 47.6 70 144.9 12.46 41.96 27.24 130.8 85.38 106.86
[image:5.595.53.542.111.715.2]Table 4. (a) Heavy metal content in rural and urban soils; (b) Heavy metal content in rural and urban soils. (a)
Pb (mg/kg) Zn (mg/kg) Mn (mg/kg)
St.No. Pre-monsoon season
Monsoon season
Post-monson season
Pre-monsoon season
Monsoon season
Post-monsoon season
Pre-monsoon season
Monsoon season
Post-monsoo n season
S1 BDL BDL BDL 43.2 73.1 40.3 140 100.2 130.3
S2 0.6 0.3 0.44 70.2 352.1 245.4 105.2 310.5 310.6
S3 0.6 0.7 0.56 220.4 100.2 310.1 78.6 69.7 78.3
S4 0.9 0.6 0.76 510 220.9 535.4 401 225.6 512.6
S5 BDL BDL BDL 70.4 52.3 92.3 88.6 78.4 89.3
S6 0.6 0.6 0.4 90.1 70 186.5 111.4 142.5 127.9
S7 0.9 0.9 0.86 340.2 470.1 752 540.2 398.6 567
S8 BDL BDL BDL 75.4 40.4 72 70.3 63.2 70.2
S9 BDL BDL BDL 52.3 86 42 157.4 109.5 510
S10 0.8 0.3 0.4 69 314 252 146.4 152.3 152.1
S11 0.6 0.7 0.61 320 112.3 312.3 65.4 310.5 361.9
S12 0.6 0.6 0.7 360 216.9 502.9 512 213.9 509.4
S13 BDL BDL BDL 220 67.5 89.5 88.6 86.5 86.5
S14 0.4 0.5 0.38 98.1 72.7 182.9 115 152.3 138
S15 1 0.8 0.9 360.3 508 760.4 569.8 396.5 538
S16 BDL BDL BDL 74.4 52.3 77.1 78.6 68.6 65.8
(b)
Cu (mg/kg) Cr (mg/kg)
St.No.
Pre-monsoon season Monsoon season Post-monsoon season Pre-monsoon season Monsoon season Post-monsoon season
S1 19.2 18.7 20.5 0.2 BDL BDL
S2 90.4 70.6 88.5 0.3 0.2 0.26
S3 79.6 71.9 77.9 0.4 0.2 0.33
S4 78.2 74.7 75.0 0.4 0.4 0.4
S5 79.6 76.2 77.5 0.2 BDL 0.57
S6 80.3 98.4 99.8 0.2 0.3 0.28
S7 95.2 90.5 93.6 0.7 0.6 0.8
S8 90.2 88.1 89.2 BDL BDL 0.32
S9 20.2 18.9 20.0 0.2 BDL BDL
S10 92.6 89.8 90.6 0.4 0.3 0.28
S11 86.8 85.4 85.6 0.4 0.2 0.38
S12 82.2 81.2 82.0 0.3 0.3 0.38
S13 87.2 83.7 86.5 0.3 BDL 0.6
S14 95.6 93.3 94.3 0.3 0.3 0.26
S15 98.3 84.1 87.4 0.8 0.6 0.82
S16 88.2 83.3 85.3 0.20 BDL 0.31
[image:6.595.57.542.121.726.2]0 1 2 3 4 5 6 7 8 9 10 11 12 13 14 15 16 0 50 100 150 200 250 300 N em atode de ns it y ( N os /s q.m s oil) Sampling Stations
0 1 2 3 4 5 6 7 8 9 10 11 12 13 14 15 16
-200 0 200 400 600 800 1000 1200 1400 1600 1800 N e m a to de den si ty ( N o s /s q.m so il) Sampling Stations
(a) (b)
0 1 2 3 4 5 6 7 8 9 10 11 12 13 14 15 16
0 200 400 600 800 1000 Nem at ode dens it y ( Nos /s q. m s oi l) Sampling Stations (c)
Figure 2. Nematode abundance in the Soils of Study stations during different seasons. (a) Pre-monsoon season; (b) Monsoon season; (c) Post-monsoon season.
and S4 where the positive correlation was reverted back to very high.
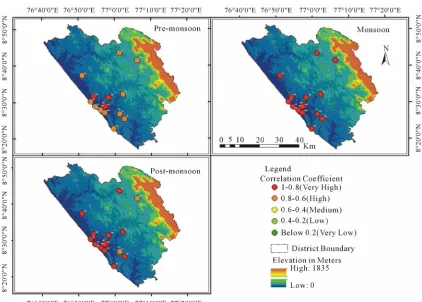
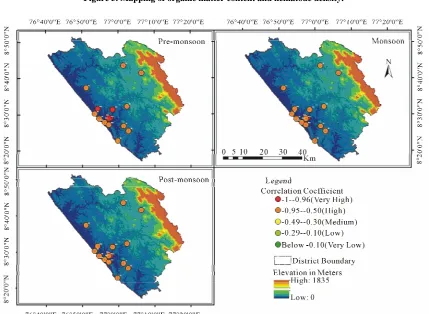
the study area showed significant and positive correlation with nematode density. Smiles (1988) [10] in his studies concluded that the rate of soil water movement controls many biological activities such as wilting and germina- tion of plants and hatching of nematode cysts and spores. The spatial variability of water holding capacity and ne- matode density during the pre-monsoon, monsoon and post monsoon seasons were plotted and the results are shown in Figure 3. Water holding capacity showed very
high positive correlation with nematode density during the pre monsoon season in all the stations. But in the monsoon season due to the dilution factor, this positive correlation was very high in most of the study stations except in the stations S1, S2, S3, S4 and S16 where this positive correlation was only high. In the post-monsoon season, this positive correlation showed the same pattern as that in the monsoon season except for the stations—S3
Moisture content in the soils of study stations showed a significant and positive correlation with nematode density. Townshend and Webber (1971) [11] showed that the movement and survival of nematodes was maximum in soils with maximum moisture retention. The spatial va- riability of moisture content and nematode density during the pre-monsoon, monsoon and post-monsoon seasons were plotted and the results are shown in Figure 4. Moi-
[image:7.595.67.526.77.489.2]
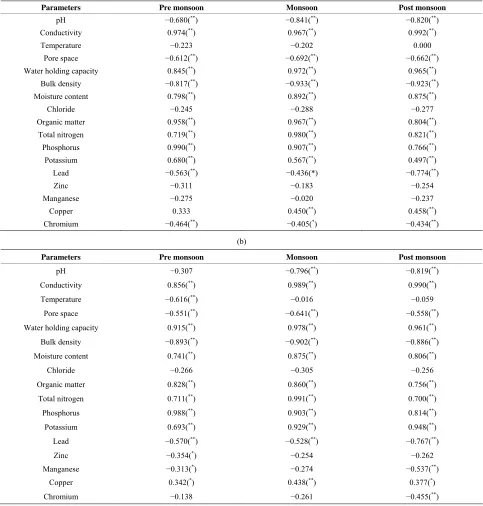
Table 5. (a) Correlation of nematode density with physico-chemical characteristics in rural area; (b) Correlation of nematode density with physico-chemical in urban area.
(a)
Parameters Pre monsoon Monsoon Post monsoon
pH −0.680(**) −0.841(**) −0.820(**)
Conductivity 0.974(**) 0.967(**) 0.992(**)
Temperature −0.223 −0.202 0.000
Pore space −0.612(**) −0.692(**) −0.662(**)
Water holding capacity 0.845(**) 0.972(**) 0.965(**)
Bulk density −0.817(**) −0.933(**) −0.923(**)
Moisture content 0.798(**) 0.892(**) 0.875(**)
Chloride −0.245 −0.288 −0.277
Organic matter 0.958(**) 0.967(**) 0.804(**)
Total nitrogen 0.719(**) 0.980(**) 0.821(**)
Phosphorus 0.990(**) 0.907(**) 0.766(**)
Potassium 0.680(**) 0.567(**) 0.497(**)
Lead −0.563(**) −0.436(*) −0.774(**)
Zinc −0.311 −0.183 −0.254
Manganese −0.275 −0.020 −0.237
Copper 0.333 0.450(**) 0.458(**)
Chromium −0.464(**) −0.405(*) −0.434(**)
(b)
Parameters Pre monsoon Monsoon Post monsoon
pH −0.307 −0.796(**) −0.819(**)
Conductivity 0.856(**) 0.989(**) 0.990(**)
Temperature −0.616(**) −0.016 −0.059
Pore space −0.551(**) −0.641(**) −0.558(**)
Water holding capacity 0.915(**) 0.978(**) 0.961(**)
Bulk density −0.893(**) −0.902(**) −0.886(**)
Moisture content 0.741(**) 0.875(**) 0.806(**)
Chloride −0.266 −0.305 −0.256
Organic matter 0.828(**) 0.860(**) 0.756(**)
Total nitrogen 0.711(**) 0.991(**) 0.700(**)
Phosphorus 0.988(**) 0.903(**) 0.814(**)
Potassium 0.693(**) 0.929(**) 0.948(**)
Lead −0.570(**) −0.528(**) −0.767(**)
Zinc −0.354(*) −0.254 −0.262
Manganese −0.313(*) −0.274 −0.537(**)
Copper 0.342(*) 0.438(**) 0.377(*)
[image:8.595.56.539.126.632.2]Chromium −0.138 −0.261 −0.455(**)
Table 6. Significance level of correlation coefficient.
Range Significance
0.00 - 0.200 Negligible
0.200 - 0.400 Low
0.400 - 0.600 Moderate 0.600 - 0.800 Substantial
0.800 - 1.00 Very high
tion showed the same pattern as that in the monsoon sea- son except for the stations, S7 and S8 where the positive correlation was high.
Organic matter content in the soils of study stations showed a significant and positive correlation with nematode density. This is in agreement with the studies by Gorres
et al. (1998) [12] which showed that the soils rich in orga-
[image:8.595.60.285.658.736.2]Figure 3. Mapping of water holding capacity and nematode density.
[image:9.595.87.509.415.717.2]The spatial variability of organic matter content and ne- matode density during the pre monsoon, monsoon and post monsoon seasons were plotted and the results are shown in Figure 5. Organic matter content showed very
high positive correlation with nematode density during the pre monsoon and monsoon seasons in all the stations. In the post monsoon season, this positive correlation showed the same pattern as that in the pre monsoon and monsoon seasons except for the stations, S7 and S9 where the positive correlation was high.
3.4. Mapping of Significantly Negatively Correlated Physico-Chemical
Characteristics and Nematode Density in Soil
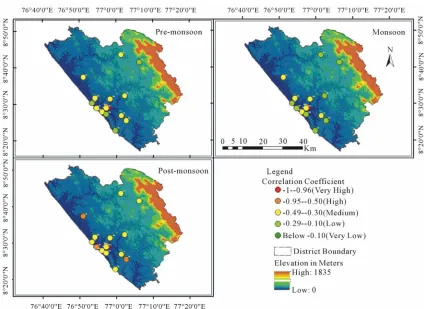
There is a significant and negative correlation between soil pH and nematode density. This is in agreement with the studies conducted by Murialdo et al. (2002) [13] which
showed that when the soil pH was high, nematode den- sity was low. The spatial variability of pH content in soil and nematode density during the pre monsoon, monsoon and post monsoon seasons were plotted and the results are shown in Figure 6. Soil pH showed very high nega-
tive correlation with nematode density during the pre monsoon season in stations, S13, S11, S12, S14 and S15. But in the monsoon season due to the dilution factor, this negative correlation was reduced. In the post monsoon season, the correlation showed the same pattern as that in the monsoon season.
Zinc content in the soils of study stations showed a sig- nificant and negative correlation with nematode density. Studies by Shao et al. (2008) [14] showed that nematode
densities were negatively correlated with zinc concentra- tions as their population densities decreased with in- creased zinc concentrations. The spatial variability of zinc content and nematode density during the pre mon- soon, monsoon and post monsoon seasons were plotted and the results are shown in Figure 7. Zinc content
showed high negative correlation with nematode density during the pre monsoon season in the stations, S10, S11, S12 and S13. Due to the dilution factor in the monsoon season, this negative correlation was reduced in all the stations. But this negative correlation was very high in the stations, S14 and S15 in the monsoon season. The effect of raised water holding capacity and moisture con- tent in the monsoon season influenced the soils in the station, S14 resulting in very high negative correlation. In the station, S15 the retention of zinc content in soil will be more due to the dilution factor resulting in the high negative correlation with nematode density. But in the post monsoon season due to the less water content in these soils, the negative correlation will be lesser.
Manganese content in the soils of study stations show- ed a significant and negative correlation with nematode den-
sity. Studies by Norton and Hoffmann (1974) [15] had shown that a negative correlation was observed between manganese content and egg/cyst ratio of nematodes which in turn will be reflected in their population densi- ties. The spatial variability of manganese content in the soils and nematode density during the pre monsoon, monsoon and post monsoon seasons were plotted and the results are shown in Figure 8. Manganese content in
soils showed the same negative correlation pattern with nematode density in both the pre monsoon and monsoon seasons. But in the post monsoon season, this negative correlation was very high in the station, S14 as these clayey soils were with less water content at this season as compared to that in the monsoon season and will aug- ment the manganese content in soils. This is in agree- ment with the studies conducted by Rajmohan and Elan- go (2005) [16] which concluded that soils with high clay content will retain more manganese especially in the post monsoon season. In stations, S4, S6 and S9, the negative correlation was high. In station, S6 with high clay con- tent in soils, the manganese retention will be more in this season. As S6 is a rural market area and S14 is an urban market area, the manganese contamination will be more in the urban market area due to different anthropogenic activities compared to the corresponding rural area. So station, S6 showed only high level of correlation with ne- matode density in the post monsoon season. In station, S4 which is a road-side area, the manganese deposition will be more in the post monsoon season. Previous stud- ies by Singh and Singh (2006) [17] had shown that the manganese deposition in soils will be more in the post monsoon season in the road-side soils in India. Station, S9 which is an urban coastal area, this negative correla- tion will be more due to the hyper saline nature of these soils. This is in agreement with the studies by Alongi et al. (2005) [18] which showed that hyper saline soils will
retain more manganese content in soils during the post monsoon season.
4. Conclusion
Figure 5. Mapping of organic matter content and nematode density.
Figure 7. Mapping of zinc content and nematode density.
[image:12.595.85.509.413.722.2]soils with the same land use patterns. Also the urban area soils were prone to more heavy metal contamination than the rural area soils especially in the gasoline station and roadside areas of Thiruvananthapuram District. This will reduce the soil microbial activity and soil health which in turn will be reflected in the crop production. This soil qua- lity mapping provides a basis for identifying such tension zones and serves as a triggering mechanism for imple- mentation of mitigating strategies.
5. Acknowledgements
The authors sincerely thank Prof. M.S. Rajasree, Director, Indian Institute of Information Technology, TechnoPark, Thiruvananthapuram for providing facilities to conduct the spatial studies. Also extend sincere thanks to Mr. Vi- shnu, Project Fellow, Indian Institute of Information Te- chnology, Thiruvananthapuram for the help rendered in doing the spatial analysis.
REFERENCES
[1] B. J. Alloway, “Pollution-Causes, Effects and Control,” 3rd Edition, The Royal Society of Chemistry Publishers, Cambridge, 1996.
[2] J. V. Tarazona, M. D. Fernández and M. M. Vega, “Re- gulation of Contaminated Soils in Spain e a New Legal Instrument,” Journal of Soils Sediments, Vol. 5, No. 3, 2005, pp. 121-124.
[3] M. J. Fortin and M. Dale, “Spatial Analysis—A Guide for Ecologists,” The Edinburgh Building, Published by Cam- bridge University, Cambridge, 2005.
[4] P. K. Gupta, “Soil, Plant, Water and Fertiliser Analysis,” Agro Botanica Publishers and Distributors, New Delhi, 1999, p. 438.
[5] N. N. Saxena, “Environmental Analysis of Water, Soil and Air,” Agro Botanical Publishers, 1994.
[6] G. B. Korte, “The GIS Book,” 5th Edition, SAN 694- 0269, On Word Press Publishers, 2001.
[7] N. A. Cobb, “Notes on Nematology,” Controlled Science Nematology, Vol. 5, No. 5, 1917, pp. 117-128.
[8] T. R. E. Southwood and P. A. Henderson Ecological Me- thods,” Published by Blackwell Science Ltd., London, 2000, pp. 218-240.
[9] J. B. Goodey, “Laboratory Methods for Work with Plant and Soil Nematodes, Technical Bulletin No.2, Ministry of Agriculture, Fisheries and Food,” Nematology Depart- ment, Rothamsted Experimental Station, Harpenden, Herts, London, 1963, pp. 21-22.
[10] D. E. Smiles, “Aspects of the Physical Environment of Soil Organisms,” Biology and Fertility of Soils, Vol. 6, No. 3, 1988, pp. 204-215.
[11] J. L. Townshend and L. R. Webber, “Movement of Praty- lenchuspenetrans and the Moisture Characteristics of Three Ontario Soils,” Nematologica, Vol. 17, No. 1, 1971, pp. 47-57. http://dx.doi.org/10.1163/187529271X00404 [12] J. F. Gorres, M. J. Dichiaro, J. B. Lyons and J. A. Ama-
dor, “Spatial and Temporal Patterns of Soil Biological Activity in a Forest and an Old Field,” Soil Biological Bi- ochemistry, Vol. 30, No. 2, 1998, pp. 219-230.
[13] S. E. Murialdo, M. G. Fuertes, J. F. Gonza’lez and E. Chavez, “Nematodes as Indicators of Wetland Pollution,” Journal of Environmental Biology, Vol. 23, No. 4, 2002, pp. 423-428.
[14] Y. Shao, W. Zhang, J. Shen, L. Zhou, H. Xia, W. Shu, H. Ferris and S. Fu, “Nematodes as Indicators of Soil Reco- very in Tailings of a Lead/Zinc Mine,” Soil Biological Biochemistry, Vol. 40, No. 2, 2008, pp. 2040-2046. [15] D. C. Norton and J. K. Hoffmann, “Distribution of Select-
ed Plant Parasitic Nematodes Relative to Vegetation and Edaphic Factors,” Journal of Nematology, Vol. 6, No. 1, 1974, pp. 81-86.
[16] N. Rajmohan and L. Elango, “Distribution of Iron, Man- ganese, Zinc and Atrazine in Groundwater in Parts of Pa- lar and Cheyyar River Basins, South India,” Journal of Environmental and Monitoring Assessment, Vol. 107, No. 1-3, 2005, pp. 115-131.
http://dx.doi.org/10.1007/s10661-005-5307-0
[17] A. K. Singh and M. Singh, “Lead Decline in the Indian Environment Resulting from the Petrol-Lead Phase-Out Programme,” Science Total Environment, Vol. 368, No. 2-3, 2006, pp. 686-694.
http://dx.doi.org/10.1016/j.scitotenv.2006.04.013
[18] D. M. Alongi, A. L. Ramanathan, L. Kannan, F. Tirendi, L. A. Trott and M. Bala Krishna Prasad, “Influence of Human-Induced Disturbance on Benthic Microbial Meta- bolism in the Pichavaram Mangroves, Vellar-Coleroon Estuarine Complex, India,” Marine Biology, Vol. 147, No. 4, 2005, pp. 1033-1044.