Munich Personal RePEc Archive
Bank credit, trade credit or no credit:
Evidence from the Surveys of Small
Business Finances
Cole, Rebel
DePaul University
15 March 2010
Bank Credit, Trade Credit or No Credit:
Evidence from the Surveys of Small Business Finances
Rebel A. Cole DePaul University Chicago, IL 60404 rcole@depaul.edu
Abstract:
In this study, we use data from the SSBFs to provide new information about the use of credit by small businesses in the U.S. More specifically, we first analyze firms that do and do not use credit; and then analyze why some firms use trade credit while others use bank credit. We find that one in five small firms uses no credit, one in five uses trade credit only, one in five uses bank credit only, and two in five use both bank credit and trade credit. These results are
consistent across the three SSBFs we examine—1993, 1998 and 2003.
When compared to firms that use credit, we find that firms using no credit are
significantly smaller, more profitable, more liquid and of better credit quality; but hold fewer tangible assets. We also find that firms using no credit are more likely to be found in the services industries and in the wholesale and retail-trade industries. In general, these findings are
consistent with the pecking-order theory of firm capital structure.
Firms that use trade credit are larger, more liquid, of worse credit quality, and less likely to be a firm that primarily provides services. Among firms that use trade credit, the amount used as a percentage of assets is positively related to liquidity and negatively related to credit quality and is lower at firms that primarily provide services. In general, these results are consistent with the financing-advantage theory of trade credit.
Firms that use bank credit are larger, less profitable, less liquid and more opaque as measured by firm age, i.e., younger. Among firms that use bank credit, the amount used as a percentage of assets is positively related to firm liquidity and to firm opacity as measured by firm age. Again, these results are generally consistent with the pecking-order theory of capital
structure, but with some notable exceptions.
We contribute to the literature on the availability of credit in at least two important ways. First, we provide the first rigorous analysis of the differences between small U.S. firms that do and do not use credit. Second, for those small U.S. firms that do participate in the credit markets, we provide new evidence regarding factors that determine their use of trade credit and of bank credit, and whether these two types of credit are substitutes (Meltzer, 1960) or
complements (Burkart and Ellingsen, 2004). Our evidence strongly suggests that they are complements.
Key words: availability of credit, bank credit, capital structure, entrepreneurship, relationships, small business, SSBF, trade credit
JEL classifications: G21, G32, J71, L11, M13
Bank Credit, Trade Credit or No Credit:
Evidence from the Surveys of Small Business Finances
1. Introduction
Among small businesses, who uses credit? Among those that use credit, from where do
they obtain funding—from their suppliers, i.e., trade credit, from their financial institutions, i.e.,
bank credit, or from both? The answers to these questions are of great importance not only to the
small firms themselves, but also to prospective lenders to these firms and to policymakers
interested in the financial health of these firms.1
The availability of credit is one of the most fundamental issues facing a small business
and therefore, has received much attention in the academic literature (See, for example, Petersen
and Rajan, 1994, 1997; Berger and Udell, 1995, 2006; Cole, 1998; Cole, Goldberg and White,
2004; and Cole 2008, 2009). However, many small firms—as many as one in four, according to
data from the 2003 Survey of Small Business Finances—indicate that they do not use any credit
whatsoever. We refer to these firms as “non-borrowers.” These firms have received virtually no
attention from academic researchers.
Both theory dating back to Schumpeter (1934)2 and more recent empirical research (e.g.,
King and Levine, 1993a, 1993b; Rajan and Zingales, 1998) indicate that firms using little or no
debt will be capital-constrained and, as a consequence, will grow more slowly, hire fewer
workers and make fewer productive investments than firms utilizing debt in their capital
structure. A better understanding of these firms should provide policymakers with guidance in
how to tailor economic and tax policies to help small businesses obtain credit when they need
1
Data from the Federal Reserve Board’s Surveys of Small Business Finances indicate that about one third of all small-business debt is in the form of trade credit, about the same portion as is obtained from commercial banks. See, e.g., Robb (2002).
2
credit, thereby increasing both employment and GDP.
In this study, we first analyze firms that do and do not use credit, i.e., leveraged and
unleveraged firms; and then analyze how firms that do use credit (leveraged firms) allocate their
liabilities between bank credit (obtained from financial institutions) and trade credit (obtained
from suppliers), in order to shed new light upon these critically important issues. We utilize data
from the Federal Reserve Board’s 1993, 1998 and 2003 Surveys of Small Business Finances
(hereafter “SSBFs”)—a series of nationally representative samples of small U.S. businesses—to
estimate a Heckman selection model, where the manager of a firm first decides if it needs credit,
and then decides from where to obtain this credit—from financial institutions (in the form of
bank credit) or from suppliers (in the form of trade credit).
We find that one in five small firms uses no credit, one in five uses trade credit only, one
in five uses bank credit only, and two in five use both bank credit and trade credit. From these
results it is clear that trade credit is more than just a substitute for bank credit, as 40 percent of
small businesses use both types of credit simultaneously. These results are consistent across the
three SSBFs we examine—1993, 1998 and 2003.
When compared to firms that use credit, we find that non-borrowers are significantly
smaller, more profitable, more liquid and of better credit quality; but hold fewer tangible assets.
We also find that non-borrowers are more likely to be found in the services industries and in the
wholesale and retail-trade industries. In general, these findings are consistent with the
pecking-order theory of firm capital structure.
Firms that use trade credit are larger, more liquid, of worse credit quality, and less likely
to be a firm that primarily provides services. Among firms that use trade credit, the amount of
related to credit quality and is lower at firms that primarily provide services. In general, these
results are consistent with the financing-advantage theory of trade credit.
Firms that use bank credit are larger, less profitable, less liquid and younger. Among
these firms, the amount of bank credit used (as a percentage of assets) is positively related to
firm liquidity and to firm opacity as measured by firm age. Again, these results are generally
consistent with the pecking-order theory of capital structure, but with some notable exceptions.
The amount of bank credit used is positively related to profitability and negatively related to
tangibility of assets, both in contradiction to the pecking-order theory.
Why is this analysis of importance? According to the U.S. Department of Treasury and
Internal Revenue Service, there were more than 23 million nonfarm sole proprietorships, more
than 2 million partnerships with less than $1 million in assets and more than 5 million
corporations with less than $1 million in assets that filed tax returns for 2006.3 Small firms are
vital to the U.S. economy. According to the U.S. Small Business Administration, small
businesses account for half of all U.S. private-sector employment and produced 64% of net job
growth in the U.S. between 1993 and 2008.4 Therefore, a better understanding of who uses credit
and from where they obtain financing can help policymakers to take actions that will lead to
more jobs and faster economic growth.
We contribute to the literature on the availability of credit in at least two important ways.
3
See the U.S. Internal Revenue Service statistics for nonfarm sole proprietorships at
http://www.irs.gov/taxstats/indtaxstats/article/0,,id=134481,00.html, for partnerships at
http://www.irs.gov/taxstats/bustaxstats/article/0,,id=97153,00.html, and for corporations at
http://www.irs.gov/taxstats/bustaxstats/article/0,,id=97145,00.html. The year 2006 is used for reference because it was the latest year for which statistics were available at the time this article was written.
First, we document that one in five small U.S. firms uses no bank credit or trade credit, and
provide the first rigorous analysis of the differences in these firms and other small U.S. firms that
do use credit.5 A better understanding of why one in five small U.S. firms uses no credit should
provide both academics and policymakers with new insights into why these firms choose not to
participate in the credit markets, and what the economic and financial consequences are for such
firms. Our new evidence also should provide guidance to policymakers regarding how to tailor
economic and tax policies as well as regulations to encourage unleveraged firms that are credit
constrained to enter the credit markets.
Second, for those small U.S. firms that do participate in the credit markets, we provide
new evidence regarding factors that determine their use of and trade credit and of bank credit,
and whether these two types of credit are substitutes (Meltzer, 1960) or complements (Burkart
and Ellingsen, 2004). Our evidence strongly suggests that they are complements, as two in five
small U.S. firms consistently use credit of both types. This is not surprising because trade credit
is primarily short-term whereas bank credit is typically longer-term.
This new evidence contributes to the literature on trade credit, especially to the body of
evidence regarding the validity of the financing-advantage theory of trade credit (Petersen and
Rajan, 1997). This evidence has important implications for the Federal Reserve as it conducts
monetary policy because trade credit can confound changes in monetary policy, depending upon
whether firms increase or decrease their reliance upon trade credit when money is tight (Meltzer
1960).
5
2. Review of the Literature
2.1 Availability of Credit to Small Businesses
The issue of availability of credit to small businesses has been studied by financial
economists for at least sixty years, dating back at least to Wendt (1947), who examines the
availability of loans to small businesses in California. Since then, scores of articles have
addressed this issue. We will limit our review of the literature to the most prominent studies
using SSBF data that have appeared in the financial economics literature during the past two
decades.
A large body of research has developed around the seminal work of Petersen and Rajan
(1994), who were the first to analyze credit availability using data from the SSBF. This research
has focused on the importance of firm-lender relationships in the allocation of credit. Because of
the relative opacity of small firms, those firms with stronger relationships with their prospective
lenders are more likely to receive credit. Petersen and Rajan (1994) use data from the 1987 SSBF
to find that close ties with creditors lead to greater availability of credit at lower rates of interest.
Berger and Udell (1995) were the first to extend Petersen and Rajan, also using data from
the 1987 SSBF. These authors focus their analysis only on lines of credit, a type of lending
where relationships should be especially important. They find that loan rates are lower when
firms have longer pre-existing relationships.
Cole (1998) was the first published study to analyze data from the 1993 SSBF. He
focuses on the lender’s decision whether or not to extend credit rather than on the rate charged
by the lender, and finds that it is the existence, rather than the length, of the firm-lender
relationship that affects the likelihood a lender will extend credit.
Two other recent articles using the SSBF data to analyze credit to small businesses are
especially relevant to the proposed study. Cole (2008) analyzes the determinants of capital
structure at small U.S. businesses, testing the two major competing theories of capital structure
(the pecking-order and static trade-off theories). His results are broadly supportive of the
pecking-order theory, in that leverage is negatively related to firm size, age, profitability and
credit quality and positively related to tangibility and limited liability. However, he provides no
evidence on the subset of small businesses that choose not to use credit.
Cole (2009) analyzes firms that choose whether or not to apply for credit based upon
their most recent loan application during the previous three years, and then whether or not the
firms were successful in obtaining credit. He finds that firms that choose not to apply for credit
are very similar to firms that do apply for and do obtain credit, and that both groups are very
different from firms that apply for and are denied credit. While this study appears to be very
similar to the proposed study, in fact, it is not. Cole (2009) also finds that the average firm that
chose not to apply for credit reported allocating 62 percent of its assets to debt rather than equity.
In other words, these firms use credit and appear to have reached their target capital structure,
which explains why they did not apply for additional debt. In our proposed study, we will
analyze the subset of firms that choose zero as their ratio of debt to assets.
2.2 Use of Trade Credit by Small Businesses
Trade credit also is an important source of funding for small businesses. In general, trade
why it remains a pervasive source of financing for small businesses.6 In their seminal article on
trade credit, Petersen and Rajan (1997) list and summarize three broad groupings of theories of
trade credit: financing advantage, price discrimination and transaction costs.
According to the transactions-cost theory, which dates back to Ferris (1981), trade credit
reduces the costs of paying a supplier for multiple deliveries by cumulating the financial
obligations from these deliveries into a single monthly or quarterly payment. By separating the
payment from the delivery, this arrangement enables the firm to separate the uncertain delivery
schedule from what can now be a more predictable payment cycle. This enables the firm to
manage its inventory more efficiently.
According to the financing-advantage theory, a supplier of trade credit has an
informational advantage over a bank lender in assessing and monitoring the creditworthiness of
its customers, which, in turn, gives the supplier a cost advantage in lending to its customers. The
supplier also has a cost advantage in repossessing and reselling assets of its customers in the
event of default (Mian and Smith, 1992). Smith (1987) argues that, by delaying payment via
trade credit, customers can verify the quality of the supplier’s product before paying for that
product. In a theoretical paper, Biais and Gollier (1997) assume that suppliers have private
information about their customer and demonstrate that trade credit alleviates information
asymmetries that otherwise would preclude financing of positive NPV projects. According to
Burkart and Ellingsen (2004), the information advantage derives from the transaction by which
the supplier provides inputs to its customer, in that cash is easily diverted but input supplies are
not. In addition, this may boost investment, leading banks to increase their lending to the
6
customer, as well. Hence, trade credit can be a complement to bank credit.
According to the price-discrimination theory, which dates back to Meltzer (1960), a
supplier uses trade credit to price discriminate among its customers. Creditworthy customers will
pay promptly so as to get any available discounts while risky customers will find the price of
trade credit to be attractive relative to other options. The supplier also discriminates in favor of
the risky firm because the supplier holds an implicit equity stake in the customer, equal to the
present value of future profits from sales to the customer, and wants to protect that equity
position by extending temporary short-term financing. Meltzer (1960) concludes that trade
creditors redistribute traditional bank credit during periods of tight money, so that trade credit
serves as a substitute for bank credit when money is tight. Nilsen (2002) provides strong
empirical support for Meltzer’s conclusions, as well as supporting the existence of a “bank
lending channel” for the transmission of monetary policy.7
One version of the price-discrimination theory posits that trade creditors are more lenient
than bank lenders when a firm encounters financial distress, so that riskier firms will allocate a
larger share of their borrowing to trade creditors in exchange for the financial flexibility they
obtain in the event that they become distressed. Suppliers have what amounts to an equity stake
in the firms to which they lend and, therefore, are more accommodating to their customers when
the customers encounter financial problems. Bank lenders, on the other hand, are more likely to
be secured by collateral and hold claims that are senior to those of trade creditors, so they are
more likely to pursue liquidation in the event of default than are trade creditors (Berger and
Udell, 1998). Huyghebaert, Van de Gucht and Van Hulle (2007) provide empirical evidence in
support of this theory, finding that Belgian firms in industries with high historical failure rates
7
and high liquidation values use more trade credit that other Belgian firms.
Petersen and Rajan (1997) use data from the 1987 SSBF to find that the information
provided by banking relationships does not appear to affect the amount of trade credit offered by
suppliers, which they interpret as supportive of the financing-advantage theory that suppliers
collect and use different private information about their customers than do financial institutions.
Petersen and Rajan also find that small U.S. firms with longer banking relationships hold lower
levels of accounts payable than other firms, while firms in metropolitan areas with few financial
institutions held higher levels of accounts payable than firms in other metropolitan areas. They
interpret their results as evidence that trade credit falls below bank credit in the pecking order of
capital structure, consistent with Meltzer (1960).
Fisman and Love (2003) extend this line of research by examining small firms in
countries with less developed financial markets and find that “firms in industries with higher
rates of accounts payable exhibit higher rates of growth.” Love, Preve and Sarria-Allende (2007)
find that trade credit in Asian countries fell for several years following the 1997 Asian financial
crisis. They interpret their evidence as consistent with a redistribution view of trade credit,
whereby financially strong firms redistribute bank credit to financially weak firms.
Ng, Smith and Smith (1999) contradict Meltzer’s bank-substitute theory but support
Ferris’ transaction-cost theory with evidence based upon a survey of credit managers at publicly
traded U.S. firms listed on CompuStat. They conclude that “credit terms are stable over time”
and that firms “do not respond to fluctuations in market demand” but that there is “wide variation
across industries in credit terms, but little variation within industries.”
Cuñat (2007) argues that trade creditors have an advantage over bank creditors in
supplies to the borrower so long as switching suppliers is costly. This advantage enables trade
creditors to lend more than banks are willing to lend. In this sense, trade credit is a complement
rather than a substitute for bank credit, and firms should be expected to utilize both types of
credit even when banking markets are competitive. However, this relationship also will lead
trade creditors to provide liquidity to borrowers that are facing temporary liquidity problems and
at increased level of financial distress. Cuñat uses panel data on U.K. firms from the
FAME-Bureau Van Dijk database to test his model.
3. Data
To conduct this study, we use data from the Federal Reserve Board’s 1993, 1998 and
2003 Surveys of Small Business Finances.8 In each survey, the firms surveyed constitute a
nationally representative sample of small businesses operating in the U.S. as of year-end prior to
the survey, where a small business is defined as a non-financial, non-farm enterprise employing
fewer than 500 employees. The 1993 (1998) survey data are broadly representative of
approximately five million firms operating in the U.S. as of year-end 1993 (1998) while the 2003
survey data are broadly representative of approximately six million firms operating in the U.S. as
of year-end 2003.
The SSBF provides detailed information about each firm's sources of financing as well as
information about each firm’s balance sheet, either of which can be used to determine whether or
not a firm uses trade credit and/or bank credit. We choose to used the detailed information about
financing sources rather than rely upon the balance-sheet data. Specifically, each SSBF includes
8
a question asking whether or not the firm used trade credit in the reference year of the survey,
and asking whether or not the firm had any outstanding bank credit in the reference year of the
survey. We use the answers to these questions to classify a firm as using no credit, using trade
credit only, using bank credit only, or using both bank credit and trade credit.
Specifically, we classify a firm as “using trade credit” if the firm reported that it did use
trade credit in the reference year of the survey.9 We classify a firm as “using bank credit” if the
firm reported that it had any loans outstanding in the reference year of the survey.10 We classify
a firm as “using no credit” if the firm reported that it used no trade credit and that it used no bank
credit during the reference year. Similarly, we classify a firm as “using both bank credit and
trade credit” if it reported that it used both bank credit and used trade credit.
We calculate the amount of bank credit from the outstanding balances reported by the
firm for each type of loan. We are forced to estimate the amount of trade credit from the amount
of accounts payable because the questionnaire does not ask the firm to report this amount.
For firms obtaining credit, the SSBF provides information on the identity and
characteristics of the lender through a series of questions about the firm’s use of financial
services, including lines of credit, mortgage loans, equipment loans, motor vehicle loans and
other loans. For each type of loan, the SSBF identifies the amount of the loan and the type of
9
In the 2998 and 2003 SSBFs, the firm was asked “During [YEAR], did [FIRM] make any purchases of goods or services from suppliers on account rather than pay before or at the time of the delivery?” In 1993, the question was slightly different: “Did the firm purchase any goods or services on account during 1993 rather than pay for the purchases before or at the time of delivery?
10
institution extending the credit.11
The survey data also provide information on each firm’s balance sheet and income
statement; its credit history; the firm's characteristics, including standard industrial classification
(SIC), organizational form, and age; and demographic characteristics of each firm's primary
owner, including age, education, experience, and credit history. Balance-sheet and
income-statement data are derived from the enterprise's year-end financial income-statements. Credit history,
firm characteristics, and demographic characteristics of each firm's primary owner are taken as of
year-end.
4. Methodology
In order to provide new evidence on who uses credit and from where, we employ both
univariate and multivariate tests. In all of our tests, we employ the survey sampling weights
because the SSBFs do not consist of random samples; rather, they are stratified random samples,
where large and minority-owned firms are over-represented relative to smaller and white-owned
firms.
First, as described above, we classify firms into one of four categories of borrower type
based upon their responses to questions regarding the structure of their liabilities. Use No Credit
firms are those firms that reported using no bank credit and using no trade credit; Use Credit
firms are those firms that reported using either or both types of credit.
11
The 2003 SSBF includes questions that ask the respondent to identify the type of institution or source for each financial service it obtains, including all loans. The categories are:
Once we have classified our sample firms, we calculate descriptive statistics for Use No
Credit firms and Use Credit firms, and then test for significant differences in these two types of
firms. For Use Credit firms, we also provide descriptive statistics on use of the two different
sources of credit, e.g., trade credit and bank credit.
We also conduct multivariate tests on the data. First, we use a weighted univariate probit
regression model to test hypotheses about differences in the Use Credit firms and Use No Credit
firms.
borrower type = f (firm characteristics, owner characteristics) (1A)
where:
borrower type is equal to one if the firm is a use credit firm and equal to zero if the
firm is a use no credit firm, as defined above;
firm characteristics is a vector of variables related to the firm that are expected to
influence availability of credit, such as credit history, size, profitability, age, leverage,
etc.; and
owner characteristics is a vector of variables related to the primary owner that are
expected to influence availability of credit, such as age, education, race, ethnicity and
gender.
These tests provide the first comprehensive and rigid statistical evidence on how these two
groups of firms differ.
Third, we use equation 1A as the first equation in bivariate-probit selection model (see
is a model of whether the firm used trade credit (equation 2A) or an model of whether the firm
used bank credit (equation 2B):12
use trade credit = f (firm characteristics, owner characteristics) (2A)
where:
use trade credit is equal to one if the firm uses trade credit and equal to zero otherwise.
use bank credit = f (firm characteristics, owner characteristics) (2B)
where:
use bank credit is equal to one if the firm uses bank credit and equal to zero otherwise.
This selection model is an extension of the bivariate probit model, which itself is an
extension of the univariate probit model. We use a probit model because our dependent variables
are binary (i.e., they take on a value of zero or one), so that ordinary least squares is
inappropriate. We use a bivariate probit selection model to estimate equations (2A) and (2B) in
order to account for a non-random selection mechanism operating on those firms that use trade
credit and on those firms that use bank credit. We cannot use the standard Heckman (1979)
selection model because the dependent variable in our second equation is binary; in Heckman’s
model, the dependent variable in the second equation is continuous and can be estimated by
weighted least squares. The bivariate probit model consists of two equations
y*1 = β1 ' x1 + є1, y1 = sign(y*1) (1)
and
y*2 = β2 ' x2 + є2, y2 = sign(y*2) (2)
12
where:
є1, є2 ~ Bivariate Normal(0,0,1,1,ρ)
In the bivariate probit selection model, [y1, x1] are only observed when y2 is equal to one, so the
error terms in equations (1) and (2) must be re-specified as єj = exp(γj , zj) uj, where [u1, u2] have
the bivariate standard normal distribution. The estimated correlation coefficient ρ (the correlation
between error terms є1 and є2) can be used to test for selection bias. If ρ is statistically significant,
then we can reject the null hypothesis that selection bias is not present.
Fourth, we use equations 2A and 2B as the first equation in the standard two-equation
Heckman sample-selection estimator estimated by the method of maximum likelihood, where the
second equation is a model of the percentage of assets allocated to trade credit (equation 3A) or
the percentage of assets allocated to bank credit (equation 3B):
trade credit percentage = f ( firm characteristics, owner characteristics) (3A)
where:
trade credit percentage is equal to the percentage of total assets allocated to trade credit;
bank credit percentage = f ( firm characteristics, owner characteristics) (3B)
where:
bank credit percentage is equal to the percentage of total assets allocated to bank credit.
For explanatory variables, we generally follow the existing literature on the availability
of credit and capital structure. We include a vector of firm characteristics that includes public
reputation as proxied by the log of firm age; firm size as measured by the log of sales; firm credit
obligations during the previous three years); firm profitability as measured by return on assets;
firm financial slack as proxied by the ratio of cash to total assets; firm current assets as measured
by the sum of accounts receivable, inventory and other current assets scaled by total assets; firm
tangible assets as measured by the sum of land and depreciable assets scaled by total assets; firm
governance as measured by percentage ownership of the primary owner and a dummy variable
for corporations; and firm industry as measured by a set of nine dummy variables for one- or
two-digit SIC code defining nine broad industries (construction, primary manufacturing,
secondary manufacturing, transportation, wholesale trade, retail trade, insurance and real estate,
business services and professional services).
A vector of owner characteristics includes the race (Asian or Black), ethnicity (Hispanic)
and gender (Female) as measured by dummy variables indicating that the firm’s primary owner
is Black, Hispanic, Asian and female, respectively; owner’s reputation as measured by the log of
Owner Age; owner’s business experience as measured by the number of years that the primary
owner has been an owner or manager of a business; dummy variables for the highest educational
attainment of the firm’s primary owner (High School Degree, Some College, College Degree or
Graduate Degree); owner credit quality as proxied by Owner Delinquency (whether or not the
primary owner has been delinquent on personal obligations). Table 1 presents a summary of the
variable definitions.
5. Hypotheses
5.1 Firms that Use Credit vs. Firms that Use No Credit
Our primary hypotheses relate to differences between firms that use credit and firms that
of potential explanatory variables, such as firm leverage and the outcome of the firm’s most
recent loan application, as these variables can only take on certain values when the firm uses
credit. However, there remain a large number of variables of interest that we can use to test our
hypotheses—many of which are tied to the pecking-order theory and trade-off theory of capital
structure.13
The pecking-order theory of capital structure suggests that profitable firms, firms with
more “financial slack,” and firms in certain industries that require little in the way of tangible
assets use less debt than other firms. Therefore, we expect that use no credit firms have higher
return on assets, have more cash (our proxy for financial slack), have fewer tangible assets and
are more likely to be in the service industries (insurance/real estate, business services and
professional services) than are use credit firms. Corporations enjoy limited liability and therefore
should be more likely to use credit, so we expect to find a positive relation between corporation
and use credit.
Behavior finance suggests that owners of use no credit firms act irrationally, as these
firms are failing to take advantage of either the interest-free financing from typical trade credit
terms or the debt-tax shield from bank financing, as well as the opportunity to leverage up their
return on equity.14 The managers of these firms may simply be financially unsophisticated, or
may have an irrational aversion to debt of any form and prefer to pay cash for all purchases.
Therefore, we hypothesize that use no credit firms are more likely to be minority-owned (Asian,
13 Cole (2008) explores in detail how the static trade-off and pecking-order theories of capital
structure explains the capital structure of small U.S. firms.
14
Black or Hispanic), located in rural areas, and have owners with less experience and less
education than other types of firms. (We measure education using a two dummy variables for
highest educational attainment—college and graduate.
5.2 Firms that Use Trade Credit and Firms that Use Bank Credit
Among firms reporting that they use credit, we also test hypotheses regarding the choice
between trade credit and what we will generically refer to as “bank credit,” which encompasses
all other sources of credit (see footnote 11 for a comprehensive list) but is dominated by credit
from banks and other financial institutions.
One version of the price-discrimination theory suggests that trade creditors are more
lenient in the event of default than are bank creditors, who tend to hold more secure positions in
liquidation largely due to collateralization. Therefore, we expect to find that variables indicating
worse credit quality are associated with higher allocations of total liabilities to trade credit. These
include the D&B credit score, the number of firm delinquencies, and the number of owner
delinquencies.
Petersen and Rajan (1997) hypothesize that trade creditors use information developed by
banks in evaluating customers for trade credit. They use two proxies for bank information to test
this hypothesis. First, the authors calculate the length of the firm’s longest bank relationship.
Second, they use information from the firms’ most recent loan application to construct a variable
indicating that the firm was denied credit. We also calculate these two variables and expect
negative relations with the use of trade credit.
Owners with greater private benefits of control should allocate more of their liabilities to
corporate governance literature in measuring the benefits of private control using the “wedge”
between ownership and control (see Claessens, Djankov and Lang (2000)). The larger is the
primary owner’s ownership percentage, the less he has to gain from self-dealing and perquisite
consumption. The logic of this measure follows from the seminal paper on agency costs and
ownership structure by Jensen and Meckling (1976), which is tested using small business data by
Ang, Cole and Lin (2000). When the primary owner owns 100% of the firm, each dollar of
perquisite consumption costs him one dollar, but as ownership falls to α, where 0% < α < 100%,
the primary owner’s cost fall to α times one dollar. In other words, the primary owner realizes
the full benefit of the perquisite consumption, but the cost of the perquisite consumption is only
his ownership percentage times the value of the perquisites. We hypothesize that the ownership
percentage should be negatively related to the use of any credit—bank or trade.
According to the financing-advantage theory, bank creditors are more likely than trade
creditors to liquidate a firm when liquidation value is greater than the value of the firm as a going
concern because they have a much smaller implicit equity stake in the firm. Therefore, we
hypothesize that firms with greater liquidation value will use more trade credit. We proxy the
value of assets in liquidation using the ratio of tangible assets to total assets, where tangible
assets are defined as the sum of land and depreciable assets. Alternatively, firms with more
tangible assets may prefer to finance them with credit of matched maturity, so that they prefer to
use more bank credit. If this is the case, then we expect tangible assets to have a negative
relation with the use of trade credit and a positive relation to the use of bank credit.
Owners of firms with greater growth opportunities have more to lose in liquidation than
other firms, as the present value of those growth opportunities is lost. Therefore, growth firms
the financing-advantage theory, trade creditors are expected to be more lenient to firms in
financial distress. We proxy growth opportunities using an indicator variable for growth is
positive defined as equal to one if the firm reports that its annual sales revenues had increased
from the prior period and equal to zero otherwise. We expect a negative relation between growth
is positive and both use credit and use bank credit but a positive relation with use trade credit.
According to Meltzer’s bank-substitute theory, the use of trade credit relative to bank
credit should be greater during times of tight money. By comparing statistics from the three
SSBFs, we should be able to shed some light on this theory, as the target Fed Fund rate varied
from 1.00% in 2003 to 3.00% in 1993 and a high of 5.50% during the first three quarters of
1998. Therefore, we expect to find the lowest percentage of assets allocated to trade credit in
2003 and the highest in 1998, with 1993 falling in between.
Petersen and Rajan (1997, p. 678) point out that the interest-free financing from typical
trade credit terms (2/10 net 30) “dominates paying cash,” so that one should “expect all firms to
borrow during the initial period.” Yet our survey data show that many firms do not borrow. We
hypothesize that firms in certain industries have little or no need for trade credit, such as those in
insurance/finance, business services and professional services, while others have very large
needs, such as those in construction and manufacturing. Firms in industries characterized by
large investments in tangible and depreciable assets, such as construction, manufacturing, and
6. Results
6.1 Univariate Results
Table 2 shows the distributions of firms from each of the three SSBFs into four
categories based upon whether or not the firm used trade credit or bank credit during the survey
year: no credit, trade credit only, bank credit only, and bank and trade credit. Interestingly, the
distributions are remarkably similar across the three surveys: roughly twenty percent of the firms
fall into each of the first three categories with the remaining forty percent falling into the bank
and trade credit category. In other words, one in five firms uses no credit, and roughly three out
of five firms use trade credit and three out of five firms use bank credit, but roughly one in five
firms uses bank credit but not trade credit and roughly one in five firms uses trade credit but not
bank credit.
These distributions provide some evidence on Meltzer’s bank-substitute theory.
Consistent with this theory, the use of bank credit only was highest in 2003 when interest rates
were lowest and lowest in 1998 when interest rates were highest, whereas use of trade credit only
was highest in 1998 and lowest in 2003.
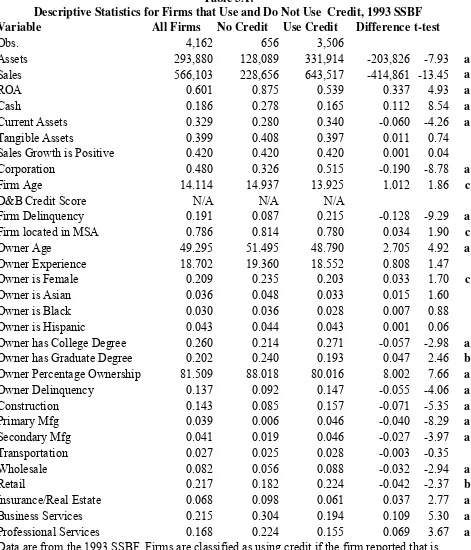
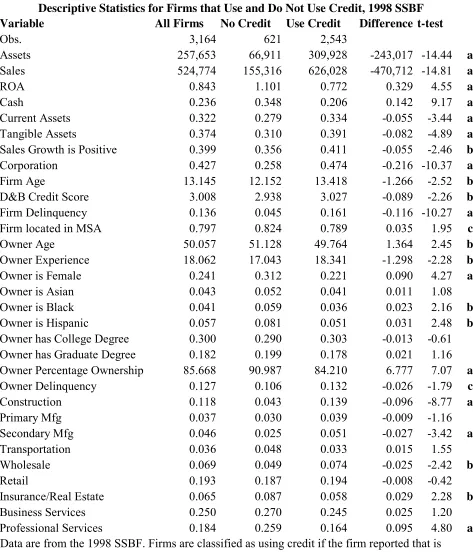
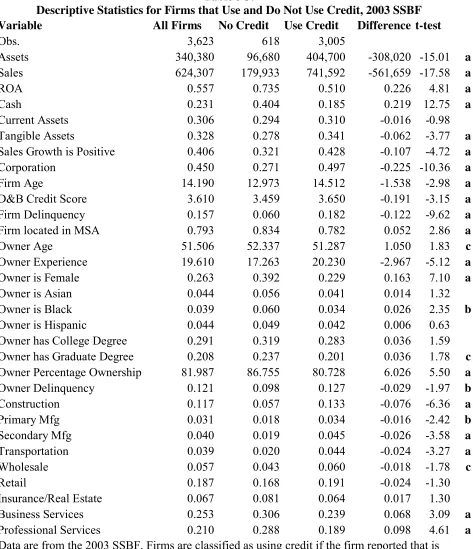
Table 3A, 3B and 3C present descriptive statistics from the 1993, 1998 and 2003 SSBFs,
respectively, first for the full sample, and then separately for Use credit firms and use no credit
firms. The tables also present the results from a t-test for statistically significant differences in
the means of the use credit and use no credit firms.
For the full sample of the 2003 SSBF (shown in Table 3A), the average firm had annual
sales of $624,307, return on assets (ROA) of 55.7 basis points, had current assets equal to 31
percent of total assets, had tangible assets equal to 33 percent of total assets, had growth in sales
been in business for 14.2 years and had a categorical D&B credit score of 3.61 (where 1 is worst
and 6 is best). The average owner was 51.5 years old, and 26.3 percent of owners were female,
3.9 percent were Black and 4.4 percent were Hispanic; 29.1 percent had a college degree, 20.8
percent had a graduate degree and the rest had less than a college degree. By industry, 11.7
percent were in construction, 7.1 percent were in manufacturing, 3.9 percent were in
transportation, 5.7 percent were in wholesale trade, 18.7 percent were in retail trade, 6.7 percent
were in insurance/real estate (financial institutions are excluded), 25.3 percent are in business
services and 21.0 percent are in professional services.
When compared with firms that use credit, firms that use no credit are significantly
smaller as measured by sales ($179,933 vs. $741,592), more profitable as measured by ROA
(73.5 basis points vs. 51.0 basis points), allocate less of their assets to both current assets (29.4
percent vs. 31.0 percent) and tangible assets (27.8 percent vs. 34.1 percent), are less likely to be
growing in terms of sales (32.1 percent vs. 42.8 percent), are less likely to be organized as
corporations (27.1 percent vs. 49.7 percent), are younger (12.97 years vs. 14.51 years) and have
worse credit scores (3.459 vs. 3.650). Owners of firms that use no credit are older as measured
by owner age (52.2 years vs. 51.3 years), more likely to be female (39.2 percent vs. 22.9 percent)
or Black (6.0 percent vs. 3.4 percent); They also are better educated with a college or graduate
degree (55.6 percent vs. 48.4 percent). By industry, use no credit firms are significantly more
likely to be found in business services and professional services and significantly less likely to
be found in construction, manufacturing, transportation and wholesale trade.
If we look across Tables 3A, 3B and 3C, we find a number of regularities with respect to
differences in use credit and use no credit firms, as defined by statistically significant differences
assets and sales, more profitable as measured by ROA, have less financial slack as measured by
the ratio of cash to assets, are more likely to be organized as corporations, are much more likely
to report firm delinquencies, are less likely to be located in rural areas. The owners of use credit
firms are consistently younger, less likely to be female and have a smaller ownership percentage
of the firm. By industry, Use Credit firms are more likely to be found in construction,
manufacturing and wholesale trade and less likely to be found in professional services.
6.2 Multivariate Results
6.21 Univariate Probit Model Explaining Differences in
Firms that Use Credit and Firms that Use No Credit
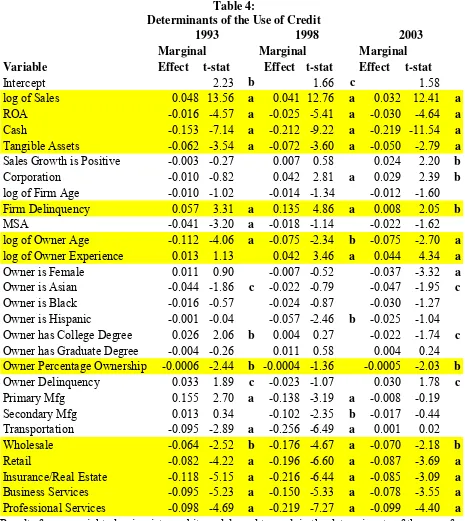
Table 4 presents the results from estimating equation (1) using a weighted univariate
probit model to explain differences in use no credit firms and use credit firms from each of the
three SSBFs. Many of the significant differences vary, and often change signs across the three
surveys, so we will focus on the results that are consistent across the three surveys. The
multivariate results largely confirm findings from the univariate results presented in Tables 3A,
3B and 3C.
As compared to use no credit firms, use credit firms are significantly larger as measured
by the log of annual sales, less profitable as measured by return on assets, have less financial
slack as measured by cash, and are more likely to report business delinquencies. However, in a
multivariate setting, use credit firms have significantly fewer tangible assets, in contrast with the
univariate results. Use credit firms are more likely to be organized as corporations in 1998 and
2003 but not in 1993, in spite of the large univariate difference; in 1993, 51.5% of use credit
Owners of use credit firms are significantly younger as measured by the log of owner
age, but more experiences as measured by the number of years owning or managing a business,
and own a smaller percentage of the firm. Differences by race, ethnicity, gender and educational
attainment are not consistently significant.
By industry, use credit firms are significantly less likely to be classified as
professional-services and business-services firms, insurance/real estate firms,) and wholesale-trade and
retail-trade firms as compared with the omitted category of construction firms.
6.22 Bivariate Probit Selection Model Explaining Differences in
Firms that Use Trade Credit and Firms that Use No Trade Credit Firms
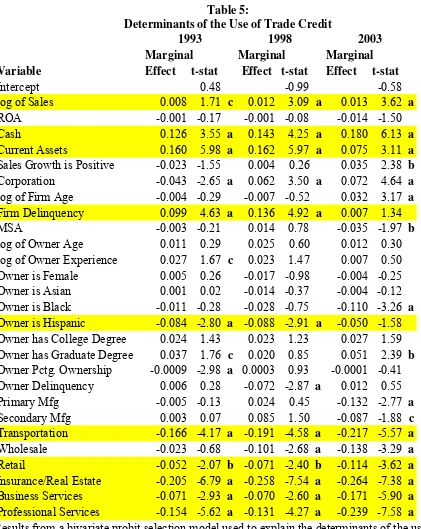
Table 5 presents the results from estimating equation 2A to explain differences in firms
that use trade credit from firms that use no trade credit, conditional upon using either trade
credit or bank credit. This equation is estimated using a bivariate probit selection model, where
we first estimate equation 1 using the full sample and then estimate equation 2A including only
those firms that reported using either bank credit or trade credit. The estimated correlation
between the error terms in the two equations is statistically indistinguishable from zero,
indicating that sample-selection bias is not present when we estimate equation 2A with a simple
probit model. (Results obtained when we estimate equation 2A using the full sample and no
selection equation are qualitatively similar to those reported in Table 5.)
As compared to use no trade credit firms, use trade credit firms are significantly larger
as measured by the log of sales, have more financial slack as measured by the ratio of cash to
assets, and allocate more of their assets to current assets (primarily accounts receivable and
(ROA) is consistently negative but fails to come close to statistical significance. Sales growth,
corporation, firm age and MSA each flips sign across surveys.
Owners of use trade credit firms are significantly less likely to be Hispanic and are
consistently more educated in terms of having at least a college degree but the education
variables lack significance in 1998. Percentage ownership is consistently negative but is
significant only in 1993. Black is consistently negative but is significant only in 2003. Age and
experience both are consistently positive, but lack statistical significance.
By industry, use trade credit firms are significantly less likely to be classified as
business-services or professional-services firms, insurance/real estate firms, retail-trade firms
and transportation firms as compared with the omitted category of construction firms.
6.23 Bivariate Probit Selection Model Explaining Differences in
Firms that Use Bank Credit and Firms that Use No Bank Credit
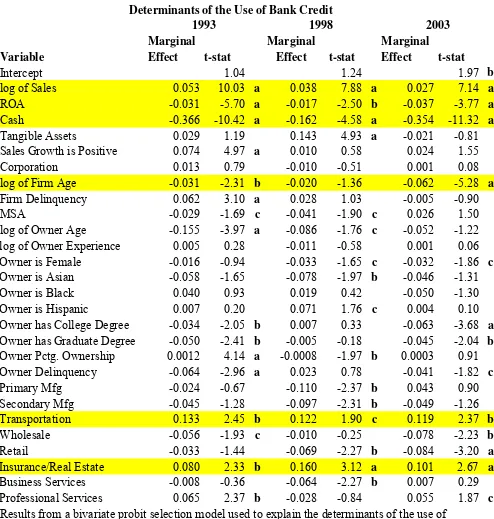
Table 6 presents the results from estimating equation 2B to explain differences in firms
that use bank credit from firms that use no bank credit, conditional upon using either bank credit
or trade credit. Again, this equation is estimated using a bivariate probit selection model, where
we first estimate equation 1 using the full sample and then estimate equation 2B including only
those firms that use either bank credit or trade credit. Again, the estimated correlation between
the error terms in the two equations is statistically indistinguishable from zero, indicating that
sample-selection bias is not present when we estimate equation 2B with a simple probit model.
(Results obtained when we estimate equation 2B using the full sample and no selection equation
are qualitatively similar to those reported in Table 6.)
measured by the log of sales, are less profitable as measured by ROA, have less financial slack as
measured by the ratio of cash to assets and are more opaque (younger) as measured by the log of
firm age. Sales growth is consistently positive in sign but significant only in 1993. The
remaining firm variables switch signs across surveys. In general, these results are inconsistent
with the “core factors” reported by Frank and Goyal (2007) as being the primary determinants of
firm leverage; whereas they find a positive relation between leverage and tangible assets and a
negative relation between firm leverage and profitability, we find exactly the opposite. Our
findings with respect to firm size are consistent: larger firms use more leverage. In general, these
results also are inconsistent with the pecking-order theory, which predicts a negative sign for
firm profitability and a positive sign for tangible assets.
Owners of use bank credit firms are consistently younger as measured by log of owner
age, more educated as measured by having a college or graduate degree, and less likely to be
female or Asian and more likely to be Hispanic, but none of these variables is statistically
significant across the three SSBFs. The remaining owner variables flip signs across the surveys.
By industry, use bank credit firms are significantly more likely to classified as
transportation and insurance/real estate and less likely to be classified as wholesale-trade or
retail-trade firms as compared with the omitted category of construction firms.
6.24 WLS Regression to Explain Amount of Trade Credit Used
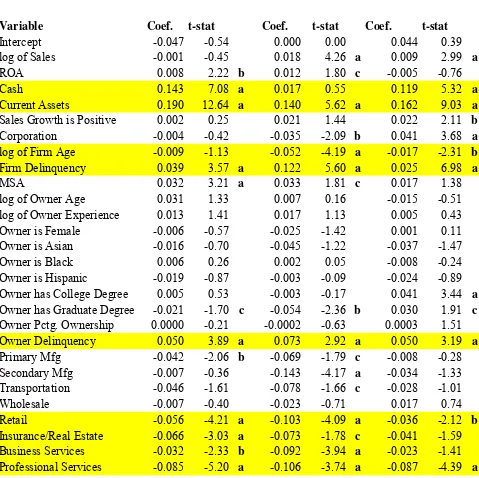
Table 7 presents the results from estimating equation 3A to explain the amount of trade
credit used by the firm, conditional upon the firm using trade credit. This equation is estimated
using a two-equation sample-selection model as developed by Heckman (1979), where we first
firms that use trade credit. The estimated correlation between the error terms in the two equations
is statistically indistinguishable from zero, indicating that sample-selection bias is not present
when we estimate equation 3A with a simple weighted-least-squares model.
Consistent with a number of previous studies, we find that the amount of trade credit
used decreases with the log of firm age, indicating that younger, more opaque firms about which
less information is available, rely more heavily upon trade credit. Cuñat (2007) uses firm age as a
proxy for the strength of the relationship between the trade creditor and borrower and finds a
nonlinear relation between firm age and the amount of trade credit used, first rising during the
first five years of a firm’s life and then declining subsequent to that period. We also test
nonlinear specifications (not shown) where firm age is fit as a two-part spline function of zero to
five years and then six or more years, as suggested by Cuñat’s results. Our results fail to support
Cuñat, in that both variables are either insignificant or negative and significant; we do not find a
positive relation for younger firms.
The amount of trade credit used is positively related to financial slack as measured by the
ratio of cash to assets and to current assets as measured by the sum of accounts receivable,
inventory and other current assets scaled by total assets. This finding with respect to current
assets supports our hypothesis that firms try to match the maturities of their assets and liabilities,
so that firms with high levels of current assets will attempt to fund those assets with current
liabilities in the form of accounts payable. The finding with respect to cash contrasts with those
of Cuñat (2007), who finds a negative relation between the amount of trade credit used and
liquid assets, and argues against his theory that firms use more trade credit when they face
liquidity constraints. This discrepancy in findings may be attributable to the fact that Cuñat
balance-sheet data; the SSBFs are much more comprehensive datasets, but at the cost of being
cross-sectional snapshots. For example, Cuñat (2007) has no information on the credit quality of the
firm or its owner, both of which are consistently significant in our results.
The amount of trade credit used is greater both when firm credit quality is worse as
proxied by firms reporting business delinquencies and when owner credit quality is worse as
proxied by the primary owner reporting delinquencies on personal obligations. These results
contradict those of Petersen and Rajan (1997), who find that firms with higher credit quality as
measured by firm size and profitability use more trade credit. However, Petersen and Rajan rely
upon the 1987 SSBF, which did not provide the superior measures of credit quality available in
the three iterations of the SSBF used in this study. In addition, as Cuñat points out, firm size also
is an important control for the level of the firm’s activity, so it may be inappropriate to use it as a
proxy for firm credit quality.
When we include the ratio of tangible assets to total assets in our model (not shown), we
find that this variable is negative and statistically significant; this finding support the prediction
from Cuñat’s model that firms with fewer tangible asset (that can be pledged as loan collateral)
should use more trade credit. This finding also is consistent with the results of Petersen and
Rajan (1997), who find a negative relation between the amount of trade credit used and tangible
assets.
Other than credit quality, none of the owner characteristics are consistently significant in
explaining the amount of trade credit used, with most flipping signs across the three surveys.
By industry, the amount of trade credit used is consistently and significantly smaller
among firms in the business services, professional services, insurance/real estate, and
strongly support our hypothesis that use of trade credit is strongly related to a firm’s industry,
with firms that primarily provide services expected to use significantly less trade credit than
those that provide tangible products.
Not shown in Table 7 are additional regressions where we include the length of the firm’s
relationship with its primary financial institution and whether or not the firm was denied credit
during its most recent loan application. Petersen and Rajan (1997) interpret these as proxies for
financial institutions’ information about the firm, and argue that it should be positive and
significant in explaining the amount of trade credit used if trade creditors use financial
institutions’ information in making their decisions to grant trade credit to the firm. Our results
are consistent with Petersen and Rajan; like them, we find that both of these variables are
statistically insignificant in explaining the amount of trade credit used. We follow them in
interpreting this as evidence that trade creditors generate and rely upon their own information set
in deciding whether to grant trade credit.
6.25 WLS Regression to Explain Amount of Bank Credit Used
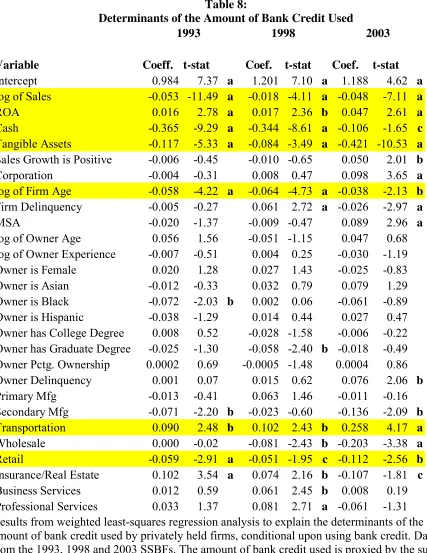
Table 8 presents the results from estimating equation 3B to explain the amount of bank
credit used by the firm (scaled by total assets), conditional upon the firm using bank credit. This
equation also is estimated using a two-equation sample-selection model as developed by
Heckman (1979), where we first estimate equation 2B using the full sample and then estimate
equation 3B including only those firms that use bank credit. Again, the estimated correlation
between the error terms in the two equations is statistically indistinguishable from zero,
indicating that sample-selection bias is not present when we estimate equation 3B with a simple
The amount of Bank Credit Used is negatively related to firm size as measured by the log
of Sales; to financial slack as measured by the ratio of Cash to assets; to Tangible Assets as
measured by the sum of land and depreciable assets scaled by total assets; and is positively
related to profitability as measured by ROA and to firm opaqueness (younger) as measured by
log of Firm Age. These results offer conflicting evidence regarding the pecking-order theory and
trade-off theory. The results with respect to financial slack and firm opaqueness are supportive of
the pecking-order theory; whereas the results with respect to profitability are supportive of the
trade-off theory. The negative sign on Tangible Assets is inconsistent with both theories and with
results from prior research, including Cole (2008).
None of the owner characteristics are consistently significant in explaining the amount of
bank credit used, with inconsistent results across the three surveys. Education as proxied by
owners with a graduate degree is consistently negative in explaining the amount of bank credit
used, but lacks statistical significance in 1993 and 2003.
By industry, the amount of bank credit used is greater for transportation firms and lesser
for retail-trade firms as compared to the omitted category of construction firms. In general, these
results are consistent with those reported by Cole (2008), who also examined the ratio of total
loans to total assets from the SSBFs; however, he measured total loans using the balance-sheet
values rather than the values from the detailed loan information.
In summary, the results from analyzing the amount of bank credit used are problematic,
at best. They conflict with findings of previous research, including studies that use the SSBFs.
We speculate that these conflicts arise from our decision to estimate the amount of bank credit
from the detailed information on loans reported by the firm rather than by the amount of loans
of 0.5 – 0.6 for the three SSBFs analyzed. However, our use of this proxy for bank credit is
consistent with our use of the firm’s answers to these questions in calculating whether or not a
firm used bank credit, which is a more important analysis variable for this study.
7. Summary and Conclusions
In this study, we use data from the 1993, 1998 and 2003 Surveys of Small Business
Finances to provide new information about the use of credit by small businesses in the U.S. More
specifically, we first analyze firms that do and do not use credit, i.e., leveraged and unleveraged
firms; and then analyze how firms that do use credit (leveraged firms) allocate their liabilities
between bank credit (obtained from financial institutions) and trade credit (obtained from
suppliers), in order to shed new light upon these critically important issues. We utilize data from
the Federal Reserve Board’s 1993, 1998 and 2003 SSBFs—a series of nationally representative
samples of small U.S. businesses—to estimate a Heckman selection model, where the manager
of a firm first decides if it needs credit, and then decides from where to obtain this credit—from
financial institutions (in the form of bank credit) or from suppliers (in the form of trade credit).
We find that one in five small firms uses no credit, one in five uses trade credit only, one
five uses bank credit only, and two in five use both bank credit and trade credit. From these
results it is clear that trade credit is more than just a substitute for bank credit, as 40 percent of
small businesses use both types of credit simultaneously. These results are consistent across the
three SSBFs we examine—1993, 1998 and 2003.
When compared to firms that use credit, we find that use no credit firms are significantly
smaller, more profitable, more liquid and of better credit quality, but hold fewer tangible assets.
the wholesale and retail-trade industries. In general, these findings are consistent with the
pecking-order theory of firm capital structure.
Use trade credit firms are larger, more liquid, of worse credit quality, and less likely to
be a firm that primarily provides services. Among, use trade credit firms, the amount of trade
credit used as a percentage of assets is positively related to liquidity and negatively related to
credit quality and is lower at firms that primarily provide services. In general, these results are
consistent with the financing-advantage theory of trade credit.
Use bank credit firms are larger, less profitable, less liquid and more opaque as measured
by firm age, i.e., younger. Among use bank credit firms, the amount of bank credit used as a
percentage of assets is positively related firm liquidity and to firm opacity as measured by firm
age. Again, these results are generally consistent with the pecking-order theory of capital
structure, but with some notable exceptions. The amount of Bank Credit Used is positively
related to profitability and negatively related to tangibility of assets, both in contradiction to the
pecking-order theory.
We contribute to the literature on the availability of credit in at least two important ways.
First, we document that one in five small U.S. firms uses no bank credit or trade credit, and
provide the first rigorous analysis of the differences in these firms and other small U.S. firms that
do use credit.15 A better understanding of why one in five small U.S. firms uses no credit should
provide both academics and policymakers with new insights into why these firms choose not to
participate in the credit markets, and what are the economic and financial consequences for such
firms. Our new evidence also should provide guidance to policymakers regarding how to tailor
15
economic and tax policies as well as regulations to encourage unleveraged firms that are credit
constrained to enter the credit markets.
Second, for those small U.S. firms that do participate in the credit markets, we provide
new evidence regarding factors that determine their use of trade credit and bank credit, and
whether these two types of credit are substitutes (Meltzer, 1960) or complements (Burkart and
Ellingsen, 2004). Our evidence strongly suggests that they are complements, as two in five small
U.S. firms consistently use credit of both types. This is not surprising because trade credit is
primarily short-term whereas bank credit is typically longer-term.
This evidence has important implications for monetary policy, as trade credit has been
theorized to be a shock absorber for small firms during times of tight money. If trade credit is a
complement rather than a substitute for bank credit, then policymakers need to take this into
account when tightening monetary policy by making available to small businesses alternative
sources of financing.
Our evidence also has important implications for fiscal policy, as the administration and
Congress look for ways to stimulate credit provided to small business lending. Existing proposals
focus exclusively on bank lending while totally ignoring trade credit, which is an equally
important source of capital for small businesses. Complementary proposals should explore how
to expand trade credit offered by supplier as well as how to expand bank credit offered by
financial institutions. Provision of new tax credits for suppliers that expand their lending is one
path by which to accomplish this goal. Provision of TARP funds to suppliers is another. Yet no
one is offering such proposals.
As the first rigorous analysis of small U.S. businesses that choose to use no bank credit
the availability of credit to small firms, and how to tailor macroeconomic policies, regulations
and taxes to help small businesses obtain needed credit and reach their optimal capital structures.
Policies designed to help these firms improve their capitalization should lead to higher growth in
REFERENCES
Aghion, P. and Howitt, P. 1988. Endogenous Growth Theory. Massachusetts Institute of Technology Press. Cambridge, MA.
Ang, J., Cole, R., Lin, J. 2000. Agency costs and ownership structure. The Journal of Finance
55, 81-106
Berger, A. and Udell, G. 1995. Relationship lending and lines of credit in small firm finance.
Journal of Business 68, 351-381.
Berger, A., and Udell, G. 1998. The economics of small business finance: The roles of private equity and debt markets in the financial growth cycle, Journal of Banking & Finance 22 (6–8), 613–673.
Berger, A., and Udell, G. 2006. A more complete framework for SME finance, Journal of Banking & Finance 30(11), 2945-2966.
Berger, A., Frame, S., and Miller, N. 2005. Credit scoring and the availability, price and risk of small business credit. Journal of Money, Credit and Banking 37(2), 191-222.
Berger, A., Miller, N., Rajan, R., Stein, J., and Petersen, M. 2005. Does function follow
organizational form? Evidence from the lending practices of large and small banks." Journal of Financial Economics 76 (2): 237-269.
Biais, B, and Gollier, C. 1997. Trade credit and credit rationing. Review of Financial Studies 10, 903-937.
Bitler, M., Robb, A., and Wolken, J. 2001. Financial Services Used by Small Businesses: Evidence from the 1998 Survey of Small Business Finances. Federal Reserve Bulletin 87 (April), 183-205.
Blanchflower, D., Levine, P., and Zimmerman, D. 2003. Discrimination in the small business credit narket.Review of Economics and Statistics 84 (4), 930-943.
Burkart, M., Ellingsen, T. 2004. In-kind finance: A theory of trade credit. American Economic Review 94(3), 569-590.
Carey, M., Post, M., and Sharpe, S. Does corporate lending by banks and finance companies differ? Evidence on specialization in private debt contracting. Journal of Finance, 53 (1998), 845-878.
Cavalluzzo, K., and Cavalluzzo, L. 1998. Market structure and discrimination: The case of small businesses. Journal of Money, Credit and Banking 30 (4), 771-92.