Munich Personal RePEc Archive
SME Access to Credit
Rand, John and Tarp, Finn and Coung, Tran Tien and Tam,
Nguyen Thanh
CIEM
1 November 2009
Online at
https://mpra.ub.uni-muenchen.de/29467/
SME ACCESS TO CREDIT
John Rand*, Finn Tarp**, Tran Tien Cuong*** and Nguyen Thanh Tam
****Abstract
The aim of this paper is to inform the reader about the access to credit of small and
medium scale enterprises in Vietnam based on two SME surveys. Recent evidence
from a variety of sources suggests that credit to available to SMEs has increased over
the past few years. This is confirmed by the two SME surveys. Fewer firms which
applied for credit in 2005 were denied credit as compared to 2002. However, the
rapid development of the private sector has also increased demand for credit
(especially among the larger SMEs); and it appears that the formal financial sector is
just managing to keep track with growth in general. We conclude by discussing these
results and formulate a set of policy recommendations.
Key words:
Vietnam,
credit constraints, financial markets
JEL classification:
016, O53
1. Introduction
A former Vietnamese Secretary General once stated that Vietnam has three problems related to
future economic development: “Capital, capital and capital”. For small and medium scale
enterprises (SMEs) this means that the key obstacles to growth for SMEs are “credit, credit and
credit”. This article reviews recent research findings on SME access to credit with data collected in
2002 and 2005.1
The Vietnamese banking system has undergone significant reform since the beginning of the 1990s,
but many challenges remain to be addressed. The banking sector continues to be dominated by state
owned commercial banks (SOBCs), and the four major SOCBs account for 70-80% of total assets.
Although the government has announced that policy-induced lending was to be phased out, ‘‘policy
lending’’ has remained a defining characteristic of the SOCBs and the share of non-performing
1
loans (NPLs) has remained large throughout the reform process. This has kept SOCB profits quite
low as compared to the market power they have. These circumstances have kept financial
innovations at a minimum and the high level of indirect government involvement in the financial
system has given little incentive to improve banking performance.
For example, the lack of competitive pressure has limited incentives to improve capabilities with
regards to credit analysis, and the concept of credit reporting is therefore still rather new in
Vietnam.2 Recent World Bank studies have shown that without access to quality corporate credit
worthiness data, banks remain conservative in lending, which limits access to credit. Doing
Business (2007) therefore notes that there is a strong need for improving the availability of credit
information in Vietnam. This view is supported by Thanh and Duong (2006). They also argue that
establishing local credit rating agencies (CRA) is especially crucial for the development of the
capital market in Vietnam.
The question therefore becomes whether insufficient banking competitiveness (plus large
government involvement and the legacy of NPLs) and the lack of willingness to financially
innovate has affected SMEs credit access situation. Although the total amount of credit made
available to SMEs has recently increased (Doing Business, 2007), credit may still be a constraining
factor on the development process as suggested above.
2. Credit Access
a) Firm perceptions
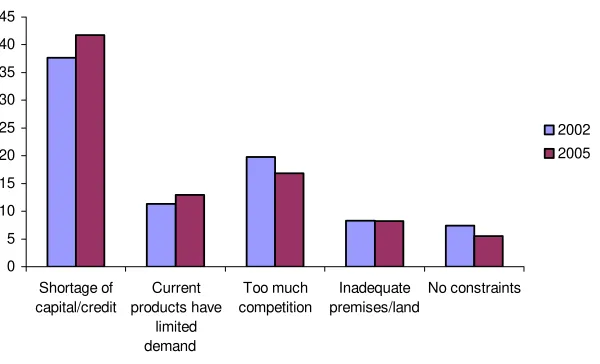
Figure 1 gives an overview of the problems faced when doing business – as perceived by firm
owners – and how these problems have changed over the time between the surveys in 2002 and
2005. Given that the questions regarding constraints faced by the enterprise were posed in exactly
the same way in both surveys, we are able to give an indication of the evolution of the Vietnamese
business environment from the owner or manager point of view. Figure 1 illustrates the five
categories that scored the highest each year.
2
Figure 1: Most Important Constraint to Growth as Perceived by Enterprises
0 5 10 15 20 25 30 35 40 45
Shortage of capital/credit
Current products have
limited demand
Too much competition
Inadequate premises/land
No constraints
2002 2005
Although Vietnam has improved the firm credit access by expanding the range of assets that can be
used as collateral (Doing Business, 2008), shortage of capital/access is still cited as the most serious
problem facing SMEs. Interestingly, slightly more firms consider access to credit as the most severe
problem in 2005 as compared to 2002.
b) Formal Credit
The SME surveys contain information on the number of enterprises applying and obtaining bank
loans or other forms of formal credit during the past three years. In 2005 only 39 percent of
enterprises had applied for a bank loan. However, 19 percent of these firms experienced problems
with their loan application and were denied credit. These enterprises can thus be classified as credit
FIGURE 1:NUMBER OF CREDIT CONSTRAINED SMES BY YEAR
0 5 10 15 20 25 30
2005 2002
Survey year
P
e
rc
e
n
t o
f
fi
rm
s
Constrained 1 Constrained 2
Even though enterprises obtained some amount of credit, they still nevertheless consider themselves
in need of a loan. Notably, 60 percent of the firms in this group still have need for a loan.
Characterising these enterprises as credit constrained as well (Constrained 2), expands share of the
group of constrained firms to 26.5 percent of the total sample. This is shown in Figure 1 where data
from the 2002 survey are also reported. Using the simplest credit constraint measure (Constrained
1) shows that fewer SMEs were credit constrained in 2005 than in 2002. However, no apparent
change in credit constraints is observable between 2002 and 2005 using “Constrained 2”. The two
constraint measures together suggest that fewer SMEs are denied access to formal credit. However,
the size of the loans obtained is not sufficient to accomplish a change over time in the second
constraint measure. Thus, the size of formal sector loans remains inadequate to fulfil the financing
requirements for many SMEs. At the same time it must be kept in mind that some SMEs have
internal difficulties in preparing the necessary documentation to obtain loans.
It can be added that also some of the enterprises in the non-applicant group may be credit
constrained. The 2005 survey shows (not reported) that 30 percent of the firms not applying for
c) Interest rates were too high. Adding these non-applicants to the group of credit constrained
enterprises means that 44.7 percent are considered one way or the other in their access to credit.
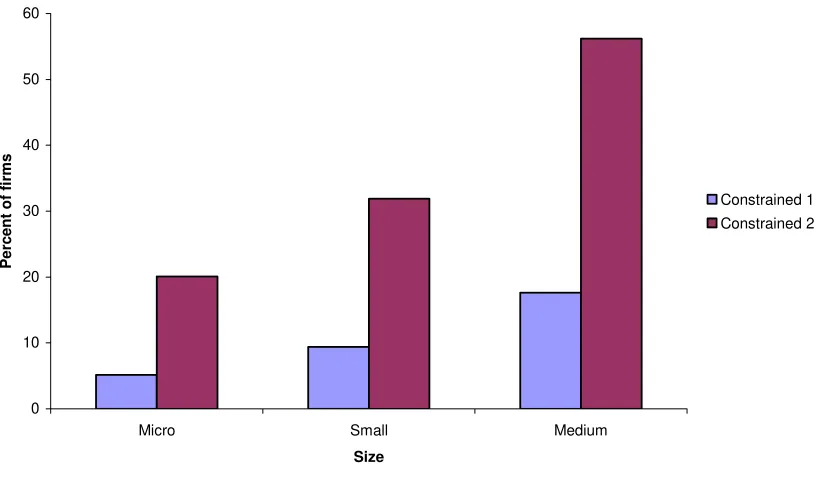
FIGURE 2:CREDIT CONSTRAINED SMES BY SIZE CATEGORY
0 10 20 30 40 50 60
Micro Small Medium
Size
Perc
ent o
f
fi
rm
s
Constrained 1 Constrained 2
Figure 2 shows the credit constraint distribution by firm size category in 2005.3 Interesting we see
that the share of credit constrained firms increase with firm size independent of the credit constraint
measure used. This confirms the result in Rand (2007) that credit constraints seem more binding for
larger SMEs, suggesting that a shift in policy focus from micro household firms towards supporting
the larger small and medium scale enterprises is needed.
c) Informal Credit
Enterprises that are credit constrained in the formal credit market have the possibility of trying to go
for informal credit. This market is fairly well developed in Vietnam. Figure 3 confirms that around
3
[image:6.612.94.505.180.420.2]half of the credit constrained enterprises have informal loans as compared to only 15 percent for the
non-constrained enterprises.
FIGURE 3:SHARES OF FORMAL AND INFORMAL CREDIT FOR CREDIT-CONSTRAINED SMES
0 10 20 30 40 50 60
No Yes
Credit constrained
Perce
n
t
Do not loan informally Have informal loans
Rand and Tarp (2007) show that informal loan amounts and interest rates are on average much
lower than for formal loans. There is normally no interest charged on loans to family and friends.
Informal loans are on average only one-third the size of formal loans, but firms do not pay interest
on over half the informal loans (median zero). This is caused by the fact that around two-thirds of
informal loans are obtained from friends and relatives. Moreover, informal loans are also
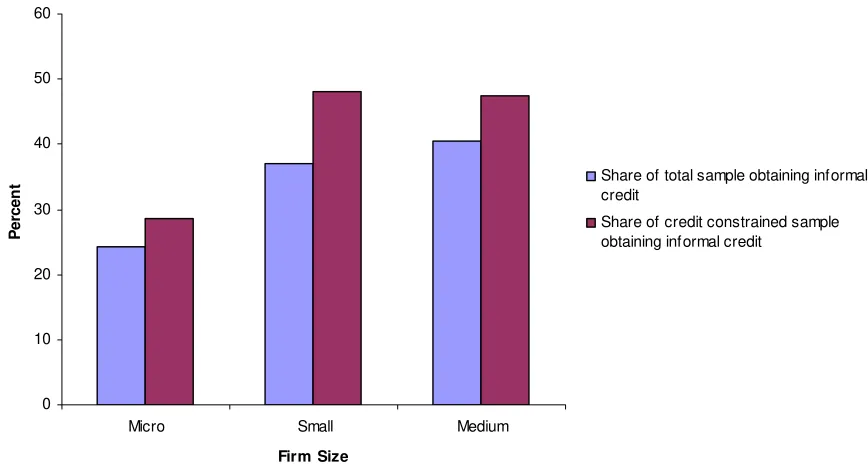
FIGURE 4:SHARE OF SMES OBTAINING CREDIT FROM INFORMAL SOURCES BY FIRM SIZE
0 10 20 30 40 50 60
Micro Small Medium
Firm Size
Pe
rc
e
n
t Share of total sample obtaining informal
credit
Share of credit constrained sample obtaining informal credit
Figure 4 demonstrates that there also exists a positive association between firm size and the
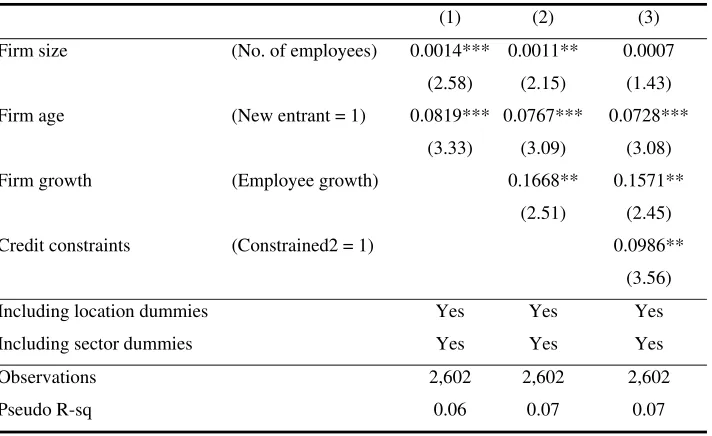
probability of getting an informal loan; and Table 1 checks the robustness of this firm size result.
Besides firm size, an indicator variable for firm age (new entry = 1 if firm age less than five, zero
otherwise) and location and sector dummies we use our indicator variable for being credit
constrained and a growth indicator (in this case we use employment growth) as potential
determinants of using informal credit. First of all, fast growing enterprises use informal credit more
frequently. This confirms the result in Rand (2007) that informal credit plays a crucial role for
successful enterprises in expanding and trying to “seize the day” of present market opportunities.
As expected, enterprises constrained in the formal credit market more often seek to informal credit
sources. New entrants are also more likely to obtain informal loans than incumbents. Most
surprisingly is the fact that the firm size effect remains. Larger firms seek informal credit more
frequently than their smaller counterparts. However, column 3 suggests that this size effect exist
[image:8.612.90.524.110.343.2]Table 1: Who Uses Informal Loans?
(1) (2) (3)
Firm size (No. of employees) 0.0014*** 0.0011** 0.0007
(2.58) (2.15) (1.43)
Firm age (New entrant = 1) 0.0819*** 0.0767*** 0.0728***
(3.33) (3.09) (3.08)
Firm growth (Employee growth) 0.1668** 0.1571**
(2.51) (2.45)
Credit constraints (Constrained2 = 1) 0.0986**
(3.56)
Including location dummies Yes Yes Yes
Including sector dummies Yes Yes Yes
Observations 2,602 2,602 2,602
Pseudo R-sq 0.06 0.07 0.07
Note: Probit, marginal effects. Weighted estimates and cluster robust standard errors. *, **, *** indicates
significance at a 10%, 5% and 1% level, respectively. Base: HCMC and Food processing (ISIC 15).
3. Conclusions and policy recommendations
Recent evidence from a variety of sources suggests that credit to available to SMEs has increased in
Vietnam over the past few years. This is confirmed by the SME surveys. Fewer firms which applied
for credit in 2005 were denied credit as compared to 2002. However, the rapid development of the
private sector has at the same time increased firm demand for credit (especially among the larger
SMEs). Accordingly, the number of firms which do not get their demand for formal credit fulfilled
seems unchanged since 2002. About one-fourth of the SMEs remain credit constrained. From the
overall SME point of view it therefore appears that the formal financial sector is just managing to
keep track with growth in general. The structure of credit remains unchanged.
• It is recommended that government takes concerted steps towards breaking new ground in promoting formal credit for SME development.
In addition, the SME surveys show that larger SMEs are those which face binding credit
constraints. These firms therefore seek financing more frequently on informal credit markets.
• A shift in policy focus from micro household firms towards supporting the larger small and
Finally, our research shows that fast growing firms are today forced to rely on the informal credit
market if they want to seize investment opportunities to promote enterprise growth and success.
How to help them get more access to formal credit is a key challenge.
• Establishing local Credit Rationing Agencies (CRAs) would be highly efficient in increasing
transparency and creating a faster formal credit allocation system. This would benefit fast
growing firms, in particular.
Sources
World Bank (2007). “Doing Business 2008: Country Briefing Vietnam”, downloadable from
http://web.worldbank.org/WBSITE/EXTERNAL/COUNTRIES/EASTASIAPACIFICEXT/VIE TNAMEXTN/0,,contentMDK:21487901~pagePK:1497618~piPK:217854~theSitePK:387565,00 .html
Rand. J. (2007). “Credit Constraints and Determinants of the Cost of Capital in Vietnamese
Manufacturing”, Small Business Economics, 29, 1-13.
Rand. J. and Tarp. F. (2007). “Characteristics of the Vietnamese Business Environment: Evidence
from a SME Survey in 2005”. CIEM publication. Ha Noi. Available at
http://www.ciem.org.vn/home/en/upload/info/attach/1184569268315_Characteristics_of_the_Vi etnamese_Business_Environment._Evidence_from_SME_survey_in_2005_BSPS.06.02.pdf. See also the 2002 data and survey documented at
http://www.econ.ku.dk/rand/images/VNDodumentation02.pdf
Thanh,V.T. and Duong (2006). “Promoting Credit Rating in Vietnam for Capital Market
Development”, Vietnam Economic Management Review (VEMR), no. 1, 41-51. Available at