Using Google Analytics for measuring
inlinks effectiveness.
Plaza, Beatriz
Faculty of Economics / University of the Basque Country Art4pax
Foundation
23 December 2009
Using Google Analytics for measuring inlinks effectiveness
Beatriz Plaza
Afiliation 1:
Faculty of Economics, University of the Basque Country, Avda, Lehendakari Agirre 83, 48015 Bilbao, Spain
Afiliation 2:
Art4pax Foundation, Carlos Gangoiti 16, 48300 Gernika, Basque Country, Spain.
Abstract
The aim of this brief communication is to develop a tracking methodology to analyse the effectiveness of inlink visits (return visit behaviour and length of sessions). In other words, how deep do inlink visitors navigate into the website? Do all inlinks perform the same? This paper addresses these questions by time series analysis of Google Analytics data, with a methodology developed by Plaza (2009). The importance of this article is not the particular website but the methodology tested to arrive at these results, an experiment that could be repeated with different websites.
Keywords
Using Google Analytics for measuring inlinks effectiveness
Beatriz Plaza
Introduction
Web analytics is on the increase. Hundreds of thousands of web owners worldwide have a web analyser program available to them. This web analyser provides plain and simple statistics concerning the website (number of visitors, the average number of page views per visitor, average page duration, most requested pages, domain classes and referrers). The main idea of this article is that the analysis of the effectiveness of a site’s traffic source lies necessarily in the use of time series analysis. The purpose of this paper is to apply the methodology developed by Plaza (2009) to website inlinks, an experiment that could be repeated with different websites.
This communication presents an experiment done with the information that Google Analytics offers for an academic resource, about the number of visits on a website and the traffic source, which includes organic results in search engines, links from referral web pages or direct access. In other words, it investigates the differences between sessions started by direct connection by typing the site name, by a link on another site, or from a search engine, with regard to return visit behaviour and length of sessions. The importance of this paper is not the particular academic website http://www.scholars-on-bilbao.info, but the new methodology tested to arrive at these results. The case study must be presented only as a way to explain the new methodology, because it is a particular case and it is quite possible that in other websites results are completely different regarding the information architecture, the goals of the website and the type of services it delivers.
How deep do inlink visitors navigate into the website? Which is their internal performance? Are inlink visits more effective than search engine entries? This paper addresses these questions by time series analysis of Google Analytics data. It is understood that to maximize the effectiveness of the entries is synonymous to maximizing the number of pages per visit (i.e., how deep into the website they navigate), to maximize the return rate and to minimize bounce rates (Plaza 2009). This is a brief exploratory communication of a work in progress in order to open new paths of research with regard to in-house website tracking with Google Analytics.
Why use Google Analytics? Firstly, and most importantly for the purpose of this study, it is used because Google Analytics provides time series data. Moreover, it is also employed because Google Analytics is a free service offered by Google that generates detailed statistics about the visits to a website, and which is a user friendly application with the guarantee of Google technology. This tracking application, external to the website, records traffic by inserting a small piece of HTML code in every page of the website. Google Analytics tells the web owner how visitors found the site and how they interact with it. Users will be able to compare the behaviour of visitors who were referred from search engines and emails, from referring sites and direct visits, and thus gain insight into how to improve the site's content and design.
Rodriguez-Burrel 2009). Some statistical matters with regard to the use of Google Analytics data in combination with time series methodology were developed and fine-tuned by Plaza (2009).
Hypothesis testing
In July 2006 a non-profit organization (based in Gernika, Basque Country-Spain) launched http://www.scholars-on-bilbao.info (Art4pax Foundation 2008) in order to improve the dissemination of R&D results in the field of Art-related Humanities and Social Sciences’ scientific production, through the exchange of research work on the Guggenheim Museum Bilbao case and the city’s urban regeneration. This locally based website encompasses academic works that analyse the urban regeneration of the city of Bilbao (among others, strategic plans, infrastructures, the Guggenheim Museum Bilbao and dilemmas, cultural tourism, gentrification, uneven development, creative industries and artists). Each work includes the abstract and a web-link to its pdf/word file. Due to the fact that each work is displayed in a single page, the number of pages per visit tells whether the visitors are attracted by the content or not.
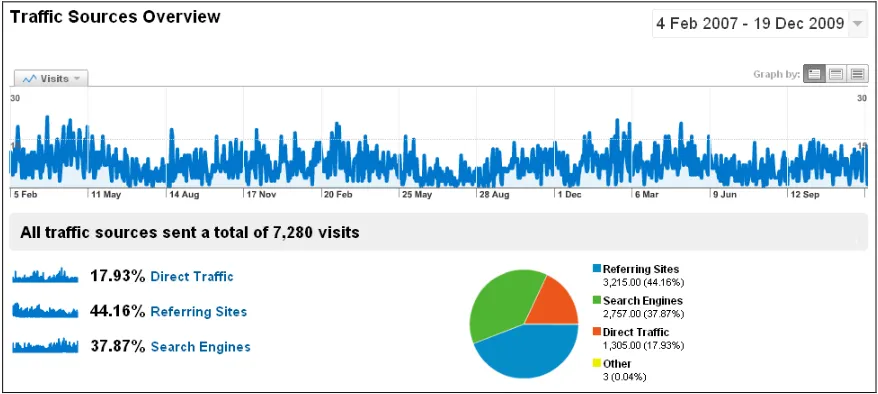
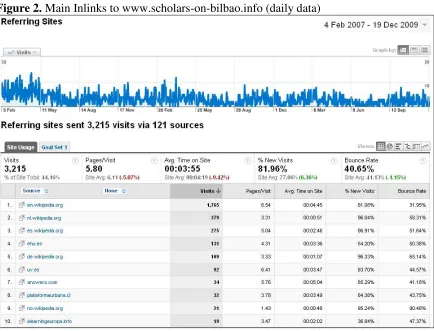
The Google Analytics traffic overview (Figure 1) shows that all traffic sources sent a total of 7,280 visits from 1 February 2007 to 19 December 2009. Of those visits 1,305 came directly to this site, referring sites sent 3,214 visits via 121 sources, and search engines sent a total of 2,756 visits. Reference site traffic is, by far, the main source of entries for www.scholars-on-bilbao.info: almost 45 per cent of the total incoming visits. But, how deep into the website do inlinks visits navigate in comparison with other traffic sources? Are Wikipedia references more effective than other inkinks?
[Take in Figures 1 and 2]
Several regressions are undertaken (see Tables 1, 2 and 3). As recommended by Plaza (2009), weekly data is utilized. The Breusch-Godfrey Serial Correlation LM Test is used to check serial autocorrelation. White Test is used to test heteroskedasticity, and the Jarque-Bera statistic to test normality. The presence of outliers is corrected through the use of dummies. The ADF Test is used to check stationarity of variables. The roots of the AR and MA processes are outside the unit circle. The regressions are well-adjusted. The fitted estimations are as follows:
[Take in Tables 1, 2 and 3]
Results
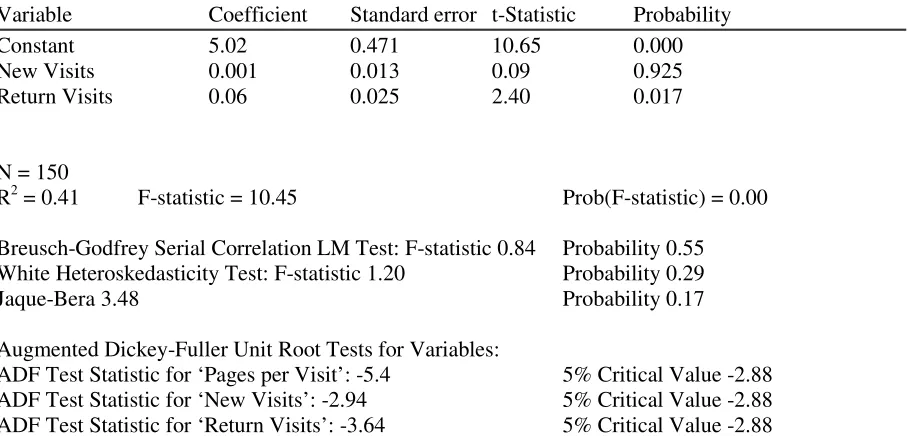
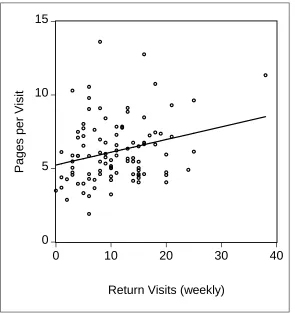
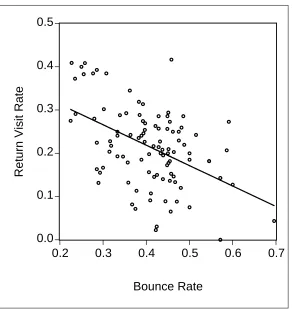
Results from Table 1 show that the number of pages per entry grows by 0.06 out of every extra return visit, whereas the marginal effect of new visits is nil. That is to say that return visits are the main engine for nurturing session length for www.scholars-on-bilbao.info (see Figure 3), and bounce less (Figure 4). But, which type of traffic source nurtures these return visits?
According to the reading of the results in Table 2, 0.43 out of every direct entry visit returns, 0.36 out of every search engine entry visits the site again, and only 0.24 out of every referee site visit returns. In other words, for our particular website, direct visits are the most effective ones, followed by search engine visits and only thirdly link-entries (Plaza 2009).
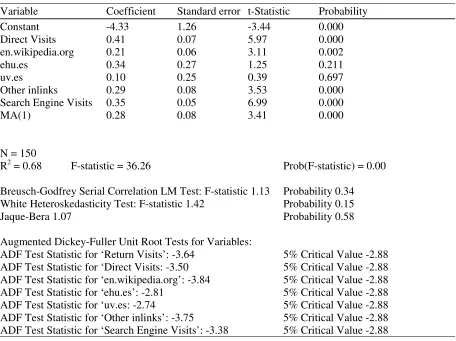
According to Table 3, the effectiveness of the inlinks from www.ehu.es and www.uv.es is null. 0.21 out of every http://en.wikipedia.org driven entry visits the site again, and 0.29 out of every ‘Other Inlinks’ visit returns. In other words, for our particular website,
http://en.wikipedia.org driven entries are effective, showing an adequate return visit behaviour and length of sessions; although ‘Other Inlinks’ show even more effective.
The agenda for future research requests the repetition of the experiment with different websites, to delimit more accurately the effectiveness of different inlinks, and to compare these results with other case studies.
References
Art4pax Foundation (2008), Scholars on Bilbao. http://www.scholars-on-bilbao.info
Hasan L, Morris A, Probets S (2009) Using Google Analytics to Evaluate the Usability of E-Commerce Sites. Lecture Notes in Computer Science5619, 697-706.
Plaza, B. (2009) Monitoring web traffic source effectiveness with Google Analytics. An experiment with time series. Aslib Proceedings61(5), 474-482.
www.emeraldinsight.com/10.1108/00012530910989625
Table 1. Regression for Pages per Visit (weekly data, 4 Feb 2007-19 Dec 2009)
Variable Coefficient Standard error t-Statistic Probability Constant 5.02 0.471 10.65 0.000 New Visits 0.001 0.013 0.09 0.925 Return Visits 0.06 0.025 2.40 0.017
N = 150
R2 = 0.41 F-statistic = 10.45 Prob(F-statistic) = 0.00
Breusch-Godfrey Serial Correlation LM Test: F-statistic 0.84 Probability 0.55 White Heteroskedasticity Test: F-statistic 1.20 Probability 0.29 Jaque-Bera 3.48 Probability 0.17
Augmented Dickey-Fuller Unit Root Tests for Variables:
ADF Test Statistic for ‘Pages per Visit’: -5.4 5% Critical Value -2.88 ADF Test Statistic for ‘New Visits’: -2.94 5% Critical Value -2.88 ADF Test Statistic for ‘Return Visits’: -3.64 5% Critical Value -2.88
Note: For the methodology of Tables 1, 2 and 3 see Plaza, B. (2009) Monitoring web traffic source effectiveness with Google Analytics. An experiment with time series. Aslib Proceedings61(5), 474-482.
Table 2. Regression for Return Visits (weekly data, 4 Feb 2007-19 Dec 2009)
Variable Coefficient Standard error t-Statistic Probability Constant -4.49 1.28 -3.49 0.000 Direct Visits 0.43 0.06 6.23 0.000 Referring Sites Visits 0.24 0.04 5.98 0.000 Search Engine Visits 0.36 0.05 6.98 0.000 AR(1) 0.27 0.08 3.22 0.001
N = 150
R2 = 0.68 F-statistic = 58.1 Prob(F-statistic) = 0.00
Breusch-Godfrey Serial Correlation LM Test: F-statistic 0.87 Probability 0.52 White Heteroskedasticity Test: F-statistic 1.75 Probability 0.10 Jaque-Bera 0.67 Probability 0.71
Augmented Dickey-Fuller Unit Root Tests for Variables:
Table 3. Regression for Return Visits (weekly data, 4 Feb 2007-19 Dec 2009)
Variable Coefficient Standard error t-Statistic Probability Constant -4.33 1.26 -3.44 0.000 Direct Visits 0.41 0.07 5.97 0.000 en.wikipedia.org 0.21 0.06 3.11 0.002 ehu.es 0.34 0.27 1.25 0.211 uv.es 0.10 0.25 0.39 0.697 Other inlinks 0.29 0.08 3.53 0.000 Search Engine Visits 0.35 0.05 6.99 0.000 MA(1) 0.28 0.08 3.41 0.000
N = 150
R2 = 0.68 F-statistic = 36.26 Prob(F-statistic) = 0.00
Breusch-Godfrey Serial Correlation LM Test: F-statistic 1.13 Probability 0.34 White Heteroskedasticity Test: F-statistic 1.42 Probability 0.15 Jaque-Bera 1.07 Probability 0.58
Augmented Dickey-Fuller Unit Root Tests for Variables:
Figure 3. Return visits navigate deeper into the website and stay longer.
0 5 10 15
0 10 20 30 40
Return Visits (weekly)
P
a
g
e
s
p
e
r
V
is
it
Source: Plaza, B. (2009) Monitoring web traffic source effectiveness with Google Analytics. An experiment with time series. Aslib Proceedings61(5), 474-482.
Figure 4. The less bounce rate, the more return visit rate
0.0 0.1 0.2 0.3 0.4 0.5
0.2 0.3 0.4 0.5 0.6 0.7
Bounce Rate
R
e
tu
rn
V
is
it
R
a
te
Source: Plaza, B. (2009) Monitoring web traffic source effectiveness with Google Analytics. An experiment with time series. Aslib Proceedings61(5), 474-482.