Functional Analysis of Chemometric Data
*
Ana M. Aguilera, Manuel Escabias, Mariano J. Valderrama, M. Carmen Aguilera-Morillo Department of Statistics, University of Granada, Granada, Spain
Email: [email protected], [email protected], [email protected], [email protected]
Received May 15, 2013; revised June 15, 2013; accepted June 22,2013
Copyright © 2013 Ana M. Aguilera et al. This is an open access article distributed under the Creative Commons Attribution License, which permits unrestricted use, distribution, and reproduction in any medium, provided the original work is properly cited.
ABSTRACT
The objective of this paper is to present a review of different calibration and classification methods for functional data in the context of chemometric applications. In chemometric, it is usual to measure certain parameters in terms of a set of spectrometric curves that are observed in a finite set of points (functional data). Although the predictor variable is clearly functional, this problem is usually solved by using multivariate calibration techniques that consider it as a finite set of variables associated with the observed points (wavelengths or times). But these explicative variables are highly correlated and it is therefore more informative to reconstruct first the true functional form of the predictor curves. Al- though it has been published in several articles related to the implementation of functional data analysis techniques in chemometric, their power to solve real problems is not yet well known. Because of this the extension of multivariate calibration techniques (linear regression, principal component regression and partial least squares) and classification methods (linear discriminant analysis and logistic regression) to the functional domain and some relevant chemometric applications are reviewed in this paper.
Keywords: Functional Data Analysis; B-Splines; Functional Principal Component Regression; Functional Partial Least Squares; Functional Logit Models; Functional Linear Discriminant Analysis; Spectroscopy; NIR Spectra
1. Introduction
In chemometric it is usual to have functional data whose observations are curves observed at a finite set of points (longitudinal data). In Spectroscopy, for example, we have observations of the absorbance spectrum of chemicals that is a function of wavelength. Spectroscopy is a quick and non-destructive analytical technique commonly used to measure certain parameters of interest in terms of the absorbance spectrum. In pharmaceutical industry, it is us- ed in quality control processes to determine some vari- ables as, for example, the amount of active ingredient of a drug. In food industry the spectrum can be used to pre- dict the fatness of a piece of meat [1]. In medicine, fluo- rescence spectroscopy has been recently used for cervical pre-cancer diagnosis [2]. In other applications, the sam- ple curves are functions of time observed in a finite set of instants. In the food industry, for example, the interest may be to classify the quality of foods made with flour according to the curves of resistance of the dough in the
baking process [3].
In all the examples mentioned above, the data are curv- es derived from the observation of a functional variable. To analyze such data which have been developed in recent years is a branch of statistics known as Functional Data Analysis, which emerged as a generalization of the tech- niques of multivariate data analysis to the case of func- tional data [4]. Relevant applications of FDA methodolo-gies have been first developed in different fields as eco- nomy (stock quotes), environment (temperatures and pre- cipitations) and health sciences (degree of lupus and stress), among others [5]. Different nonparametric esti- mation approaches for the FDA methodologies has been developed last years [6]. Although the spectrum is clearly a functional variable, in spectroscopy there are common- ly used multivariate calibration techniques that consider it as a finite set of variables associated with the observed wavelengths. But these variables are affected by multi- collinearity because the spectrum is obtained as a sum of peaks of electromagnetic energy absorption by chemical substances (atoms, molecules...) so that the absorbances at two wavelengths close to each other are highly corre- lated. It is therefore more informative to consider the spectrum as a functional variable containing this depen-
*Ana M. Aguilera, Manuel Escabias, Mariano J. Valderrama, M.
dence structure. When working with functional data, there are two major problems. One is the large number of vari- ables available from discrete observation of the curves that in many cases exceed the sample size. The other is the high correlation between these variables (longitudinal data).
To solve these problems it is necessary to use statisti- cal methods for dimension reduction such as functional principal component analysis (FPCA) [7]. The first step in FDA is to reconstruct the true functional form of the curves from discrete observations. The most common method is to assume that the sample curves belong to a finite space generated by basis functions and approxi- mate the basic coefficients by least square approximation, in the case of noisy observed data, or interpolation when not committed error in the measurement. Thus the func- tional linear model becomes a multiple linear model whose design matrix is a transformation of the matrix of basis coefficients. Different applications of this model with B-splines bases have been developed in spectrome- try showing improvement in the estimates when using functional modeling [8,9]. However, the design matrix of this linear model also tends to be affected by multicol- linearity and high dimension when the number of basic functions used in the approximation of the curves is high. To solve these problems the techniques of principal com- ponent regression (PCR) and partial least squares (PLS) have been generalized to the functional case [4,10,11]. More recently, methods based on introducing different types of spline penalization of the roughness of the func- tional parameter have been introduced for the case of noisy smoothed data and applied in chemometrics [12- 15].
Another problem of interest in chemometrics is the classification of a set of curves in two or more different groups. Linear discriminant analysis (LDA) and logit mo- dels have also been generalized to the case of a functio- nal predictor. Different estimates of these models based on PCA and PLS have been considered for the successful implementation of these techniques [3,16-19]. The lector interested in a review of functional nonparametric meth- ods for solving the problems of regression and classifica- tion of curves, and as well as known applications in spec- troscopy , must be referred to [20].
The aim of this paper is to show the potential of the FDA to solve problems in the field of chemometrics, es- pecially in spectroscopy. To achieve this, an extensive li- terature review will be presented with some applications which show the good behavior of the functional method- ology. Some of the calculations that appear in the re- search reviewed in this paper were performed in Matlab, R or SPLUS making use of the functional data analysis toolboxes that can be downloaded from Professor Ram- say’s ftp-site (ftp://ego.psych.mcgill.ca/pub/ramsay/fdafuns/).
In many others the authors developed their own software. The contents are distributed in five Sections including the introduction. Section 2 is devoted to the description of different functional chemometrics data sets analyzed by using functional data analysis methodologies, the ma- jority of which are in the field of spectroscopy. In Sec- tions 3 and 4, a summary of the most used FDA methods in chemometrics applications is presented. The functional linear model, functional principal component regression and functional partial least squares regression on basis expansion of sample curves are described in Section 3. Parametric methods for curve classification as functional logit regression, linear discriminat analysis and their es- timation based on functional principal component analy- sis and functional PLS are presented in Section 4. Finally, a Section of conclusions and a list of important refer- ences related with the application of FDA methods in chemometrics are also included.
2. Examples of Functional Data Sets in
Chemometrics
Functional data analysis arises mainly to address prob- lems relating to time-like curves. However, in literature you can find numerous applications with spectrometric curves in the field of chemometrics. Spectrometry invol- ves analyzing the spectrum of a substance measured at different wavelengths and defined as a sum of absorption peaks caused by the different chemical components pre- sent in the sample under study.
Absorption spectroscopy is employed as an analytical chemistry tool to determine the presence of a particular substance in a sample and, in many cases, to quantify the amount of the substance present. Infrared and ultravio- let-visible spectroscopy are particularly common in ana- lytical applications. The utility of absorption spectros- copy in chemical analysis is because of its specificity and its quantitative nature. The specificity of absorption spe- ctra allows compounds to be distinguished from one an- other in a mixture. The specificity also allows unknown samples to be identified by comparing a measured spec- trum with a library of reference spectra. Functional sta- tistical methods that take into account the continuous nature of the spectrum can be used to predict the amount of a substance of interest in the studied sample (functio- nal regression) or to classify a set of spectrum curves in different groups (functional discrimination). In what fol- lows we present different examples of chemometrics ap- plications developed to get any of these objectives.
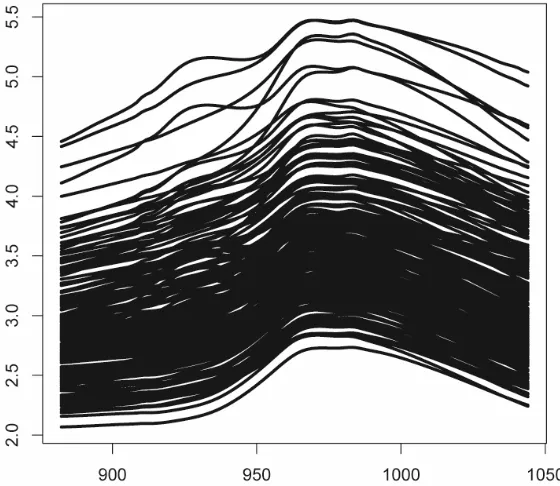
2.1. Predicting the Fatness from the Spectrum of Meat
tional approaches [11]. spectra (recorded on a Tecator Infratec Food and Feed
Analyzer by the near infrared transmission principle) that have been measured from wavelengths 850 to
1050 nm
for 215 fined chopped pieces of pure meat. These curves will be denoted by
xi : 850,1050
The second problem related with this data set was to classify pieces of meat in two groups 1 and G2. The pieces of meat with more than 20% of fatness belong to the first group and those that contain less than 20% of fatness belong to the second. This problem consists of predicting a categorical response variable with cate- gories 1 and 2 that represents different groups of spectra from the functional predictor
G
G
G G
X associated to the observed NIR spectra. A nonparametric curves discri- mination method was applied in [21] to solve this super- vised curves classification problem. The functional PLS approach for functional linear discriminant analysis in- troduced in [3] and B-spline expansions of the spectra have been applied in [11] with the same objective. Both functional approaches provide good error rates in terms of misclassification error compared to other existing clas- sification methods as CART (classification and regres- sion tree procedure) and multivariate PLS, among others. and can be seen in Figure 1. In addition to the spectrum
we have the percentage of fatness that will be denoted by for each piece of meat.
i
y
Two different problems were solved in these publica- tions by using functional methodologies. The first was to determine the relationship between the spectrum (func- tional predictor) and the fatness (scalar response) by es- timating a functional regression model, and to predict the amount of fat of a new piece of meat from its NIR spec- trum. Functional PLS regression on basis expansion of the sampled spectra has been recently introduced in [11] to solve this problem that was previously studied in [1] by using functional nonparametric regression methods. The prediction performance of functional PLS and func- tional PCR has been studied on different simulated and spectrometric data sets and the results compared with those provided by discrete PLS and discrete PCR on the vectors of the observed values of the sample curves. The conclusion was that functional PLS provides better esti- mations of the parameter function than do functional PCR and similar predictions. In addition, it was shown that the predictive ability of discrete and functional models is al- most the same. However, the ability of discrete appro- aches to provide an accurate estimation of the functional parameter is much lower in practice than that of func-
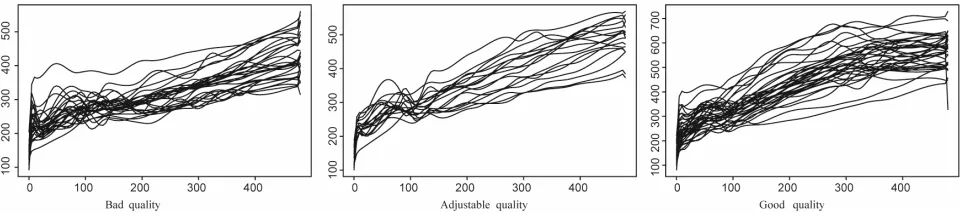
2.2. Classification of Biscuit Quality from the Resistance of Dough
This is other example of curves classification in food industry. The quality of a biscuit depends essentially on the quality of the flour used to make it and the producer, Danone, aims to use only flours that guarantee good pro- duct quality.
[image:3.595.157.437.477.720.2]We have a set of 115 different flours. For a given flour, the resistance of dough is recorded every two seconds during the first 480 seconds of the kneading process. The results is a set of 115 curves of resistance observed at
240 equally spaced time points in the interval
0, 480
that will be denoted by
x ti j :i1,,115;j0,, 240 .
In this case the functional predictor is not the spectrum but a function of time. After kneading, the dough is pro- cessed to obtain biscuits. For each flour, we have the quality (G) of the biscuits that may be Good Ad- justable or Bad In the sample we have 50 biscuits of good quality, 25 adjustable biscuits and 40 bad biscuits (see Figure 2).
G1 ,
G2
G3 .Based on the equivalence between LDA and multiple linear regression, functional PLS regression was used in [3] to estimate the discriminant function and classify the biscuits on the basis of their dough resistance curves. B- spline approximation of the sample curves were used to reduced functional PLS and functional PCR to multivari- ate PLS and multivariate PCR, respectively, so that the discriminant function was easily estimated [11]. Smoo- thed versions of functional LDA-PLS and principal com- ponent logit regression (FPCLoR) based on P-spline ap- proximation of the sample curves with B-spline basis were recently introduced and applied to this data set to solve the problem of lack of smoothness of the estimated functional parameters [22]. A third method based on componentwise logit classification was also applied for comparison purposes [23]. From the statistical analysis of the results, it was concluded that the proposed func- tional methodologies (FPCLoR and LDA-FPLS) have a high classification ability with LDA-FPLS being the one that gives the highest area under ROC curve. The advan- tage of FPCLoR is that allows not only to solve the clas- sification problem but also to estimate the relationship between the response variable (quality of cookies) and the predictor variable (resistance of dough during the kneading process). Several interpretations of the functio- nal parameter based on odds ratios and principal compo- nents were proposed by concluding that good cookies have greater resistance of the dough in the late period and less resistance in the early period. The main features of the curve of resistance of good cookies were also
identified by interpreting the first principal component curve [22].
2.3. Counting Data of Radioactive Isotopos
In the recent paper [24], the radioactivity of 226Ra and 137
Cs is studied modeling both of them as a doubly sto- chastic Poisson process. This means that their intensities are also stochastic processes. Measurements were carried out with IMPO MC24E event counter, attached to a Gei- ger-Mullar probe supplied by Fredeiksen (Denmark). Every 10 seconds the count number has been recorded by the Datalyse software to reach 1000 data and a total of 60 of these series were recorded for each isotope. For both isotopes, the intensity process was estimated by means of functional PCA so that a stochastic estimation in terms of an expansion of uncorrelated random variables was de- rived without assuming any previous model for the inten- sity or its moments. A hypothesis test for assessing the coherence of new observed data with this continuous mo- deling of the intensity was also developed. This result provides a new solution to the problem of calibrating a counting device.
2.4. Other Spectrometric Applications
There are many other applications of FDA in spectrome- try.
Three different instruments at Cargill Inc. (m5, mp5 and mp6 spectrometers) were used to generate the NIR spectra of 80 corn samples (see Figure 3). The spectrum was measured at 2 nm intervals in the wavelength do- main
1100, 2498
(700 observations). These NIR spec- tra have been used in [25] for predicting oil content of the corn samples (multivariate calibration). [image:4.595.58.540.610.717.2]In [26] the aim is to predict the composition (fat, our, sugar, and water content) of biscuit dough pieces using as predictors the NIR reflectance spectrum of dough pieces at 256 equally spaced wavelengths. This regres- sion problem was tackled by calculating the wavelet tran- sforms of the discrete curves and applying a Bayesian va- riable selection method using mixture priors to the mul- tivariate regression of the four responses on wavelet co- efficients.
Functional versions of PCR and PLS, which combine both using B-splines and roughness penalties, are consi- dered in [27] to predict the response variables moisture content and protein content from NIR spectra of 100 wheat samples, measured in 2-nm intervals from 1.100 nm to 2.500 nm.
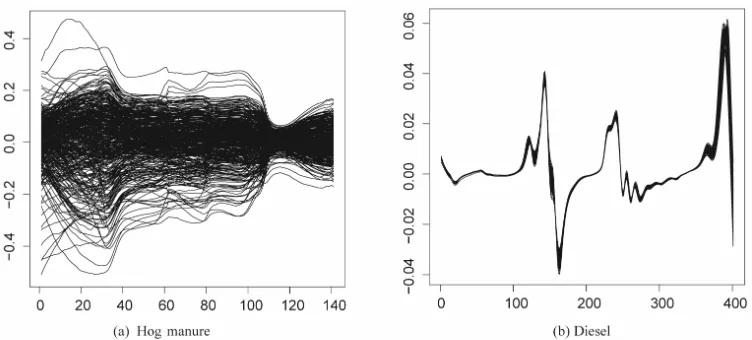
Functional linear regression and functional ANOVA on B-spline approximation of the spectrum are applied in [8] on different spectrometric data sets. In a first example, 420 NIR spectra from hog manure samples ranging from 426 to 1686 nm were used as predictor of the dry matter content (see Figure 4(a)). Different types of spline smoo- thing of this functional data set were compared in [13]. In a second example, the aim is to predict the cetane num- ber of a sample of diesel from its NIR transmission spec- trum. The Diesel data set was measured by the Southwest Research Institute and consists of 246 NIR spectra of 246 samples of diesel and their cetane number (see Figure 4(b)). Two different P-spline penalties for estimating functional PCA were applied to the NIR spectra of diesel data [14]. In a third example, functional analysis of vari- ance (FANOVA) was applied to test the effect of ambi- ent temperature and sample temperature on the spectra. The experiment followed a full factorial design with spe- ctra from manure samples of four types of animals (dairy, beef, calf and hog), preserved at three temperatures (4,
12, +20) and measured at three ambient temperatures (4, 12, +20), having nine replicates, yielding 324 samples in total. The interpretation of the fitted FANOVA model revealed a significant effect of the ambient temperature on the intensity spectrum of manure measured using a diode array instrument. In words of the authors, this te- chnique could be a valuable tool for the investigation and improvement of the robustness of spectroscopic tech- niques.
The results provided by functional linear regression and B-spline smoothing of the curves of spectrum were compared with those given by multivariate PLS regres- sion showing that the predictive power of both, functio- nal and discrete approaches, is similar. It was also obser- ved that simultaneous selection of the degree of smooth- ness (degree of B-splines) and the dimensionality reduc-tion (number of basis funcreduc-tions) based on the cross-va- lidation prediction error may be suboptimal.
[image:5.595.67.537.410.521.2]In the next Section, we are going to present a review of the main results related with the functional data analy- sis methodologies applied in chemometrics. These can be classified in two main groups. First, functional regression whose objective is to predict a scalar response is variable from a functional predictor whose observations are curves. Second, classification of curves in the groups is defined by the categories of a categorical response variable.
Figure 3. Curves of absorbance of 80 corn samples measured with three different spectrometers.
[image:5.595.111.487.549.719.2]res-
3. Functional Calibra
Let us consider the problem of predicting a scalar
tion
ponse variable Y from a functional predictor
:
.X X t tT
In spectrometry, usually represents some chemical va
Y
nd
riable of interest a X the NIR spectra (absorbance) of the analyzed component whose observations are really curves measured at a fine grid of wavelengths. In all the paper we will consider the usual case of a functional pre- dictor whose realizations belong to the space L T2
of square integrable functions on T.In applications with real data we have a random sam- pl
e of pairs
x ti ,yi :tT i; 1,,nthat can be seen as realizations of the functional predictor
X and the response variable Y, respectively. The rela- nship between the function predictor
tio al X and the
scalar response Y can be established from the functio- nal regression mo el
y
d
i
i F xi (1.1)
where i are independent random errors and F is an
operato hat must be estimated. By assuming linearity on the operator
r t
F we obtain the functional linear regres- sion model with scalar response [4] given by
d .i T i
y
t x t ti (1.2) If we do not assume any parametric form for F, the m3.1. Functional Linear Regression
nal linear
odel 0.1 is known as functional nonparametric regres- sion model [6]. A review of the main results and spectro- scopy applications of this model appears in [20].
The estimation of the parameters of the functio
model 0.2 is an ill-posed problem because of the infinite dimension of the predictor space. In addition, we only have in practice discrete observations of each sample path at a finite set of knots
xij x ti ij : j1,,m ii, 1,,n ,that could even be unequally spaced and different for the
g excessive local fluctuation in the es
sample individuals. A way of avoidin
timated parameter function would be to use a rough- ness penalty approach on basis expansion of the sample curves [4,13]. One of the most common solutions to solve this problem is to assume that both the sample cur- ves and the parameter function belong to a finite space generated by a basis of functions
j t :tT j; 1,,K
,so that they admit the following basis expa sions: n
,
.K K
i ij j k k
1 1
j k
x t
t t
t
(1.3)
This way, the functional linear regression m equivalent to the multiple linear model
odel 0.2 is
,
Y 1 A (1.4)
1, , n
Y y y ,
1,,K
, An K
ij withand K K
jk
j
t k t d ,t
calibration problem turns into mu
T
c-tional tiv
a-so that the fun l ariate calibr
le linear model. First, an appropriate basis must be se
A and PLS Based Solutions
tor p Functional principal components tion.
Several problems are related to the estimation of this multip
lected taking into account the characteristics of the observed sample curves. In the case of absorbance spec-tra analyzed in spectrometric applications, the use of a B-spline basis was shown to have some similarity with the physical origin of a spectrum as the result of light absorbance by molecular bonds. The main advantage of this functional reconstruction of spectra from discrete observations lies in its combination of dimensionality reduction (number of basis functions) and smoothing (de- gree of B-spline basis functions). Assuming some error in the measurements (noisy data), the basis coefficients of each sampled spectrum are usually obtained by least squares approximation (spline regression) on the observ- ed absorbance at different wavelengths [8]. Second, least squares estimation of the parameters of model 1.4 is usu- ally affected of multicollinearity because of the high cor- relation between the columns of its design matrix. On the other hand, the number of basis functions needed to get an accurate approximation of the sample curves could be higher than the sample size so that a reduction dimension methodology has to be used. Both problems, high multi- collinearity and high dimensionality, are usually solved by regressing the response variable on a set of orthogonal covariates as for example principal components or partial least squares components [11]. In the next Section we present the generalization of principal component regres- sion and partial least squares regression to the case of a functional predictor.
3.2. Functional PC (FPCR/FPLS)
Let us assume without loss of generality that the predic- rocess is center.
d ,j j
z
x t w t tT
where the weight functions are the solutions to the fol- lowing optimization criteria:
Functional PCR
Max Varw
dTx t w t t
When the sample curves admit a basis expansion like in Equation 1.3, functional PCA is equivalent to mu ria
2
. . d 1; l d 0 1.
T T
r t
w t t
w t w t t l jltiva- te PCA of matrix A1 2, so that the weight functions
j
w are computed by diagonalizing the covariance ma- trix of A1 2 (see th f in [28]).
Functional PLS
2 1
v Txj t w t d
e proo
j1
0 t y, ,
Max Cow 2
. . 1,
r t w where x0
t x t
, t Tand y0 y
. gression The j-th PLS step is ar e
of
concluded with the line r
1
j
x t and yj1
d ,
j
t t so
1
,j j
j j
on
T
z
x 1
j t j
w that
x t x t p t z tT
1 ,
j j j j
y y c z
where
j1
2j j
p t x t t tj
and
1 2
.
j
j j
c y t tj
As in the case of functional PCR, functional PLS is equivalent to multivariate PLS of Y on matrix A1 2
w
as been reduced to regression of Y on a set of prin- ci
hen the sample curves are expressed in terms of basis functions (see [11] for a detailed study).
These results are very important from a computational point of view because reduce functional PCR and PLS to multivariate PCR and PLS on a transformation of the matrix of basis coefficients of the sample curves. The main problem is again to approximate the basis coeffi- cients of sample curves from their discrete observations at a finite set of knots (times, wavelengths...) and to se- lect an appropriate basis taking into account the main features of the observed curves. In the majority of cases it is assumed that data are observed with errors so that some type of smoothing is necessary. The most common basis are trigonometric functions used for periodic curves, B-splines for smooth curves and wavelets for curves with a strong local behavior. The basis coefficients can be approximated by using classic least squares approxima- tion or penalizing the roughness of each sample curve [4].
In any of the two consider dimension reduction ap- proaches, functional PCR and functional PLS, the prob-
lem h
pal or PLS components of A1 2. In both cases the computational algorithm has the steps
Computation and selection by cross-validation of a set of m components
1 2
n m n K K m
Z A V
Linear regression of Y on the m components
ˆm m m
Y 1 Z
FPCR or FPLS estimation of the parameter function
K
m
m
k k t t
1 k 1 2 . m m V with4. Curves Classification
now consider de problem of predicting a categori- ith response categories Let us
cal response variable G w
G G1, 2,,GS
from a functional predictor X, whichfi
ries. Nonparam ati
ession model for binary and mul- d to the case of a is equivalent to the problem of classification of the sam- ple curves in the groups de ned by the response catego- etric methods for curve classific on were developed in [21] and its application to classify spectro- metric data revised in [20]. Functional logit regression and functional linear discriminant analysis that have been used in different applications with chemometrics data are summarized hereafter.
4.1. Functional Logit Regression
The multiple logit regr
tinomial responses has been generalize functional response [16].
Associated to a sample of observations (curves) of the functional predictor
x ti
:tT i, 1,,n
, we have a sample of observations of the categorical response Ggiven by n response vectors
yi1,,yiS
of dimen-sion S
1 if is observed for
0 othercase. s i is G X
y x (1.5)
Each of these observations is generated by a multino- mial distribution M
1;i1,,iS
with
,is P G G X ts x ti
S
and . Taking into account that
is redundant, we can denote by
1 is 1 1, ,
s i n
iS
y yi
yi1, ,yi S, 1
, with mean vector the vector response for subject i
i
i1, , i S, 1
.E Y
i
Then, -
sponse model is a particular case of generalized linear the multinomial re
is
y isis
with link
s
g
i s
Ts
t x ti d ,t s1,,S1, (1.7) where is are independent and centered errors, and sk and s
tnctio
a set of parameters to be estimated. As lin fu n components gs we can consider the c
types of logit transformations
lassical
is s i
l g [1
a bas
6]. For example, baseline-category logits that pair each respo with eline-category (in this case the last) are used for nominal responses
nse
log .
is is iS
l
The equation that expresses baseline-category logit models directly in terms of response probabilities is
1 exp d is Ss T i s s
exp d
,
1, , , 1, , ,
s Tx ti s t t
x t t t
s S i n
withThe estimation of the parameter of the functional logit model presents the same problems that the functional linear model 0.2. In the case of basis expansion o
and the parameter function, the functional lo
S 0,S t 0 .
f the sample curves
git model is equivalent to a multiple logit model. In matrix form the model is given by
, 1, , 1
s s s
L 1 A s S (1.8) for each vector of logit transformations Ls
l1s,,lns
and each vector of parameter basis coefficients
1,, .
s s Ks
The problems of multicollinearity an
multinomial lo
or PLS components As in functional linear regression, fu
d high dimension that affect this model are solved again by - git regression on a reduced set of uncorrelated principal
.
nctional principal component logit regression is reduc- ed to multiple principal component logit regression on the matrix 1 2
.
A Different type of functional PCAs are considered in [17]. As an alternative, a functional PLS logit regression model for binary response that has as co- variates a set of partial least squares components of the design matrix A of the multiple logit model 0.8 was in- troduced in [18]. There are different criteria in literature to select principal components in regression methods. In the functional binary logit model, the classical method that consists of cluding principal components in the or- der given by explained variability and the one that inclu- des them in the order given by a stepwise method based on conditional likelihood ratio test were compared on si- mulated data in [17]. The optimum number of principal
ally determined by using different criteria based on mini- mization the leave-one-out prediction error or the leave- one-out misclassification rate via cross-validation.
4.2. Functional Linear Discriminant Analysis
Linear discriminant analysis (LDA) in the functional data context aims to find linear combinations
d , 2
,TX t t t L T
so that the variance between classes is maximized with respect to the total variance
Var EX t Y
max .
Var X t
(binary response) and LDA and canonical correlation analysis (multip e response), a functional PLS approach for LDA with a functional pre- dictor was proposed in [3].
Taking into account the equivalence between LDA and multiple linear regression
l
When the response Y is binary
S2 ,
the discri- minant function is the parameter function of the linear regression of Y on the functional predictorX with Y recoded by Y p0 p1 if Y 1 and Y p1 p0 if Y0. Then, FPCR and FPLS regression of Y on a basis expansion of X provides different approximations for the discriminant variable (score) given by
m d ,PLS X Tx t t t
where m
t is the estimation of the parameter func- tion of the functional linear model obtained by using FPCR or FPLS in terms of a set of m components. When the response Y is multiple the discri-minant functions
S2 ,
s
are the pa ons of linear
rameter functi the regression of Y on the functional predictor
X with Y defined as de vector
Y1,,YS1
of dummy variables associated to the categorical res-y where ctrum is a functional variable whose s of wavelength. The work has ponse G and defined by expression 0.6. FPCR and FPLS on basis expansion of sample curves can be us- ed again to obtain the discriminant variables.
5. Conclusions
A review of the FDA methodologies most used in che- mometrics has been presented in this work next to diffe- rent applications, most of which are in spectroscop
the absorbance spe observations are function in
components and PLS components (model order) is usu-
part (Sections 3 and 4) gives a brief summary of the theoretical framework on functional regression and curv- es classification methods.
From the revised material we can conclude that func- tional calibration methods (functional PCR, functional PLS and functional nonparametric regression) and func- tional methods for curve classification (functional logit regression, functional LDA and functional nonparam cl
ation to Spectrometric Data,” Compu-
, Vol. 17, No. 4, 2002, pp. 545-564. http://dx.doi.org/10.1007/s001800200126
etric assification) have similar prediction ability for their corresponding discrete versions to analyze data that are obtained as observations of curves at a finite set of knots (wavelengths, time...). However, the FDA techniques take into account the correlation structure among the discrete observed values of a functional variable and, as a conse- quence, provide in many cases a more accurate estima- tion of the functional parameter that is very important to determine the relationship between the response and the functional predictor.
REFERENCES
[1] F. Ferraty and P. View, “The Functional Nonparametric Model and Applic
tational Statistics
[2] H. Zhu and D. Cox, “A Functional Generalized Linear Model with Curve Selection in Cervical Pre-Cancer Di- agnosis Using Fluorescence Spectroscopy,” IMS Lecture Notes-Monograph Series Optimality: The Third Erich L. Lehmann Symposium, Vol. 57, 2009, pp. 173-189. http://dx.doi.org/10.1214/09-LNMS5711
[3] C. Preda, G. Saporta and C. Lévéder, “PLS Classification for Functional Data,” Computational Statistics, Vol. 22, No. 2, 2007, pp. 223-235.
http://dx.doi.org/10.1007/s00180-007-0041-4
[4] J. O. Ramsay and B. W. Silverman, “Functional Data Ana-
rlin, 2002.
tional Data
. Ocaña,
,” lysis,” 2nd Edition, Springer, Berlin, 2005.
[5] J. O. Ramsay and B. W. Silverman, “Applied Functional Data Analysis,” Springer, Be
[6] F. Ferraty and P. View, “Nonparametric Func Analysis. Theory and Practice,” Springer, Berlin, 2006.
[7] M. J. Valderrama, A. M. Aguilera and F. A “Pre- dicción Dinámica Mediante Análisis de Datos Funcion- ales, Hespérides-La Muralla,” 2000.
[8] W. Saeys, B. De Ketelaere and P. Dairus, “Potential Appli- cations of Functional Data Analysis in Chemometrics
Journal of Chemometrics, Vol. 22, No. 5, 2008, pp. 335- 344. http://dx.doi.org/10.1002/cem.1129
[9] C. Jiang and E. B. Martin, “Functional Data Analysis for the Development of a Calibration Model for Near-Infra- red,” Computer Aided Chemical Engineering, Vol. 25, 2008, pp. 683-688.
http://dx.doi.org/10.1016/S1570-7946(08)80119-8
[10] C. Preda and G. Saporta, “PLS Regression on a Stochas- tic Process,” Computational Statistics and Data Analysis, Vol. 48, No. 1, 2005, pp. 149-158.
http://dx.doi.org/10.1016/j.csda.2003.10.003
[11] A. M. Aguilera, M. Escabias, C. Preda and G. S “Using Basis Expansions for Estimating Functiona
aporta, l PLS
007 Regression. Applications with Chemometric Data,” Che- mometrics and Intelligent Laboratory Systems, Vol. 104, No. 2, 2010, pp. 289-305.
http://dx.doi.org/10.1016/j.chemolab.2010.09.
016/j.chemolab.2008.06.009 [12] N. Kramer, A.-L. Boulesteix and G. Tutz, “Penalized Par-
tial Least Squares with Applications to B-Spline Trans- formations and Functional Data,” Chemometrics and In- telligent Laboratory Systems, Vol. 94, No. 1, 2008, pp. 60-69. http://dx.doi.org/10.1
rative [13] A. M. Aguilera and M. C. Aguilera-Morillo, “Compa
Study of Different B-Spline Approaches for Functional Data,” Mathematical and Computer Modelling, 2013, in press. http://dx.doi.org/10.1016/j.mcm.2013.04.007
[14] A. M. Aguilera and M. C. Aguilera-Morillo, “Penalized PCA Approaches for B-Spline Expansions of Smooth Functional Data,” Applied Mathematics and Computation, Vol. 219, No. 14, 2013, pp. 7805-7819.
http://dx.doi.org/10.1016/j.amc.2013.02.009
[15] M. C. Aguilera-Morillo, A. M. Aguilera, M. Escabias and M. J. Valderrama, “Penalized Spline Approaches for Func- tional Logit Regression,” TEST, Vol. 22, No. 2, 2013, pp. 251-277. http://dx.doi.org/10.1007/s11749-012-0307-1
[16] A. M. Aguilera and M. Escabias, “Solving Multi rity in Functional Multinomial Logit Models
collinea- for Nominal and Ordinal Responses,” In: S. Dabo-Niang and F. Ferra- ty, Eds., Functional and Operatorial Statistics, Springer, Berlin, 2008.
http://dx.doi.org/10.1007/978-3-7908-2062-1_2
[17] M. Escabias, A. M. Aguilera and M. J. Valderrama, “Prin- cipal Component Estimation of Functional Logistic Re- gression: Discussion of Two Different Approaches,” Jour- nal of Nonparametric Statistics, Vol. 16, No. 3-4, 2004, pp. 365-384.
http://dx.doi.org/10.1080/10485250310001624738
[18] M. Escabias, A. M. Aguilera and M. J. Valderrama, “Fun- ctional PLS Logit Regression Model,” Computational Sta- tistics and Data Analysis, Vol. 51, No. 10, 2007, pp. 4891- 4902. http://dx.doi.org/10.1016/j.csda.2006.08.011 [19] M. Escabias and A. M. Aguilera, “Functional PCA
Base-Line Logit Models with Applications to the C and lassi-
s,” In:
. View, “Curves Discrimination: A Non- fication of NIR Spectra,” Journal of Classification, 2013, under revision.
[20] F. Ferraty, A. Goia and P. Vieu, “Nonparametric Functio- nal Methods: New Tools for Chemometric Analysi W. Hardle, M. Yuichi and P. Vieu, Eds., Statistical Meth- ods for Biostatistics and Related Fields, Springer, Berlin, 2007, pp. 245-263.
[21] F. Ferraty and P
parametric Functional Approach,” Computational Statis- tics and Data Analysis, Vol. 44, No. 1-2, 2003, pp. 161- 173. http://dx.doi.org/10.1016/S0167-9473(03)00032-X
-[23] A. Delaigle, P. Hall and N. Bathia, “Componentwise Cla
ssification and Clustering of Functional Data,” Biometri- ka, Vol. 99, No. 2, 2012, pp. 299-313.
http://dx.doi.org/10.1093/biomet/ass003
[24] P. R. Bouzas, N. Ruiz-Fuentes, A. Matilla, A. M. Aguilera and M. J. Valderrama, “A Cox Model for Radioactive Coun-
0.06.002 ting Measure: Inference on the Intensity Process,” Che- mometrics and Intelligent Laboratory Systems, Vol. 103, No. 2, 2010, pp. 116-121.
http://dx.doi.org/10.1016/j.chemolab.201
[25] H. Tan and S. D. Brown, “Multivariate Calibration of Spec- tral Data Using Dual-Domain Regression Analysis,” Ana- lytica Chimica Acta, Vol. 490, No. 1-2, 2003, pp. 291- 301. http://dx.doi.org/10.1016/S0003-2670(03)00351-9
[26] P. J. Brown, T. Fearn and M. Vannucci, “Bayesian
Wave-n
let Regression on Curves with Application to a Spectro- scopic Calibration Problem,” Journal of the America Statistical Association, Applications and Case Studies, Vol. 96, No. 454, 2001, pp. 398-408.
http://dx.doi.org/10.1198/016214501753168118
[27] P. T. Reiss and R. T. Ogden, “Functional Principal Compo- nent Regression and Functional Part
Journal of the American Statistical Association, V ial Least Squares,”
ol. 102, No. 479, 2007, pp. 984-996.
http://dx.doi.org/10.1198/016214507000000527
[28] F. A. Ocaña, A. M. Aguilera and M. Escabias, “Computa- tional Considerations in Functio
Analysis,” Computational Statistics, Vol. 22, No.
nal Principal Component 3, 2007, pp. 449-465.