symphony math
teacher guide
Copyright and Trademark Notice
2012 © Symphony Learning, LLC. All rights reserved. Symphony Math is a trademark of Symphony Learning, LLC. Director is a trademark of Adobe.
Macintosh is a trademark of Apple Computer, Inc. MS Windows is a trademark of Microsoft Corporation. Symphony Math has been created with Adobe Director software. Published by: Symphony Learning, LLC. PO Box 5491 Hanover, NH 03755 Phone: 800.234.3030 www.symphonylearning.com [email protected]
Information in this document is subject to change without notice and does not represent a commitment on the part of Symphony Learning, LLC. The software described in this document is furnished under a license agreement or non-disclosure agreement. The software may be used only in accordance with the terms of the agreement. This docu-ment and the software described within it may not, in whole or in part, be copied, photocopied, reproduced, translated, or reduced to any electronic medium or machine-readable form other than that which has been specified herein with -out prior written consent from Symphony Learning, LLC.
Acknowledgments: We thank the many math researchers, teachers and cognitive scientists for their research and practice in the field of mathematics education upon which this program is based.
contents
symphony math
01 overview of the symphony math program . . . . 1
introduction . . . . 1
Screener . . . . 1
Benchmarker . . . . 1
Intervention . . . . 2
The Symphony Approach . . . . 2
Efficient Implementation . . . . 4
Using the Symphony Math Program . . . . 6
Alternative Uses of Symphony Math . . . . 7
02 symphony math screener . . . . 8
Introduction . . . . 8
Defining Risk . . . . 8
Screener Reports . . . . 10
Three Testing Windows Each School Year . . . . 11
03 symphony math benchmarker . . . . 13
Introduction . . . . 13
Benchmarker Methodology . . . . 13
Benchmarker Norm-Referenced Scores . . . . 14
04 symphony math intervention . . . . 18
Introduction . . . . 18
The Big Ideas of Mathematics . . . . 18
Multiple Ways of Knowing . . . . 20
Learning Through Thinking and Making Connections . . . . 24
Dynamic Branching Allows Students to Learn at Their Own Level . . . . 26
Comprehensive Reports . . . . 27
Who Can Use Symphony Math? . . . . 28
05 intervention scope and sequence . . . . 29
Introduction . . . . 29
The Seventeen Stages of Symphony Math . . . . 30
Big Idea #1: Quantity . . . . 30
Big Idea #4: Hierarchical Groupings with Parts-to-Whole . . . . 36
Big Idea #5: Repeated Equal Groupings . . . . 39
Big Idea #6: Repeated Equal Groupings with Parts-to-Whole . . . . 41
06 setting up accounts and classes . . . . 44
Introduction . . . . 44
System Requirements for the Symphony Administration Panel . . . . 44
Logging in to the Symphony Math Administration Panel . . . . 45
Symphony Dashboard . . . . 45
Creating Student Accounts and Your Class . . . . 46
Using the Import Tab to Create Student Accounts and Classes . . . . 49
Introduction . . . . 53
System Requirements . . . . 53
07 installing symphony math intervention . . . . 53
Introduction . . . . 53
System Requirements . . . . 53
Download and Install the Symphony Math Application . . . . 54
Student Sign In . . . . 56
Network Installation Instructions . . . . 56
Set Up the School-To-Home Option . . . . 57
08 district set up . . . . 58
Introduction . . . . 58
Compatible Web Browsers for Administration Panel . . . . 58
Configuring the Administration Panel . . . . 59
Logging in to the Symphony Math Administration Panel . . . . 59
Changing District Settings . . . . 60
Creating School Accounts . . . . 62
Creating Student Accounts . . . . 63
Using the Import Tab to Create Student Accounts and Classes . . . . 64
Installing the Symphony Math Intervention Application . . . . 68
System Requirements . . . . 68
Ensuring Student Access to the Symphony Web Servers . . . . 68
Deciding Between Local and Network Installation . . . . 69
09 installing intervention at home . . . . 70
Introduction . . . . 70
System Requirements . . . . 70
Download and Install the Symphony Math Intervention Application . . . . 71
Student Signin . . . . 72
10 using symphony math intervention . . . . 73
Introduction . . . . 73
The Student Signin Screen . . . . 73
The Student Scoreboard Screen . . . . 74
The Thinking Round . . . . 75
The Help Button . . . . 77
11 the intervention dashboard . . . . 79
Overview of the Dashboard . . . . 79
Status Over Past Four Weeks . . . . 80
The Dashboard Categories . . . . 81
Understanding the Gauges . . . . 81
How to Remedy Common Implementation Issues . . . . 83
The Overall Status Statistics . . . . 84
Understanding the Progress Over Time Graphs . . . . 84
Other Important Dashboard Features . . . . 86
12 reports . . . . 87
Overview of Reports . . . . 87
Symphony Math Reports . . . . 88
Selecting Reports . . . . 89
Screener Reports . . . . 90
Compare Groups: Screener Status . . . . 90
Benchmarker Reports . . . . 93
Intervention Reports . . . . 98
13 managing user accounts . . . . 114
Staff Access . . . .114
Managing School Accounts Within a District . . . .116
Creating Staff Accounts . . . .117
Managing Student Accounts . . . .118
Managing Classes . . . . 122
14 symphony math intervention advanced settings . . . . 124
Introduction . . . . 124
Settings Panel . . . . 124
Account Information . . . . 125
Student Settings . . . . 126
Network Settings . . . . 127
Graphics and Sound Settings . . . . 127
Administration . . . . 129
15 technical troubleshooting . . . . 130
Ensuring Student Access to the Symphony Web Servers . . . . 130
Deciding Between Local and Network Installation . . . .131
Importing Students, Teachers, and Classes . . . . 132
Fixing Program Slowness, Crashes, and Error Messages . . . . 136
Symphony Math Intervervention Automatic Updates . . . . 137
Symphony Math Intervention School-to-Home Use . . . . 137
16 preparing for a new school year . . . . 139
Option 1: Delete All Students and Re-Import School Roster . . . . 140
17 frequently asked questions . . . . 142
Assessment . . . . 142
Using Symphony Math Intervention . . . . 144
Symphony Math Intervention Installation & Setup . . . . 147
Symphony Math Administration Panel . . . . 148
Contacting Technical Support . . . . 148
Appendices . . . . 149
Appendix A: Symphony Math Intervention Scope & Sequence . . . . 149
Appendix B: Symphony Math Intervention Word List . . . . 155
Appendix C: Assessment Criteria and Specifications . . . . 156
introduction
Symphony Math is a three-step program that identifies and supports students who need help with
math. Each step in the SymphonyMath process is supported by one of the program tools: Screener, Benchmarker, and Intervention. Together the three tools offer a framework for identifying students
at risk for math failure, quantifying their rate of progress, and filling in gaps in their mathematical
development.
Symphony Math efficiently identifies students in need of additional support in mathematics, then pro -vides the tools to track and support the effort to close the gap with their peer group. The program is suitable for students in kindergarten through grade eight. The assessments are designed to measure learning against the Common Core State Standards for Mathematics. The three tools can be used individually or together to support Response to Intervention.
Screener
Symphony Math Screener is a quick and accurate tool for identifying which students in a school (or
district) are at-risk or borderline for math failure. With an average test time of five minutes, Screener quickly determines a student’s at-risk status. Screener is given three times a year (Fall/Winter/Spring).
Benchmarker
Symphony Math Benchmarker is a computer adaptive test (CAT) that determines the instructional
level of each student and quantifies their progress over the course of the school year. The average
test time for Benchmarker is twenty minutes. The assessment provides a standard score, grade-level
overview of the
symphony math program
equivalent, and percentile rank for each student. As students repeat the assessments a second and third time, Benchmarker provides scores that show the rate of student learning from one testing period to the next.
Intervention
Symphony Math Intervention helps address one of the primary causes of poor math performance: Weak foundation skills. The Intervention tool provides students with the experience of learning and thinking about the most important mathematical concepts through a systematic progression.
The Symphony Approach
Many students have not become proficient in math because they have not mastered the foundational concepts with sufficient depth. Symphony Math philosophy emphasizes the development of a deeper understanding of critical mathematical concepts. There are several pedagogic techniques the program employs to support the development of a profound understanding of mathematics:
l Symphony Math Screener and Benchmarker probe for in-depth understanding by using technology-enhanced test items. Symphony assessment problems challenge students to
produce multiple correct solutions, demonstrate fluency, graph lines, use measurement
tools, and solve for the exact answer, instead of providing only a simple, multiple choice. These technology-enhanced problems require students to demonstrate a deeper level of understanding to produce correct responses.
l Symphony Math Screener & Benchmarker are multi-skill assessments. They do not focus on
one or two specific skills, but have a databank that contains several assessment problems
l Symphony Math assessments are suitable for younger students. This allows educators to
identify students at risk for math failure in the first month of kindergarten, instead of waiting
until grade 4 when end-of-year grade 3 results become available. Instructional supports can be implemented early in the student’s learning career, to close the gap with peers before it becomes unmanageably large.
l Symphony Math conforms to the Common Core State Standards (CCSS), and adopts the same commitment to in-depth learning and understanding. By aligning its assessments to the CCSS, Symphony Math enables schools to focus on assessing a narrow range of target
concepts, at the in-depth and rigorous level specified by the CCSS.
l Symphony Math supports Response to Intervention, helping assess and develop indepth understanding of mathematics. Some screeners used for Response to Intervention only
measure fluency, or focus on a single skill, and are not aligned to the depth and rigor of
the Common Core State Standards. However, using Symphony Math minimizes the chance
that an at-risk student might quickly learn a skill needed to pass the fluency screener (e.g.
single digit addition) without acquiring the in-depth and rigorous understanding necessary to succeed in a CCSS curriculum.
l The Symphony Math Benchmarker provides growth scores for each student, class, grade, and school. Growth scores may be used to ensure that ALL students are making expected progress: With Benchmarker growth data at hand, schools can readily identify students who -- while not currently on the edge of the pass-fail bubble -- still are not showing appropriate advancement. Resources may therefore be allocated to help those students just beginning to fall behind, Benchmarker supports students who may not be making appropriate growth, as well as assisting those well below the pass-fail bubble who will need two to three years to achieve
Efficient Implementation
Having accurate, effective assessment and intervention tools is often not enough to successfully man-age a large-scale, data-driven educational program. The tools must also be easy to use, and consume
as little instructional time as possible. That’s why efficiency of implementation forms another key
component of Symphony Math philosophy. If the screening and benchmarking process takes too long,
educators do not have sufficient time to teach their students during the intervention phase.
Symphony Math employs the following features to offer an instructional support system that is easy to use and consumes as little instructional time as possible:
l Symphony Screener and Benchmarker run in a web browser. The student sits at the com-puter, enters the school account number, types his or her username and password, then begins the assessment immediately. There is no software to install.
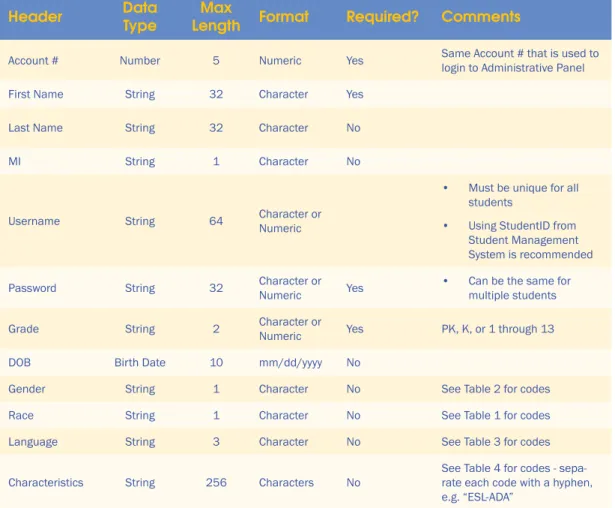
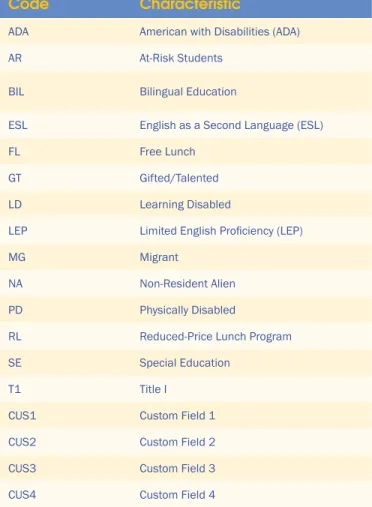
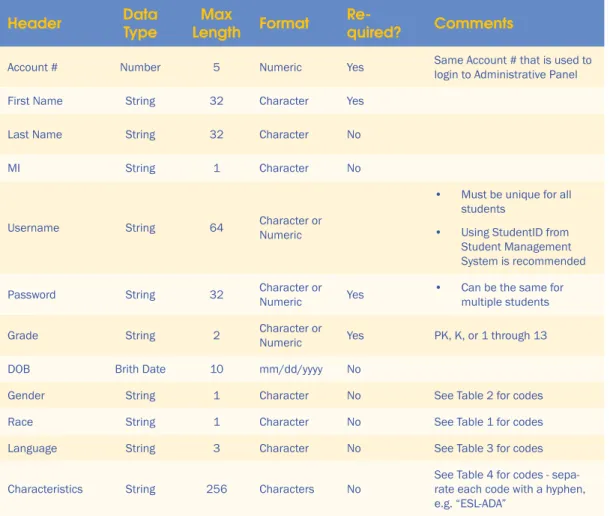
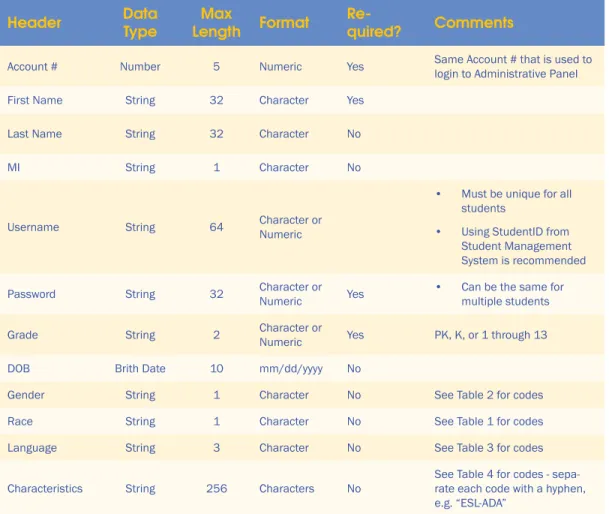
l Student names, passwords and demographic data can either be entered manually via a web browser (for a small class), or the entire roster of student names and associated information can be imported for a school or district.
l The assessments are quick – 5 minutes for Screener and 20 minutes on average for Bench-marker. The assessments are online, which means no printing or grading of tests.
l The assessments can be group administered, since most students can complete them
inde-pendently. Audio narration supports non-fluent readers, and Spanish audio is also available.
l Results are immediately available to authorized personnel, from the classroom teacher all
Using the Symphony Math Program
The three Symphony Math tools can be used individually or together as an integrated system. Indi-vidual use might consist of only using Screener to quickly identify at-risk students across a district. Benchmarker can be used as a stand-alone tool to measure student growth over the course of the school year. Intervention could be used as a school-wide math support program, perhaps where
previ-ous data has already identified that the majority of students are at risk for math failure, and Interven-tion should part of the core curriculum.
Below is an outline of how Symphony Math can be implemented as an integrated system to identify and support students at-risk for math failure.
Step 1: Screen All Students
At the beginning of the school year, screen all students in kindergarten through grade eight with Symphony Math Screener. Students can login from desktop computers using a web browser. Screener
takes about five minutes, and returns one of three outcomes for each student:
l Not at-risk – the student is above the at-risk threshold.
l Borderline – the student is very close to the at-risk threshold and should be given the longer Benchmarker assessment.
l At-risk – the student is below the at-risk threshold and should be given the longer.
Students take the screener in the fall, winter and spring. Screener consists of eight test items that are at or near the at-risk threshold for the student’s grade level. For example, if the risk threshold is set to the 20th percentile, a grade two student will see eight test items during their screening that are at or near the 20th percentile for second grade students. Immediately after the screening, teachers can access online reports that document which students are not at-risk, borderline, or at-risk.
Step 2: Benchmark At-Risk and Borderline Students
The second step in the Symphony Math process is benchmarking students with an at-risk or
borderline status. Benchmarking each student identified as at-risk or borderline gives the student
an opportunity to reject their status and demonstrate more of their mathematical knowledge. The benchmarking process also provides a baseline diagnostic score, which helps determine a student’s instructional level, and charts the student’s growth over the course of the school year.
Step 3: Intervene with At-Risk and Borderline Students
The third step in the Symphony Math process is implementing Intervention with students identified
as borderline or at-risk. Intervention requires a minimum of 45 minutes of use each week, and
is designed to help students fill in gaps in their foundational understanding of mathematics. This
could be a part of a student’s tier II or tier III intervention program in the RtI framework. Fidelity of implementation is vital, as students at-risk for math failure often need intensive and consistent practice with foundational concepts in order to develop mastery.
Alternative Uses of Symphony Math
Some schools only use Symphony Math Intervention, forgoing screening and benchmarking. Their data-driven decision making has lead them to conclude that more than twenty percent of their entire school population is at-risk for math failure, and therefore needs intensive support at the tier I level.
Many schools find it more efficient to administer Screener and Benchmarker together in their
integrated form to all students: The 20-minute average test time for Benchmarker is not prohibitively long, and they want to track the growth of all students. This is the default setting for Symphony Math, where Screener and Benchmarker are given together in one 20-minute session.
Ideally, each school or district will use the Symphony Math tools in the way that makes the most sense for their students, and which produces the most optimal outcomes.
Introduction
Symphony Math Screener quickly and accurately identifies students at risk for math failure. Screener is especially useful for large schools or districts that want to screen all students, but do not have the time, or computer availability, for longer tests. The assessment time for Screener averages less than 5 minutes per student.
Defining Risk
The first step in implementing Screener is setting the cut score definition of “at-risk.” When a student is said to be “at-risk for mathematics failure,” there must be a definition of what “at-risk” means. In the context of Response to Intervention, “at-risk” is typically defined as a cut score based on the percentile rank of a student. The 25th percentile is a common cut score for the definition of at-risk: All students who are at or below the 25th percentile are deemed “at-risk,” and should be monitored
more closely.
In a school or district with many students performing below grade level, using the 25th percentile may be inappropriate. If a school screens all of its students using a cut score at the 25th percentile, then
finds half of the students at-risk, the school could not easily provide progress monitoring and interven -tions for all of those students. In such cases, a lower cut score should be considered, one that is more likely to identify 15 to 20 percent of the students as being at-risk.
On the other hand, for a school or district that has many students performing at or above grade level, a higher cut score may be appropriate. Some schools might use the 40th percentile cut score,
because it effectively identifies the struggling learners of that particular school system.
symphony math
screener
Administrators
can define the
At-Risk threshold from the online Administration Panel.
Schools that are not using a multi-tiered system may be more comfortable defining risk in terms of
months below grade level. For example: At the beginning of the school year, a grade three student
testing at the 2.1 grade level is 12 months below grade level. If risk is defined as 12 months below grade level, this student would be positively identified. The 12-Months-Below grade level setting
can make more intuitive sense than the more abstract percentile setting. If a teacher knows that a student is one year (or 18 months, or 24 months) below grade level, it makes it very clear that a different instructional approach will be necessary.
If a school or district wants to experiment with different risk definitions, we recommend assessing
students with the longer Benchmarker assessment tool. After students have been benchmarked, the
risk definition can be modified in the Administration Panel, and reports reviewed to determine the appropriateness of the risk definition. The reports will update dynamically and display the distribution
of at-risk students each time Benchmarker receives new data. If only Screener is administered,
Screener Reports
Screener produces one of three outcomes for each student tested:
l Not at-risk: The student is above the at-risk threshold. If at-risk is defined as the 25th percentile, a student identified as not at-risk is at least five percentile points above the 25th
percentile.
l Borderline: the student is very close to the at-risk threshold, and should be given the longer Benchmarker assessment to better determine his or her status. If at-risk is defined as the 25th percentile, a student identified as borderline is between the 20th and 30th percentiles. Borderline status results from a score that is plus or minus five percentile points from the
at-risk cut score.
l At-risk: The student is below the at-risk threshold, and should be given the longer
Benchmarker assessment to confirm the positive result. If the at-risk definition is set to the 25th percentile, a student identified is at-risk is at least below the 20th percentile, since the borderline status is used for plus or minus five percentile points.
Three Testing Windows Each School Year
Symphony Math Screener may be administered to a student three times each school year. It is
possible that a student not identified as at-risk after the fall screening will be identified as at-risk at the winter or spring screening, if the student did not make sufficient progress to keep up with the peer
group.
The exact date ranges of the testing windows may be defined in the online Administration Panel. Defining the date range ensures that students are not accidently tested before or after the desired
test period.
Screener Methodology: An Emphasis on Saving Time
The design of Screener emphasizes quick and efficient assessments on a large scale. Screener
provides very specific information (a student’s at-risk status) resulting from a very short test (3-5
minutes). Screener also allows for custom cut scores to be designated in advance of the assessment. Screener achieves this efficiency by only administering test items that have a difficulty rating that is approximate to the cut score. If the cut score (definition of at-risk status) is set to 12-months below
grade level, then a student will only see test items that are 12-months below his or her current grade level. If the student does well on these items, the test determines that she is above the cut score,
and not at risk. If the student does poorly on these test items, she will be identified as at-risk. A mixed
performance would result in a status of borderline.
Administrators
can define the
starting date for each testing window from the on-line Administration Panel
At-Risk Borderline Students
Students who are identified as at-risk or borderline by Screener should be given the longer
Benchmarker assessment to confirm the at-risk status, and give the student more of an opportunity to
demonstrate her math knowledge. It is possible that the short Screener assessment did not provide enough time for that student to become comfortable with the online testing interface. Or maybe the student was momentarily distracted during the screening. Benchmarker, with an average test time closer to 20 minutes, is more in-depth. After completing Benchmarker, the student’s status in the screener reports will be updated if there are any changes to her status.
Screener or Benchmarker
Schools and districts have the option of configuring Symphony Math to provide an integrated screening and benchmarking assessment. This assessment session will output all of the data in Screener reports, as well as a standard score, grade level equivalent, percentile rank, and growth score. If a school or district has the time and computer capacity for the longer Benchmarker it may
prefer this configuration in order to obtain more comprehensive data. The administration of Screener
by itself is only for those interested in the shortest, most efficient mathematics screening process
Introduction
When a teacher begins the school year with a new class of students, most curricula are designed with the assumption that all of the students in the class are at the same general level of academic ability. In reality, the typical elementary classroom will reveal a wide range of student ability. There may be some students that are one or two years below grade level, in terms of academic knowledge and skills; other students may be above grade level. And of course there will be a middle group with skills and knowledge within the grade-level range.
The challenge for the teacher is to engage and teach the specified curriculum to all of these students
of varying levels of ability and learning readiness. How can the teacher quickly determine where each student is in relation to each other? How can the teacher ensure that each student is improving and
benefiting from instruction over the course of the year?
Symphony Math Benchmarker is designed to help answer these questions. Benchmarker is an online assessment that provides a standard score, grade-level equivalent, and percentile rank for each student three times a year. Twice a year Benchmarker generates a growth score. These scores supply the teacher with the means to better understand the needs and capabilities of each student.
Benchmarker Methodology
Benchmarker is a Computer Adaptive Test (CAT) that dynamically locates each student on a standardized
scale of mathematical ability. The test is based upon an item bank of 900 test items that were specifi -cally designed to measure progress against the Common Core State Standards (CCSS) for Mathematics. Benchmarker test items have been calibrated and organized on a scale of low difficulty to high difficulty;
the program applies Item Response Theory algorithms which move the student to an easier item after an incorrect response, and to a harder item after a correct response.
symphony math
benchmarker
Each student begins Benchmarker with an assessment item that is two years below the student’s enrolled grade level. Depending on the student’s pattern of correct and incorrect responses, the test
items will become more or less difficult. A student may see between 18 and 24 assessment items
during a Benchmarker session. Benchmarker ends the assessment after it has seen enough re-sponses to determine the student’s location on the standardized scale of CCSS mathematics ability.
Benchmarker Norm-Referenced Scores
After students complete the test, Benchmarker outputs four performance scores: Scale Score, Percentile, Grade-Level Equivalency, and (after initial testing) Growth.
Scale Scores
All students receive a standardized score on a common vertical scale which reveals how the tested
students performed in comparison to grade-specific national norms. Such standard scores are known
for all grades, and the score averages for each grade are listed in the following table.
Grade Mean Scale Score*
Kindergarten 485 Grade 1 581 Grade 2 664 Grade 3 735 Grade 4 794 Grade 5 841 Grade 6 876 Grade 7 899 Grade 8 910
*Scale scores are for end of school year for each grade level
Because students’ performance increases over the school year the table only shows data for the last
month of instruction, typically the month of May. For instance, a fifth-grader who in May received a
scale score of 865 performed above average on the test, while a sixth-grader with the same score is below average. And, because Symphony norms are based on nationwide data, this also means that
this particular fifth-grader performed better than most other fifth-graders nationwide who were tested
in May. The other grades are normed in the same fashion. While the table only shows the average scores for the end of the school year, the dynamic reports of Symphony Math use month by month tables to automatically provide the percentile rank for the month Benchmarker was administered. Because Symphony Benchmarker scores are expressed on a vertical scale, students’ scores can be
readily compared across grades. We all expect that most first-graders have learned more than most kindergartners, most second-graders have learned more than most first-graders, and so on. With
Symphony’s scale scores, teachers can track performance regardless of assigned grade, allowing tracking of students across grades, thus supplying a detailed picture of their progress over time.
Percentile
A percentile rank tells what percentage of students in a specific group received lower scores than the
student in question. The range is from 1-99.
Each student’s score corresponds to a percentile relative to the distribution of other students’ scores in the same grade, for a particular month. The percentage of scores at or below a particular value
defines scores’ percentiles. Students with score percentiles near 50 are at the average for the month
in which the assessment was taken. Lower percentiles indicate slower overall growth, while higher values indicate accelerated overall growth relative to the nation at large.
For instance, assume that a third grader obtains a score of 800 when tested in May. From our data we estimate that this particular score equals or exceeds that of 70% of all other third graders tested nationwide in May. Therefore, this third grader’s percentile score is 70, or the 70th percentile. It is to be expected that students’ score percentiles will vary somewhat across the school year. Yet, while most students’ scale scores naturally rise over time, their positions within the national distribution – and therefore their percentile score – are often quite stable.
Grade Level Equivalent
Grade-level equivalents express students’ performance as being typical of some particular grade and month of instruction.
The word “typical” in this context refers to the median or middle score (or 50th percentile).If a student receives a grade equivalent of “7.2,” then this student’s score corresponds to that of an
average (median) seventh-grader after two months of instruction. Grade-Level Equivalents make it immediately clear whether a student is ahead, behind, or average with respect to his or her test performance.
Growth Score
Benchmarker generates a growth score after the second and third test administrations. The growth score is simply the recent scale score subtracted by an earlier scale score. For example, the winter growth score is determined by subtracting the fall scale score from the winter scale score. A student’s growth for the entire school year is determined by subtracting the fall scale score from the spring scale score.
Because these scores are based on an equal interval, vertical scale, Benchmarker growth scores can be used to compare growth among students, or among groups of students, such as classes and grades.
Configuring Assessment Options
Benchmarker can be administered in one of two ways. The online Administration Panel can be
con-figured to give Screener and Benchmarker in one integrated assessment session, or as two separate
assessments. In the latter case, only the students identified as at-risk or borderline by Screener take Benchmarker afterwards.
For those electing to administer Benchmarker as a separate assessment from Screener, there is an additional option to have students take Benchmarker immediately after their screening (if they test positively for risk), or on a subsequent day.
As with the Symphony Screener, there are three testing windows each year. The dates of these testing windows are the same for Benchmarker as for Screener, and can be configured in the online Adminis -tration Panel.
Introduction
Symphony Math is an intervention program designed to help students develop a profound
under-standing of the most important mathematical concepts. Many students struggle to become proficient in math because they do not have the opportunity to master foundational concepts with sufficient
depth. In an age when most curricula value covering a large number of topics, some students are falling through the cracks. They need more time and more practice working with the big ideas of mathematics in order to develop the proper foundation.
Symphony Math is an educational software program that provides students with the experience of learning and thinking about the most important mathematical concepts. This experience provides the necessary foundation for a successful future of math learning. Symphony Math helps students achieve this solid mathematical foundation by implementing several key research-based pedagogic
strategies. These strategies are recommended by leading experts in the field of mathematics educa -tion (see Research Base in the Appendix), and have improved student learning and understanding.
The Big Ideas of Mathematics
The conceptual sequence of Symphony Math consists of a tightly connected progression of the most
important mathematical ideas. These underlying “big ideas” are important because they provide the
foundation for later mathematical learning. The program helps students develop a profound under-standing of the big ideas listed in this table.
symphony math
intervention
Mathematical Topic Underlying Big Idea Stages
Number Quantity 1, 16 Addition and Subtraction Part-to-whole relations 2, 4, 6 Place Value Hierarchical groupings 3, 5 Multiplication and Division Repeated equal groupings 8, 13 Multi-digit Addition
and Subtraction Hierarchical groupings coordinated with part-to-whole relations 7, 9, 11 Fractions Repeated equal groupings coordinated with part-to-whole relations 12, 14, 15, 17
Symphony Math guides students through a carefully constructed sequence of these big ideas which are broken down into smaller concepts and presented in a developmental sequence. It’s easier for
students to work through the big ideas in smaller parts, since it can be difficult to internalize them all
at once. Each concept provides the foundation for the subsequent concept, and later concepts are built upon and coordinated with earlier concepts.
Symphony Math’s conceptual sequence provides an in-depth learning experience because it gradually builds the complexity of problems to a more advanced level than students typically encounter. For example, to help students develop a deep understanding of Quantity (or number sense), the program guides students through the following sequence of concepts from Stage 1:
Concept Example Solution
Equal 3 = ? 3 = 3 Greater 8 > ? 8 > 2 Less 5 < ? 5 < 7 Between 4 < ? < 9 4 < 6 < 9 Missing comparison 2 ? 5 ? 7 2 < 5 < 7 Not equal 7 ≠ ? 7 ≠ 10
A student does not move on to the next concept in the sequence until she has mastered the current concept. One concept follows logically from the previous concept. While a student is working on a new concept she sees review concepts that help support her learning of the new concept. This process helps the student connect new knowledge to previous knowledge.
Numbers represent relative quantities, or amounts. This is the fundamental idea that students work on in Stage 1. Symphony Math challenges students to develop an internal number line so that they can quickly and easily see numbers as a network of related quantities. Solving more complex problems (e.g., 1 < ? < 6, solved three different ways) leads to a more robust understanding for the
student. Compare this to the more superficial understanding some students develop during elemen -tary school, where numbers are just a sequence of memorized sounds and symbols. Counting is an important skill. However, it is only the beginning of understanding the number system.
Multiple Ways of Knowing
Integrated with the Symphony Mathconceptual sequence are six distinct activity environments. These activities provide multiple representations of each concept in the program.
Activity Purpose
Manipulatives Conceptually understand what the concept “looks like”
Manipulatives & Symbols Explicitly connect symbols to their visual representations Symbols Understand the concept at the abstract level
Auditory Sentences Learn the formal language of mathematics Story Problems Extend understanding to real life problem solving Mastery Round Develop immediate recall of number relationships
The use of different activities accomplishes several goals. First, it introduces concepts at the concrete (or visual) level. Students can see what the concept looks like, and this helps them develop a mental model of its meaning. In stage two, Intro to Addition & Subtraction, students work with manipula-tives to internalize the Parts-to-Whole big idea that underpins addition and subtraction. In this stage, students encounter problems like the one below:
Five bar must be inserted in this area.
A three bar and a two bar are combined.
Students must find a number bar that is the same length as the 3 bar and the 2 bar combined. Later,
they will see a problem like the one below. The whole is on top and is represented by the yellow 5 bar.
One of the parts is below and is represented by the blue 4 bar. The student needs to find the length of
The whole is
five units long.
A part is missing. (One unit long.)
In this way students come to understand how to solve problems like 2 + 5 = ? and 4 + ? = 9 using manipulatives. The process helps students understand the Parts-to-Whole big idea and its different variations.
The use of a variety of activities also helps students make the connection
between symbols and the concepts that the symbols represent. At a superficial
level some students can memorize the counting sequence and basic number facts without appreciating their meaning. A student may understand that 5 + 2 = 7 because 7 comes 2 numbers after 5. However, the student may not know what 5 + 2 = 7 looks like concretely, or may not know why it is also true that 2 + 5 = 7. The Manipulatives & Symbols activity helps with this issue by explicitly challeng-ing students to connect symbols with concrete representations. A student will be given a number sentence such as 8 + 1 = ? and must construct the correspond-ing visual representation. Or, they will be given the problem with number bars and they must provide the corresponding symbols.
8 + 1 = 9 is given with number bars. Student must construct the corresponding problem with symbols.
In this way, students explicitly connect symbols with visual representations and manipulatives with symbolic representations. This is the bridge from the concrete
(manipulatives) to the abstract (symbols) and helps students connect their intuitive understanding of number relationships to the formal number system we use to represent them.
The third activity uses only symbols. Now that the student has demonstrated proficiency with the ma
-nipulatives in the first activity and the meaning of symbols in the second activity, she gains proficiency
with procedures in the the third activity. The Symbols activity presents problems with symbols, but the integer bars will appear automatically if a student makes a mistake or asks for help.
The fourth activity emphasizes spoken language. Students hear the problem, then must construct it with symbols and solve it. This activity helps students learn the formal language of mathematics and connect it to the symbols and manipulatives from earlier activities.
The fifth activity challenges students with story problems. Students are presented with a written word
problem as shown below. Students must construct the corresponding number sentence and solve it. If they need to, they can press a button and have the story problem read out loud, with each word highlighted as it is read. This activity challenges students to extend their knowledge to real life prob-lems. Story problems are traditionally quite hard for struggling math students. A student’s previous in-depth work with manipulatives, symbols, and language helps provide the conceptual foundation and experience they need to succeed.
Students can press this button to hear the story problem. Solution is
constructed here.
The sixth activity environment is the Mastery Round, shown on the next page. This is a fluency activity
that helps students develop immediate recall of number relationships. Students are presented with number relationships problems with symbols or spoken language. They need to answer correctly before the problem disappears to demonstrate mastery. Only concepts and number relationships
with which students have demonstrated proficiency in an untimed setting are presented during the
mastery round. This avoids the too-common problem of encouraging students to memorize what they do not understand.
Students need to solve the problem before the cube falls away from view.
Learning Through Thinking and Making Connections
The pedagogic style ofSymphony Mathemphasizes thinking, figuring out, and making connections.
The program is designed to be used as a complement to the classroom learning experience. Students receive direct instruction and group learning in a classroom setting. The program provides the op-portunity for individual practice at the developmental level of each student. The style of this practice encourages independent thinking and problem solving, and this is accomplished through the use of three important pedagogic strategies.
Instructive Feedback
Symphony Math encourages independent thinking by providing instructive feedback that reveals the nature of each incorrect response. For example, if a student answers 3 + ? = 6 with a 2, the program immediately shows that a 3 bar combined with a 2 bar is not the same length as a 6 bar.
The number bars automatically appear to illustrate that a 3 bar and a 2 bar are not the same length as a 6 bar. The student solves this number sentence incorrectly.
Providing instructive feedback encourages students to deduce for themselves why an incorrect answer is not accepted. This is preferred to saying something like “that’s not right, try again” because that approach often leads to guessing and not understanding why the answer is not correct.
Using the Help Button
Another way that Symphony Math encourages learning through thinking is the use of the Help button. The Help button provides scaffolding, which leads the student closer to the solution but does not give the answer immediately. Additionally, the scaffolding provided by the Help button does not directly explain the procedures for achieving the solution. Immediately providing the correct procedures or solution undermines the thinking and understanding of the student and encourages her to depend on the program for solutions instead of developing her own problem solving skills.
If a student is confronted with the problem 8 + 1 = ?, she can press the Help button to activate scaffolding that will help her connect 8 + 1 with her existing knowledge of the concept and number relationships. This maintains the emphasis on thinking and making connections. If she needs more help, she can continue to press the Help button. The sequence of the help scaffolding for the problem 8 + 1 = ? is shown in the table below.
Help Button Activation Help Provided for the Problem 8 + 1 = ?
1st Show a “near neighbor”: 7 + 1 = 8
2nd Show a second “near neighbor”: 9 + 1 = 10
3rd Show 8 + 1 using number bars
4th Show that the 9 bar is equal in length to the 8 and 1 bar
The Help button provides hints and scaffolding that challenge students to make inferences and con-nect what they are learning to concepts they have already mastered. This helps guide the disposition of the student toward problem solving and independent thinking, not copying or guessing.
In-Depth Problem Solving
A third strategy that Symphony Math uses to encourage independent thinking is the use of specially designed problems that provoke thinking. For example, to master place value concepts students will be asked to solve a series of problems designed to help understand the base ten system. Students
will combine numbers of different place values, such as “30 + 400 + 7 = ?”. They will also be asked
to create number sentences where the sum is provided but the addends are missing, such as
“? + ? + ? = 286”. Each addend must correspond to the ones, tens and hundreds place value (e.g. 200 + 80 + 6 = 286). At the most difficult level, students need to provide three different solu -tions to this type of problem.
Each stage in the program has specially designed problems that keep the focus on thinking and
understanding. Students are not specifically told how to solve problems such as ? + ? + ? = 431 or
? - ? = 3, but they logically deduce the solutions by connecting these problems to similar problems that they have previously mastered.
Dynamic Branching Allows Students to Learn at Their Own Level
Symphony Math works with each student at his or her developmental level. The “dynamic branching”of the program and detailed progression of the scope and sequence allows students to work within their developmental zones. An advanced student who has complete mastery of all of the program’s concepts can complete the program in less than two hours. An intermediate student might move through the program to stage eight in less than an hour, but then spend several weeks working on
stage eight because that is her specific area of need. A younger or struggling math student may only
progress to stage two and then spend the rest of the school year working on Stage 2 concepts. The amount of time and practice that students need to understand mathematical concepts is not uniform. Symphony Math allows students to spend the time they need mastering foundational concepts. In addition, the program quickly moves students through the conceptual progression of the program to
identify their area of need. Once the area of need has been identified, the program slows the progress
until the necessary understanding has been achieved.
Dynamic branching not only assesses students’ understanding vertically through the hierarchy of
stages, but it also tracks students’ proficiency horizontally across the six different activity environ -ments. In addition, Symphony Math tracks and branches students according to their mastery of
specific number relationships. For example, the program tracks whether a student understands what
1/6 of 12 is, or 2/3 of 9. The program systemically records which number relationships have been mastered and which have not, and branches students accordingly. Another example is the number relationships for multiplication and division. Not only does the program track basic multiplication and division number relationships such as 2 x 3 and 8 ÷ 4, but it also records progress with number relationships such as missing dividend (? ÷ 4 = 2), missing multiplicand (3 x ? =12), and missing multiplier (? x 2 = 8).
This detailed level of data tracking allows Symphony Math to find a student’s area of need down to the specific concept, representation, and number relationship. The branching responds in a way that helps the student fill in these gaps in her learning while quickly moving through those areas that have
Comprehensive Reports
With each day of student use, Symphony Math provides teachers with detailed reports that inform their classroom instruction. The program reports provide a big-picture look at where students are in their overall mathematical development. Detailed reports inform teachers of students’ progress with
specific concepts and number relationships. The Symphony Dashboard alerts teachers to specific
issues that need to be addressed. For example, the Dashboard may alert a teacher about a student who needs help with missing addends using symbols. Digging deeper into the reports might reveal
Who Can Use Symphony Math?
The rigorous application of cognitive development principles in Symphony Math make it a suitable in-tervention program for a wide range of students. The program seeks to identify gaps in each student’s
mathematical understanding, and then present a series of problems designed to fill in those gaps.
Grades Category Objective Recommended Use
K - 2 Gifted Enhancement 15 minutes 2 times per week 1 - 4 On Grade Level Deepen understanding and support instruction 15-20 minutes 3 times per week 2 - 6+ Remediation Identify and fill in gaps inmathematical foundation 20 minutes 5 times per week
Gifted students in kindergarten through second grade may use Symphony Math to enhance their knowledge and move ahead to where their ability and motivation takes them. Students performing on grade level in grades one through four can use the program to deepen their understanding and to support teachers’ classroom instruction. Struggling students in grades two through six (and beyond)
may use the program to identify gaps in their mathematical foundation and begin to fill them in. The
age neutral interface of Symphony Math makes it comfortable for a wide age range of students to
Introduction
Symphony Math is an intervention program designed to help students develop a profound under-standing of the most important mathematical concepts. Symphony Math focuses on the big ideas of
mathematics — the foundational knowledge upon which all later math learning is based. The six “big ideas” developed in Symphony Math include:
l Quantity
l Parts-to-Whole l Hierarchical Groupings l Repeated Equal Groupings
l Hierarchical Groupings with Parts-to-Whole l Repeated Equal Groupings with Parts-to-Whole.
Each big idea consists of a network of related concepts which are sequenced throughout the seven-teen stages of Symphony Math.
Another important component of the Symphony Math Scope & Sequence is the multiple representa-tions of each concept. The program uses a mixture of manipulatives, symbols, language, story
prob-lems, and auditory and symbolic fluency to help students make connections between representations
and more fully understand each big idea. While this chapter lays out the sequence of stages and concepts, it is important to remember that each concept utilizes multiple representations throughout the program. See Chapter 1 for an overview of the different representations used in Symphony Math.
intervention
scope and sequence
The Seventeen Stages of Symphony Math
# Stage Name Example Underlying Big Idea
1 Number Sense 4 < ? < 7 Quantity
2 Introduction to Addition & Subtraction 2 + 1 = ? Parts-to-Whole 3 Ones, Tens & Hundreds 100 + 100 + 100 = ? Hierarchical Groupings 4 Intermediate Addition & Subtraction 5 + 6 = ? Parts-to-Whole 5 Two-Digit & Three-Digit Numbers 300 + 40 + 1 = ? Hierarchical Groupings
6 Advanced Addition & Subtraction 9 + 8 = ? Parts-to-Whole
7 Adding & Subtracting One-Digit Numbers 8 + 7 = ? (vertical format) Hierarchical Groupings with Parts-to-Whole 8 Introduction to Multiplication & Division 2 x 1 = ? Repeated Equal Groupings 9 Adding & Subtracting Two-Digit Numbers 56 + 75 = ? Hierarchical Groupings with Parts-to-Whole 10 Three-Part Addition & Subtraction 8 + 5+ 2 = ? Parts-to-Whole 11 Adding & Subtracting Three-Digit Numbers 342 + 237 = ? Hierarchical Groupings with Parts-to-Whole 12 Introduction to Fractions 1/2 of 2 = ? Repeated Equal Groupings with Parts-to-Whole. 13 Intermediate Multiplication & Division 3 x 9 = ? Repeated Equal Groupings 14 Unit Fractions 1/2 of 4 = ? Repeated Equal Groupings with Parts-to-Whole 15 Non-Unit Fractions 2/3 of 9 = ? Repeated Equal Groupings with Parts-to-Whole
16 Not Greater & Not Less 4 >/ ? Quantity
17 Improper Fractions 3/2 of 4 = ? Repeated Equal Groupings with Parts-to-Whole
Big Idea #1: Quantity
Quantity is the big idea that describes amounts, or sizes. It is a fundamental idea that refers to quantitative properties. The different types of quantitative properties include the size of things (magnitude), such as weight, height, or length, and the number of things (multitude), such as the amount of objects.
Quantity is a big idea of mathematics because so many mathematical concepts are dependent upon
it. Take for example the five mathematical content strands from the National Council of Teachers
of Mathematics. At the heart of each of these strands is the big idea of Quantity. Geometry is the quantity of space. Number is the quantity of things. Measurement is the quantity of dimensions. Algebra is the relationship of quantities. Statistics is the representation and analysis of quantities.
Why Students Need to Understand Quantity
Quantity means that numbers represent amounts. If students do not understand Quantity, their understanding of other areas will be undermined. Understanding Quantity helps students develop number conceptualization. The sequence of numbers is determined by each number’s magnitude, a concept that not all children understand.
Some students learn the number system as they do the alphabet. They memorize the sequence of sounds and symbols. However, unlike the alphabet, numbers represent concepts. The sequence of counting numbers represents an increase in size with each number. Some students can learn to solve simple math problems without understanding that a number is a concept that represents a quantity. A student may know that 9 comes after 8 but not know that 9 represents a larger quantity than 8. It is possible for a student to navigate through an elementary math curriculum without understanding the concept of Quantity. Students apply strategies that produce correct answers without having to pay attention to the fact that the numbers in the equations represent real amounts. Students can rely on counting to produce correct answers without understanding the meaning. However, as the curriculum
becomes more complex this superficial understanding of Quantity may undermine their progress.
How Symphony Math Helps Students Understand Quantity
Stage 1, Number Sense, is designed to help students move from counting to understanding that numbers represent quantities. If a student already has this understanding she will move quickly through the stage. If a student does not understand the big idea of quantity, she will spend time in Stage 1 developing this understanding.
Stage 1 begins with the concepts of same, taller, and shorter. Students work with number bars to identify which ones have the same height, are taller, or are shorter. Most students come to school with this intuitive understanding of relative heights using concrete objects. In Stage 1 they learn to extend this understanding to symbols. They connect the idea that an object can be taller or shorter than another object to the idea that a symbol can represent a number than can be greater or smaller than another number.
At higher levels of Stage 1 students must find number bars or numerals that are between two other bars or numerals. For example, students need to find a number that is greater than 3 and less than
7. These kinds of problems help students develop an internal number line and an appreciation for the fact that numbers represent quantities.
Big Idea #2: Parts-To-Whole
Parts-to-Whole is the big idea that underlies addition and subtraction. The idea is that there is a whole that can be partitioned into a certain number of parts. If we combine the parts, they equal the whole. If the whole is 8, the parts could be 6 and 2. Combine the two parts (6 + 2), they equal the whole (8).
We can change the order of the parts (2 + 6) and they still equal the whole. We can also find several
different ways of making a whole (8) out of two parts, such as 7 + 1 or 3 + 5.
A part can be taken away form the whole leaving another part left over. The whole is 8, we take away 5, 3 is left over. A student that has developed in-depth understanding of the Parts-to-Whole big idea
can see addition and subtraction as different ways of forming number relationships, often called “fact families.”
l 5 + 3 = 8
l 3 + 5 = 8
l 8 - 3 = 5 l 8 - 5 = 3
Why Students Need to Understand Parts-to-Whole
Students need to understand Parts-to-Whole in order to move beyond numeracy as counting to understand numbers as an inter-related system. An understanding of Parts-to-Whole leads to a better understanding of addition and subtraction, success with story problems and provides the necessary foundation for understanding later mathematical concepts.
It is possible to solve simple addition and subtraction problems by using the counting strategy in place of understanding the big idea of Parts-to-Whole. For example, to solve 6 + 3, the student counts to six,
and then counts three more, often ticking off the last 3 on her fingers, arriving at 9. You ask the same
student 9 - 3, she starts at nine and counts backwards three numbers to arrive at 6.
While this student may answer with correct answers, this does not mean she necessarily understands Parts-to-Whole. When faced with the following story problem:
“Joe has $4. Sam and Joe have $7 together. How many dollars does Sam have?”
The student who does not have an understanding of Parts-to-Whole may look for a keyword and then
count to find the solution. The keyword in this example is “together”, which the student has been told
means to count on. So the student starts with 7, counts on 4 more and arrives at 11 as an incorrect answer.
The student who understands Parts-to-Whole approaches this problem in a different way. For 6 + 3, the student can mentally picture 6 combined with 3 as being equal to 9. When asked what 9 - 3 equals she knows that since 6 + 3 = 9, therefore 9 - 3 must equal 6. For the word problem example
she identifies 7 as the whole and 4 as one of the two parts, leading her to conclude that 3 is the
missing part.
The Parts-to-Whole idea is also foundational for place value, multiplication and division as well as frac-tions. Students who do not understand Parts-to-Whole and who can only solve addition and subtrac-tion with counting may not have the conceptual foundasubtrac-tion to understand these later concepts.
How Symphony Math Helps Students Understand Parts-to-Whole
Stages 2, 4, 6, and 10 emphasize the understanding of the big idea of Parts-to-Whole. This is the key idea that students need to internalize to understand addition and subtraction.
In Stage 2 students are introduced to the Parts-to-Whole big idea with simple addition. Using number bars they see that two small bars combined to equal the length of a longer bar. They then work to understand missing parts. After working on missing part, subtraction is introduced. A long bar is presented, the students needs to determine which bar would be left over if a certain bar was taken away form the whole.
l 2 + 1 = ? l 2 + ? = 3 l 3 - 1 = ?
Stages 4 and 6 introduce more difficult number relationships as well as two missing parts and a miss -ing whole and a miss-ing part.
l 10 - ? = ? l ? + ? = 10
Stage 10 introduces three-part and four-part problems. l 2 + 3 + ? = 10
l 2 + 4 = ? + 3
As students work their way through stages 2, 4, 6 and 10 they develop a deep understanding of the Parts-to-Whole idea. This leads to a strong understanding of addition and subtraction and provides the foundation for later concepts such as multiplication, division, place value and fractions.
Big Idea #3: Hierarchical Groupings
Hierarchical Groupings is the idea that amounts can be grouped into a system of sets and subsets. We can count 11 objects and group them into 1 ten and 1 ones, or we can call them 11 ones. One hundred and seventy nine represents 1 hundred, 7 tens, and 9 ones.
In order to progress mathematically students need to be able to perceive the place value structure of a number -- they need to be able to understand what larger numbers mean. Without understanding this structure 179 is just the number that comes after 178 and before 180. While this may be
cor-rect, on its own it does not represent a sufficient understanding.
There are of course other examples of hierarchical groupings, further illustrating why this is an important big idea. Time, for example, is organized in terms of seconds, minutes, hours, days and so on. Sixty seconds equals one minute, 60 minutes equals one hour, and 24 hours equals 1 day. Time is a particularly complex system for young students to master because it involves the base ten number system as well as the unique hierarchical groupings of the temporal system. Furthermore, the grouping amounts for each step of the hierarchy may be different -- 60 minutes equals 1 hour but 60 hours does not equal 1 day.
Why Students Need to Understand Hierarchical Groupings
A student who does not have a strong understanding of Hierarchical Groupings may have difficulty answering the question, “Which number is larger, 79 or 81?”. She might think 79 is larger because
the 7 and the 9 combined make 16 while the 8 and the 1 combined only make 9. This indicates a lack of understanding that the 7 in 79 equals 7 tens and the 8 in 81 is the same as 8 tens. The under-standing of how these numbers are composed in the base-ten place-value system is foundational to success with multi-digit addition and subtraction where students must compose larger numbers in addition and decompose them for subtraction.
How Symphony Math Helps Students Understand Hierarchical Groupings
Stages 3 and 5 are designed to help students understand Hierarchical Groupings and prepare them for multi-digit addition and subtraction. The problems in these stages challenge students to compose and decompose numbers of progressing complexity. In Stage 3 students are asked to take apart and build numbers in the ones’ place column. For example, 1 + 1 + 1 + 1 = ?.
Understanding of the tens place value is developed by challenging students to solve problems where they have to compose and decompose numbers such as 10, 20, and 30. For example,
10 + 10 + 10 + 10 = ? and ? + 40 = 100. After successfully developing an understanding of tens, students progress to the hundreds. For example, 100 + 100 + 100 = ? and ? + 400 = 1000.
At this point, students have a basic understanding of what 1, 10, 100, and 1000 mean. In Stage 5 students learn how to integrate the ones, tens, and hundreds place values. For example, 50 + 4 = ?. Some students might answer 9. This is a misapplication of the addition they have learned with the ones’ place value; they add the 5 from 50 with the 4, not understanding that the 5 in 50 represents
five tens. Once students become proficient at integrating two-digit numbers, they progress to
three-digit numbers.
There are a number of pedagogical strategies in Stages 3 and 5 that are designed to push students’ understanding to a deeper level and help them to make connections between concepts. After solving a problem such as 300 + 500 = ?, they will be asked 30 + 50 = ? and then 3 + 5 = ?. This is designed to help students connect the larger place-value numbers with their mastery of smaller number relationships. Students will also encounter problems such as 971 > ? > 799, in order to consolidate their emerging knowledge of place value and to explicitly connect it to the concepts they learned in the Number Sense stage, where they solved problems such as 9 > ? > 7.
Big Idea #4: Hierarchical Groupings with Parts-to-Whole
As its name implies, Hierarchical Groupings with Parts-to-Whole is a complex idea -- one that involves the coordination of two earlier big ideas. It also illustrates the hierarchal nature of mathematics and how a poor foundation is likely to interfere with the learning of later concepts.
For this big idea students must coordinate their knowledge of Hierarchal Groupings and Parts-to-Whole. Let’s look at the following problem:
268 + 453 _____
Two hundred sixty eight is one part. The other part is 453. Combined they form the whole. Conceptu-ally the student needs to understand she is looking for a missing whole. ProcedurConceptu-ally, she must un-derstand that when she combines the 8 and the 3 this yields a 10 and a 1. The ten will be combined with the other tens (6 and 5).
In this way the student is working with both the Hierarchal Groupings idea and the Parts-to-Whole idea. Not only is solving multi-digit addition and subtraction problems procedurally complex, but it is
also conceptually complex relative to the preceding concepts in the curriculum. It is one of the first
periods in mathematical learning where many students begin to apply complex procedures they do not fully understand.
Why Students Need to Understand Hierarchical Groupings with Parts-to-Whole
One of the most common problems for students who do not understand Hierarchal Groupings with Parts-to-Whole is their tendency to make consistent errors in their problem solving. They attempt to follow the procedures they have been taught to solve multi-digit addition and subtraction problems. But these procedures are numerous and complex. Without an in-depth understanding of the two underlying big ideas students tend to make errors as it is hard to remember the correct sequence of steps.
For example, given the following problem:
1205
- 302 _____
The student accurately takes 2 from 5 to get 3 for the ones column and correctly places a 0 in the tens column. In the hundreds column the student places a 1 from taking the 2 away from the 3. The student forgot that the bottom number is to be taken away from the top number, or maybe took the 2 from the 3 because it is easier and she wasn’t sure how else to subtract the 3 from the 2.
1205 - 302 _____ 1103
The student who has an in-depth understanding of Parts-to-Whole is unlikely to commit this mistake because she sees the 2 as part of the whole and the 3 as the part that is to be subtracted. Further-more, an understanding of hierarchical groupings would lead the student to look at this part of the problem as 12-3 or 12 hundreds minus 3 hundreds.
Finally, the student who is thinking of these numerals as amounts, or concrete values would intuitively recognize that 1200 minus 300 can not equal 1100, just like 12 minus 3 can not equal 11.
The student who has not developed an in-depth understanding of these big ideas is likely to rely only on the step-by-step application of procedures without the supporting understanding of what these procedures mean and why they work. When she produces a nonsensical answer the mistake is not apparent because she has stopped looking at the numbers as representing meaningful quantities. She is simply manipulating symbols as best she can according to the procedure.
How Symphony Math Helps Students Understand Hierarchical Groupings
with Parts-to-Whole
Stages 7, 9, and 11 consolidate the ideas developed in the previous stages and extends them into the process of adding and subtracting large numbers that require regrouping. This process is more complex both in terms of the necessary conceptual understanding and the number of steps. The procedural and conceptual complexity of multi-digit addition & subtraction make it one of the biggest barriers to mathematical learning for some children. The purpose of these stages in Symphony Math
is to help students become accurate and efficient with the procedures of multi-digit addition and
subtraction, as well as to understand its underlying big idea.
Stages 7, 9 and 11 use the traditional algorithm of solving from right to left, starting with the ones col-umn. There are other methods to solve these types of problems, but this is the most widely accepted and is effective with all types of problems. Students can also be encouraged to learn alternative solu-tions in their classroom, but since not all classrooms embrace the teaching of alternative algorithms, Symphony Math does not introduce them. There is flexibility within the program to use alternate
solution strategies, but their use is not required.
The common critique of the traditional algorithm is that it is not intuitive and some students employ it in a rote manner without grasping its meaning. Symphony Math addresses this weakness by