May 2013
General Insurance Code of
Practice
Overview of the Year 2011 – 2012
FOS Code Compliance and Monitoring Team
Contents
1 This Annual Report 4
2 About the Code 5
3 About us – the FOS Code Team 6
4 The year at a glance: the FOS Code Team’s monitoring activities 8 5 An industry overview: Code Participants’ 2011 – 2012 data 9
6 Our key initiatives 10
6.1 Code monitoring activities 10
6.2 Operations 11
6.3 Secretariat activities 11
6.4 Stakeholder engagement 11
7 FOS Review of claims handling standards during the 2010/2011 Qld Floods 12
8 Code compliance monitoring and outcomes 15
8.1 How we monitor Code compliance 15
8.1.1 Our annual compliance monitoring programme 15
8.1.2 Our investigations function 16
8.2 Outcomes of Code compliance monitoring activities 18
8.2.1 The number and types of breaches 19
8.2.2 Breach sources 21
8.2.3 Breach causes & corrective actions 21
8.2.4 Significant Code breaches 22
8.3 Code Participants’ Code Compliance Initiatives 24 9 General Insurance Industry Data 2011 – 2012: Policies, Claims and Disputes 26
9.1 How to read Part 9 of the Report 26
9.2 Overview of Key Industry Data 27
9.2.1 Policies 27
9.2.2 Claims 27
9.2.3 Declined Claims 28
9.2.4 Disputes and Internal Dispute Resolution 29
9.2.5 Withdrawn Claims 30
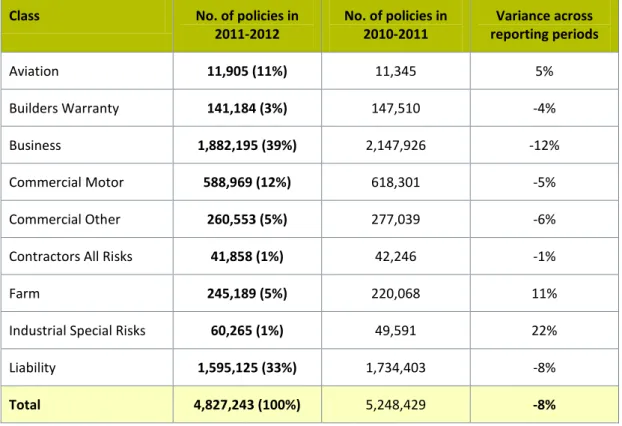
9.3 Policies - 2011 - 2012 30
9.3.1 Policies - Personal classes 31
9.3.2 Policies - Commercial classes 32
9.4 Claims Lodged during 2011 - 2012 32
9.4.2 Claims – Commercial Classes 34
9.5 Claims Declined during 2011 - 2012 35
9.5.1 Declined Claims - Personal Classes 36
9.5.2 Declined Claims - Commercial Classes 38
9.6 Withdrawn Claims 39
9.7 Internal Dispute Resolution 41
9.7.1 Internal Disputes - Overview 42
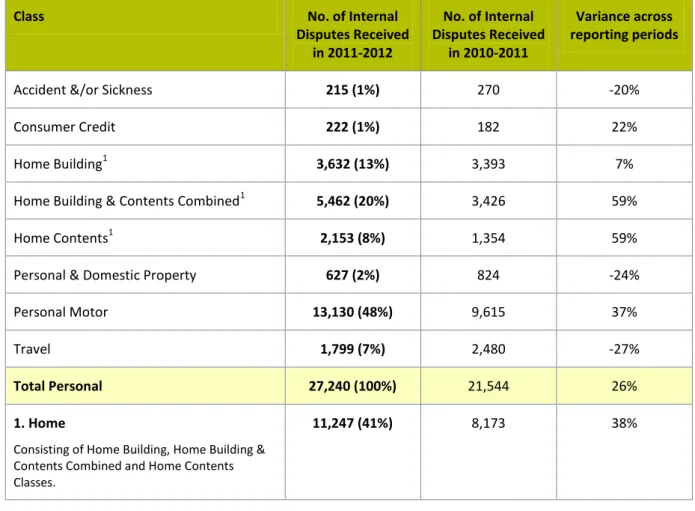
9.7.2 Internal Disputes Received by Code Participants – Personal Classes 42 9.7.3 Outcomes of Internal Disputes – Personal Classes 44 9.7.4 Internal Disputes Received by Code Participants - Commercial Classes
44 9.7.5 Outcomes of Internal Disputes – Commercial Classes 45
Appendix A: Changes to the Code 46
Appendix B - Current Code Participants 49
Appendix C: Summary of Claims Handling Difficulties arising from Qld Floods 2010/2011 54
Appendix D: Aggregated Breach Data 55
Appendix E: Causes & Corrective Actions 58
Appendix F: Code Participants’ Monitoring Activities 2011 - 2012 59 Appendix G: Summary of All Policies, Claims, Declined Claims & Internal Disputes Data
60 Appendix H: Commercial Insurance - Policies, Claims, Declined Claims & Internal Disputes
Data 61
1 This Annual Report
Section 7.8 of the General Insurance Code of Practice (the Code) requires the Financial Ombudsman Service Limited (FOS) to publically report on Code Participants’ compliance with the Code, through the release of an annual report, containing aggregated industry data and consolidated analysis on Code compliance. This Annual Report (Report) is provided in relation to the year 1 July 2011 to 30 June 2012 (2011 - 2012), in accordance with section 7.8 of the Code.
This Report has been prepared by FOS’s Code Compliance and Monitoring Team (the FOS Code Team), in accordance with its responsibilities under the Code as Code Monitor. The views expressed in this Report do not represent the views of the Board of FOS.
The data and observations outlined in Parts 6, 7 and 8 of this Report are drawn from
monitoring the activities of the 151 Code Participants who voluntarily subscribed to the Code during the relevant period.1 This data consists of the outcomes of:
Our annual review of Code Participants’ compliance with the Code.2 Our investigations into alleged breaches of the Code.3
Significant breaches identified by us or identified and reported to us by Code Participants.4
Code Participants’ internal breach reporting and monitoring programmes.5 This data was collected and reported to us by Code Participants in their Annual Returns. The data outlined in Part 9 of the Report was collected and reported to us by Code Participants in their Annual Returns, and relates to:
Policies of insurance, Claims,
Declined claims, Withdrawn claims, and
Internal Dispute Resolution (IDR).
We have consulted widely with Code Participants when assessing this data, and sought and recorded their views on the factors that may have influenced changes in this industry data, between 2010 – 2011 and 2011 – 2012.
We have also identified instances where changes to the 2011 – 2012 Annual Return questionnaire may have affected any comparison sought of this data year on year. Those factors have been described in detail in Part 9 of this Report and must be kept in mind when interpreting the data provided throughout this Report.
1 The 151 Code Participants consisted of 60 general insurers and 91 Lloyd’s Australia Limited coverholders and claims administrators. At the time of this Report’s publication, Code subscription had grown to 155 companies, consisting of 59 general insurers and 96 Lloyd’s Australia Coverholders and Claims Administrators. A list of current Code subscribers is located in Appendix B of this Report.
2 The Code, sections 7.5 and 7.12(b). 3
The Code, section 7.11. 4
The Code, sections 7.3 and 7.12(a). 5
2 About the Code
The Insurance Council of Australia (ICA) is responsible for the Code, which it initially released on 18 July 2006. The current version of the Code became operational on 1 July 2012 (July 2012 Code), and the changes that were made are discussed in Appendix A of this Report.6
Whereas this Report is based on the activities of 151 Code Participants, subscription to the Code has increased overall to 155 Code Participants consisting of 59 general insurers and 96 Lloyd’s Australia Limited Coverholders and Claims Administrators. A list of current Code Participants is located in Appendix B of this Report.
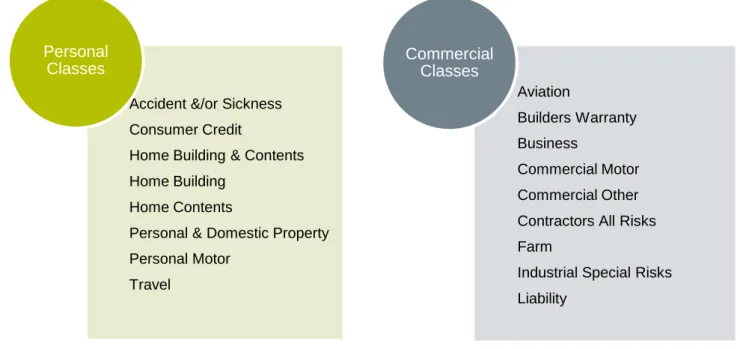
The Code covers all general insurance products which we have broadly categorised for reporting purposes as described in Diagram 1.
Diagram 1: Classes of General Insurance covered by the Code.
The Code does not apply to workers compensation, marine insurance, medical indemnity insurance,7 compulsory third party insurance, reinsurance, and life and health insurance products issued by life insurers or registered health insurers.8 It prescribes the minimum standards each participating company (Code Participant) is required to uphold when
providing services to individuals and businesses, seeking or holding an insurance policy, and in some circumstances to third parties. Code Participants, their employees, Authorised Representatives and Service Providers are required to comply with these standards.9 The Code’s service standards are broadly described in Diagram 2.
6
The current Code and earlier versions are available for download from www.codeofpractice.com.au
7
Medical Insurance Australia Pty Ltd, a medical indemnity insurer, has voluntarily adopted the Code. 8
The Code, sections 1.4 and 1.5. 9
The Code, sections 1.6 and 7.4.
Accident &/or Sickness Consumer Credit
Home Building & Contents Home Building
Home Contents
Personal & Domestic Property Personal Motor
Travel
Personal Classes
Aviation
Builders Warranty Business
Commercial Motor Commercial Other Contractors All Risks Farm
Industrial Special Risks Liability
Commercial Classes
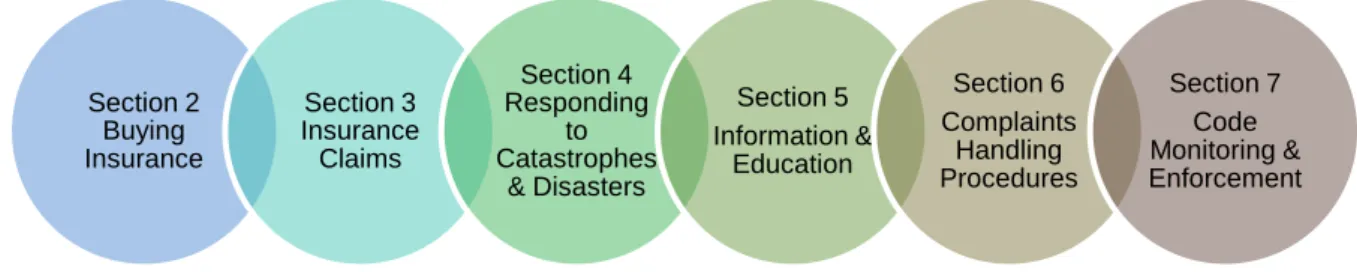
Diagram 2: The Code Standards
The Code operates together with the laws that govern the general insurance industry. Its objectives are to:
Promote good relations between insurers and their customers and improve consumer confidence in the general insurance industry.
Provide better mechanisms for the resolution of complaints and disputes between insurers and their customers, and
Commit insurers and the professionals they rely on to higher standards of customer service.10
The Code governance structure and FOS’s organisational structure are discussed in Part3 About us – the FOS Code Team of this Report.
3 About us – the FOS Code Team
To ensure greater clarity of role and separation of functions, on 1 January 2012 the Financial Ombudsman Service Limited (FOS) created a separate business unit to undertake code administration, secretariat and monitoring functions, in relation to industry codes of practice, including the General Insurance Code of Practice (the Code). This business unit is the Code Compliance and Monitoring team (the FOS Code Team).
FOS’s primary role as an ASIC-approved EDR scheme for the financial services sector is governed by its Terms of Reference (TOR), which operate as a contract between FOS and its financial services provider members.
The FOS TOR sets out the matters related to its primary role as an ASIC-approved EDR scheme resolving disputes between consumers and its financial services provider members. The FOS Code Team operates separately and independently from FOS’s external dispute resolution (EDR) services (FOS EDR). It is required to report on the outcomes of its Code compliance monitoring activities to a separate and independent Code Compliance
Committee (the CCC). The CCC, amongst other things, monitors Code compliance through reports received from the FOS Code Team.11
The role of the FOS Code Team in the Code’s governance structure arises from separate contractual arrangements between FOS, the Insurance Council of Australia (ICA), the CCC
10
The Code, section 1.17. 11
The Code, section 7.14(a). Section 2
Buying Insurance
Section 3 Insurance Claims
Section 4 Responding
to Catastrophes
& Disasters
Section 5 Information &
Education
Section 6 Complaints
Handling Procedures
Section 7 Code Monitoring & Enforcement
and each Code Participant.12 A separate service level agreement between FOS and the ICA sets out the type and nature of the services to be delivered by the FOS Code Team.
The FOS TOR, however, do not deal with Code administration, monitoring and secretariat functions and responsibilities.
FOS EDR also has obligations under the TOR to report systemic issues and serious misconduct to ASIC in accordance with FOS’s obligations as an approved EDR scheme under ASIC RG 139. These obligations are distinct from, and separate to, the role the FOS Code Team has in the provision of Code monitoring, secretariat and administration services to the CCC and the ICA.
12
4 The year at a glance: the FOS Code Team’s monitoring activities
Overall, Code Participants demonstrated a maturing approach to Code compliance during the reporting year. Their commitment to continuously improving their Code compliance frameworks was evident through various Code monitoring initiatives and an increase in the number of self-identified and reported Code breaches to the FOS Code Team.Code Participants self-reported and remedied 2,724 additional Code breaches (page 19).
The FOS Code Team identified 2 significant Code breaches affecting 10,021 customers and resulting in payments of $5,287,370 including interest to affected customers (page 22).
The FOS Code Team received a significant Code breach report affecting 6,380 customers resulting in written notification to all customers about claims handling delays (page 23).
The FOS Code Team conducted 58 desktop compliance reviews resulting in the identification and rectification of 18 Code breaches (pages 10 and 21).
The FOS Code Team conducted 126 investigations into alleged Code breaches resulting in the identification and rectification of 49 Code breaches (page 21).
In response to Code breaches Code Participants’ implemented remedial actions, consisting of one or more of the following (page 21):
Informing customers about IDR and EDR rights,
Improving internal claims handling processes and/or systems,
Improving monitoring of internal claims handling processes and/or systems, Increasing claims staff numbers,
Introducing new claims handling processes,
Providing further training for staff and external service providers about financial hardship, Providing further training for staff about fair and transparent complaints handling, and Updated consumer-facing documents to ensure fairness and transparency.
Code Participants reported 7,722 instances where they were unable to meet the Code’s claims
handling standards due to the impact of the Queensland 2010/2011 Floods (page 12). As a result of these events Code Participants implemented a number of initiatives to improve claims handling in times of natural disaster.
5
An industry overview: Code Participants’ 2011 – 2012 data
Code Participants have provided the following data to the FOS Code Team in their Annual Returns. The FOS Code Team has aggregated this data which is outlined below in summary form.
151 Code Participants employed 34,621 staff, engaged 5,856 corporate and 11,695
individual authorised representatives, and provided Code training to 18,273 employees and
12,761 individual authorised representatives.
Code Participants reported that there were 39,007,318 general insurance policies held by customers, consisting of:
34,180,075 personal insurance policies, and
4,827,243 commercial insurance policies (pages 27 and 30).
Code Participants received 3,865,984 general insurance claims from customers, consisting of:
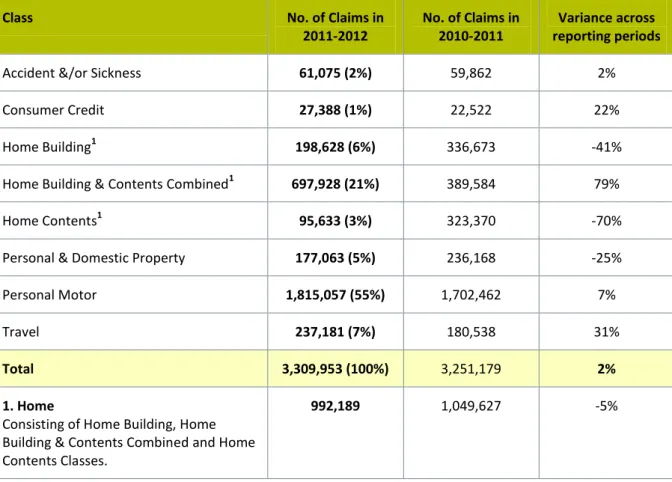
3,309,953 personal insurance claims, and
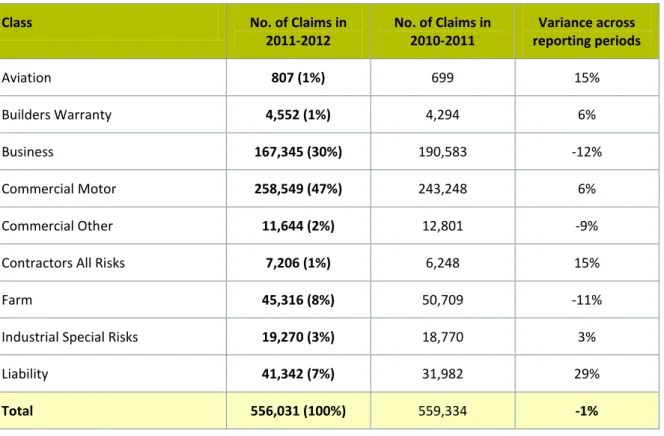
556,031 commercial insurance claims (pages 27 and 32).
Only 3%13of claims lodged in the reporting period were declined14 by Code Participants, amounting to 97,118 general insurance claims and comprised of:
91,451 personal insurance claims, and
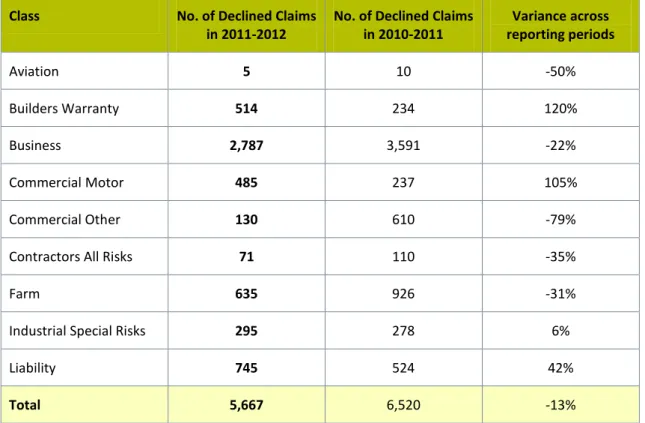
5,667 commercial insurance claims (pages 28 and 35).
Customers withdrew 120,573 general insurance claims consisting of: 117,674 personal insurance claims, and
2,899 commercial insurance claims (pages 30 and 39).
Customers raised 28,875 internal disputes with Code Participants consisting of: 27,240 personal insurance internal disputes, and
1,635 commercial insurance internal disputes (pages 29 and 42). Code Participants internally reviewed 28,400 disputes which resulted in: 20,010 outcomes in favour of Code Participants and
8,390 outcomes in favour of Customers (pages 29 and 44).
We have provided an overview of our analysis of this data at the beginning of Part 9 of this Report together with a detailed analysis.
13
Data expressed as a percentage has been rounded up/down to the nearest whole number. 14
Some Code Participants included data about withdrawn claims and partially accepted claims in declined claims data reported to us. This is discussed further in Part 9 of this Report.
6 Our key initiatives
Our core monitoring work during 2011 - 2012 was conducted within the context of a challenging and demanding year. The impact of the severe weather events experienced throughout Australia in 2010 - 2011 continued well into 2011-2012. The performance of the general insurance industry in response to these events, in particular the flood events in Queensland,15 and the effectiveness of the Code, was examined through state and federal government inquiries.16 This led to the ICA approving key changes to the Code in February 2012, which became operational on 1 July 2012.17
The FOS Code Team’s initiatives during the reporting period are outlined below in relation to four key areas:
Code monitoring activities; Operations;
Secretariat activities; and Stakeholder engagement.
6.1 Code monitoring activities
During the year we:
Reviewed the performance of Code Participants’ in relation to claims handling, both during and following the 2010 – 2011 Queensland flood events.
18
This project was undertaken at the request of the ICA. Conducted 58 Desktop compliance reviews and 126 investigations into alleged breaches of the Code. The outcomes of these activities are outlined and discussed in
Part 8 of this Report.
Distributed our 2011 - 2012 annual return requests to Code Participants. The key data provided by Code Participants and our analysis appears in Part 9 of this Report. Developed and planned a new three-year Code compliance monitoring programme
which was launched on 1 July 2012.
Designed and implemented new templates for the revised compliance monitoring programme, to reflect the changes to the Code that became effective on 1 July 2012. In all, 12 template questionnaires were developed in consultation with the ICA and Code Participants, reflecting six distinct general insurance business models.
Collated, analysed and reviewed data and commentary, which was published in our Annual Report for the 2010 – 2011 reporting year.
Revised and extended the data reporting parameters for the 2011 - 2012 Annual Report and extended the parameters to include data about withdrawn claims.
15 Flooding in Queensland between 21 December 2010 and 14 January 2011, affecting Brisbane, Toowoomba, Lockyer Valley and rural Queensland.
16
House of Representatives, Standing Committee on Social Policy and Legal Affairs: In the Wake of Disasters, Volume One: The operation of the insurance industry during disaster events February 2012 www.aph.gov.au/insurance ;National Disaster Insurance Review: Inquiry into flood insurance and related matters September 2011 www.ndir.gov.au ; Queensland Floods Commission of Inquiry – Final Report March 2012 www.floodcommission.qld.gov.au .
17
These changes are discussed in Appendix A of this report. 18
Flooding in Queensland between 21 December 2010 and 14 January 2011, affecting Brisbane, Toowoomba, Lockyer Valley and rural Queensland.
6.2 Operations
We designed and implemented a new electronic case file management system, “Codex”, for the conduct of investigations and Code monitoring work. We also commenced a continuous improvement programme for Code investigations.
6.3 Secretariat activities
We provided secretariat services to the CCC throughout the reporting year, meeting with it on five occasions.
6.4 Stakeholder engagement
We attended 33 meetings involving the Australian Securities and Investments Commission (ASIC), Code Participants, Consumer Advocates, FOS EDR, ICA and/or Treasury (Federal) across a range of issues including in relation to:
Code monitoring.
Our review of Code Participants’ handling of claims arising from or impacted by the 2010/2011 Queensland Floods.
The outcomes of Federal and State government inquiries into the same events. During this period we also:
Assisted in manning an information booth about the work of the FOS Code Team and FOS EDR at Financial Counselling Australia’s Conference and EDR Forum.
Commenced consultation with the Independent Code Reviewer, Mr Ian Enright. Designed and delivered Code training programmes for FOS EDR staff and members
of the Financial Consumer Rights Council, to increase awareness of the application of the Code’s obligations in practice.
Participated in the ICA’s Code Compliance Reference Group.
Provided input into the development of a motor vehicle insurance handbook for community lawyers within the community legal environment.
7 FOS Review of claims handling standards during the 2010/2011 Qld
Floods
At the ICA’s request we conducted a survey of Code Participants’ and consumer
representatives about the application of the Code’s claims handling standards under the May 2010 Code, both during and after the Queensland flood events that occurred in 2010 - 2011.19
We appreciated the genuine and constructive engagement we had with all the Code Participants, consumer advocates and legal centres and with the ICA during the Review. The survey was confined to an examination of claims arising from the events in Queensland from 21 December 2010 until 14 January 2011. These events affected Brisbane, the Lockyer Valley, Toowoomba and other rural areas of Queensland. On 29 December 2010 the ICA declared20 the 2010/2011 Queensland Floods a catastrophe and assigned it the following catastrophe codes: CAT 105, 111 and 11221.
Our findings were published in August 2012 in a report titled 2010/2011 Queensland Floods Survey: Report to the Insurance Council of Australia - A review of the operation of the claims handling standards within the General Insurance Code of Practice, during and in the period following the 2010/2011 Queensland Floods (FOS Qld Flood Survey Report). The FOS Qld Flood Survey Report is available as a download from
www.codeofpracticereview.com.au/TheReview/Reports.aspx
The Queensland Flood events have been described as ‘possibly the most significant and challenging disaster events in Australia’s recent history22.’ It is acknowledged that the events, in combination with other natural disasters that occurred in Australia at the same time, caused significant complexity and difficulties for both Code Participants and customers alike. This complexity stemmed in part from the number of claims that were lodged and the complex questions of fact and law to be taken into account when determining the cause of damage or loss.
The Code has since been amended by the ICA to enhance the section 3 claims handling standards and to remove section 4.3 from the Code altogether. The data collected during the review supports the ICA’s decision in February 2012 to remove section 4.3 of the Code. At the time of the events section 4.3 allowed Code Participants the flexibility to not meet the Code’s obligations if they were subject to a large number of claims as a result of a
catastrophe. Any Code Participant who relied on section 4.3 therefore was not in technical breach of the Code’s obligations, if they were unable to meet the claims handling standards within section 3.
These amendments to the Code should also ensure a marked difference in the claims handling experience of both Code Participants and customers if such events occur in future. The relevant standards under the May 2010 version of the Code and the changes that became operational on 1 July 2012 are outlined in Appendix A of this Report. A summary of
19
Flooding in Queensland between 21 December 2010 and 14 January 2011, affecting Brisbane, Toowoomba, Lockyer Valley and rural Queensland.
20
See www.insurancecouncil.com.au/media/39033/qld-flooding-december-2010.pdf 21
See www.insurancecouncil.com.au/industry-statistics-data/disaster-statistics.
22 Legal Aid NSW, 2011, ‘Inquiry into the operation of the insurance industry during disaster events”, Submission on behalf of Legal Aid NSW to the House of Representatives Standing Committee on Social Policy and Legal Affairs.
the claims handling difficulties experienced by Code Participants is in Appendix C of this Report.
It is acknowledged that the ICA and Code Participants have already taken significant steps to address many of the issues identified in our claims handling review. Whilst these
initiatives respond to and close some of the gaps in industry practice identified in our FOS Qld Flood Survey Report, some remain. These gaps and our recommendations are now under consideration by the ICA and the Independent Code Reviewer. A summary of our key findings follows.
1. The three most frequently identified sections causing the most difficulty for Code Participants in meeting the Code’s claims handling standards related to process or meeting timeframes, as follows:
a) Section 3.2.1(a) – Within ten business days of receiving a claim, notify the customer of the detailed information required to make a decision on the claim. There were 2,148 instances where this standard was not met.
b) Section 3.2.3 – Keep the customer informed of the progress of their claim, at least every 20 business days. This standard was not met in 1,906 instances. c) Section 3.1 – Within ten business days of receipt of a claim, decide to accept or
deny the claim and notify the customer of the decision if no further assessment or investigation is required. There were 1,447 instances where this standard was not met.
2. The reporting by Code Participants against the claims handling standards, both internally and to the Review, seem to have been primarily focussed on the timeliness of actions taken during the processing of claims. Timeliness is important, but it is only one element in an effective claims handling process. Compliance and reporting against conduct obligations within the Code, such as those related to fairness, transparency and the balancing of interests, are of equal importance to timelines and may need more prominence, particularly during times of catastrophe.
3. There appears to have been wide inconsistency by different Code Participants, in both the interpretation and application of sections 3 and 4 of the Code, during the
Queensland Floods events. The data suggested that this created a spectrum of
conduct and behaviour across the industry. Those insurers that attempted to follow the Code and its framework of good industry practice seemed better placed to engage effectively with customers. This in turn had a significant impact on the quality of customers’ claims experience.
4. In our view the specific obligations within the Code should always be interpreted in a manner which is consistent with the spirit of the Code and its objectives. The
interpretation of individual claims handling provisions in isolation from other Code provisions, can lead to a result that works against this outcome.
5. Communication models within insurance companies during natural disasters and catastrophes need to ensure active engagement with customers about how claims will be handled, the timeframes within which this will occur and the roles and
customer/insurer communication whilst handling claims can lead to perceptions of unfairness and lack of transparency of process.
6. The quality of the decision-making processes associated with claims handling during natural disasters can also impact on the claims handling experience of customers. A customer’s ability to access information from their insurer about reasons for decisions made and about the material relied on in making decisions are key elements in demonstrating that transparency and fairness are evident in the claims handling process.
7. It can also create an imbalance between the interests of the insurer and the customer and exacerbate perceptions associated with fairness and transparency. The insertion of an active Code obligation on the Code Participant to identify and list the information relied upon in reaching a decision to deny a claim, may assist in restoring some of this balance.
8. The development of guidelines to assist insurers in their interpretation and application of the Code may ensure that a more consistent approach to the Code’s operation and application during natural disasters is achieved across the industry. This guidance might include the type of information that should be provided to policy holders by Code Participants about the claims handling process and the rights and responsibilities that customers have during the process.
8 Code compliance monitoring and outcomes
8.1 How we monitor Code compliance
8.1.1 Our annual compliance monitoring programme
During the reporting period, we developed a new annual Code compliance monitoring programme, based on a three year cycle, which was launched on 1 July 2012. This is outlined in Diagram 3.
Diagram 3: New 3 year compliance monitoring programme
The programme, which is designed to foster:
Internal self-assessment and review of Code compliance by the Code Participant with clear oversight by the Chief Executive Officer or Chair of the Board.
Independent verification by the FOS Code Team and the CCC of Code compliance, monitoring and reporting activity by Code Participants.
The programme assists the FOS Code Team and the CCC to: Form a view about the overall level of industry compliance; Assess the adequacy of Code compliance frameworks; and Identify and report on emerging areas of compliance risk.
Annual Compliance Statement
Desktop Review
•Occurs once every 3 years. •Code Participant submits
compliance questionnaire and evidence of processes, procedures & systems. •FOS Code reviews &
analyses responses & evidence.
•FOS Code works with Code Participant to remedy non-compliance.
•FOS Code reports
outcomes quarterly to CCC & in public Annual Report.
AnnualCompliance Statment Self Certification •Occurs twice in 3 years. •Code Participant submits
compliance self-assessment questionnnaire.
•Requires Compliance and/or Business Unit to sight & verify procedures, processes & systems supporting compliance & provide sign-off.
•Requires CEO/Chair to certify compliance. •FOS Code reviews &
analyses responses.
•FOS Code works with Code Participant to remedy non-compliance.
•FOS Code reports breaches quarterly to CCC & included in public Annual Report.
Annual Return
•Occurs annually.
•Code Participant submits data about policies, claims and internal disputes. •Code Participant also
submits questionnaire about compliance activities. •Results are included in
8.1.2 Our investigations function
The FOS Code Team also conducts compliance monitoring through the investigation of reports of alleged Code breaches, and through significant breaches of the Code reported to us by Code Participants.
Breach allegations:We receive reports of alleged Code breaches23 from a variety of sources, including consumers and FOS EDR.
When we receive an allegation that the Code may have been breached, we contact the relevant Code Participant and provide it with an opportunity to respond to the breach allegations24. Further enquiries may follow after examining the Code Participant’s initial response.
A decision about whether a breach of the Code has occurred is made after all relevant information has been evaluated.25 If we conclude that the Code has been breached, we ask the Code Participant to implement appropriate corrective action in response to the breach within an agreed timeframe and then we monitor its implementation.26
We have detailed these steps in Diagram 4.
Diagram 4: Breach cause and corrective action
Where there are no breaches: Where a Code Participant asserts that it has complied with the Code’s requirements during an investigation, we ask it to explain the basis of its
conclusion and provide supporting evidence. For example, if a Code Participant advises that it has met the claims handling standards, we expect it to provide supporting evidence such as copies of its file notes and/or a chronology of its dealings with the customer.
23 The Code, section 7.11.
24 The Code, section 7.11(a) – (c). 25
The Code, section 7.11(d). 26
The Code, section 7.11(e).
Determine Cause, Impact & Scope of Breach
•What was the cause & duration of the breach?
•What was the impact of the breach, including the extent & nature of any consumer detriment, & how was that determined?
•Is the breach isolated?
•Have all affected consumers been identified?
•Have similar breaches occurred previously? •Have all compliance gaps been identified? •Are existing compliance arrangements
adequate?
Agree on Corrective Action, & Monitor Implementation
•What is the nature of the proposed corrective
action?
•Does it address the cause of the breach? •Does it address the breache's impact,
including consumer detriment?
•What is the timeframe for implementation & is it reasonable?
•Have the corrective actions been implemented?
•Have the corrective actions resolved the issue and reduced the likelihood of a recurrence?
Case Study One and Two have been provided as illustrations of the approach that we adopt in determining the cause and scope of a breach, and how it should be addressed.
Case Study One
The Code Participant issued a letter to a customer outlining its final response (IDR
Response) to the customer’s dispute. This included information about the availability of EDR in a footer on the last page of the letter, in font size 8, and without any footnote reference in the body of the letter.
Code obligation: The Code Participant is required to conduct complaints handling in a fair, transparent and timely manner. This includes providing information about a customer’s right to access EDR if they are not happy with the Code Participant’s decision.
Cause of breach: The Code Participant had standardised its IDR Response letters which were designed to place the footnote on the first page. When printing the IDR Responses using a double sided page format, on some occasions the information about EDR rights appeared in a footer on the back page of the letter. The Code Participant was not aware of this until we raised the matter with it.
Scope of breach: We asked the Code Participant to review all IDR Response letters during the period, to determine whether any other customers had received a similar letter. The Code Participant identified 12 other customers who had received such IDR Responses and who had not proceeded to EDR.
Corrective action: The Code Participant wrote to each affected customer, clearly informing them of their EDR rights. In addition, the Code Participant modified the template used for its IDR Responses. We reviewed the proposed letters to affected customers as well as the revised template IDR Response document, to ensure that EDR information was clearly identifiable.
Case Study Two
The Code Participant sought to recover an alleged debt from an uninsured third party who was represented by a community legal centre. The alleged debt arose from damage to a vehicle insured by the Code Participant.
The representative had asked the Code Participant to refer the uninsured third party’s matter to IDR because a dispute had arisen about their ability to repay the alleged debt. It also asked the Code Participant to consider waiving the debt on the basis of financial hardship. The Code Participant did not respond to the request and the representative contacted us for assistance.
We contacted the Code Participant and asked it to refer the dispute to IDR; to provide us with progress reports; and respond to our concerns about the way in which the dispute had been handled.
Code obligation: Section 6.1.1 of the Code requires the Code Participant to conduct complaints handling in a fair, transparent and timely manner.
Cause of breach: The Code Participant had previously sent its file to a recovery agent instead of to IDR. It had not responded to the representative’s correspondence, including the IDR request. The Code Participant retrieved its file from the recovery agent and, after
reviewing the dispute, decided to waive the alleged debt on the basis of the uninsured third party’s financial hardship.
Scope of Breach: The Code Participant reviewed a random selection of third party recovery files which showed that this was an isolated instance.
Corrective Action: As a result of the breach the Code Participant:
Provided refresher training to all debt recovery staff about early identification of
financial hardship matters, adherence to procedural and compliance requirements, and Identification and reporting of complaints to the IDR teams in a timely manner.
Provided feedback to staff managing debt recovery matters.
Extended monthly quality assurance monitoring to include the identification and escalation of IDR requests arising from recovery matters. Results from this monitoring programme did not identify any further matters of non-compliance.
Significant Breaches: Code Participants are required to monitor their compliance with the Code and identify and report significant Code breaches to us within ten business days. 27. The Code defines “significant breach” as a breach that is determined to be significant by reference to one or more of the following factors:
The number of similar previous breaches;
The adequacy of arrangements to ensure compliance with the Code; The extent of any consumer detriment; and
The duration of the breach.
We investigate these reported significant breaches to determine their scope and causes and monitor the Code Participant’s implementation of corrective action. We also assess whether the proposed corrective action is appropriate, including whether it addresses consumer detriment.
In addition to reports of significant Code breaches received from Code Participants, we may independently determine that a matter under investigation is a significant breach of the Code.
We have an obligation to report all significant breaches and agreed corrective action to the CCC.28
8.2 Outcomes of Code compliance monitoring activities
The aggregated breach data in this Report comprises data reflecting the:
27
General Insurance Code of Practice: Section 7.3 and Section 7.11. 28
1. Outcomes of our compliance monitoring activities during 2011 – 2012, drawn from the FOS Code Team’s investigations of alleged Code breaches and significant breaches of the Code, and the outcomes of Code compliance reviews29. Our aggregated breach data consists of finalised breaches only i.e. breaches which we identified or were reported to us by Code Participants as significant breaches, either prior to or during 2011 - 2012 and finalised during 2011 - 2012.
2. Outcomes of Code Participants’ monitoring activities during 2011 – 2012, identified through their internal breach reporting and monitoring programmes, in accordance with their Code monitoring obligation30. This self-identified breach data excludes breaches and significant breaches identified by us, and significant breaches reported to us by Code Participants.
Both sets of aggregated data are presented in Appendix D of this Report.
8.2.1 The number and types of breaches
During 2011 – 2012 we finalised 67 Code breaches arising from our monitoring activities. In addition, Code Participants reported that they had identified, and remedied, 2,724 Code breaches through their internal breach reporting and monitoring activities.
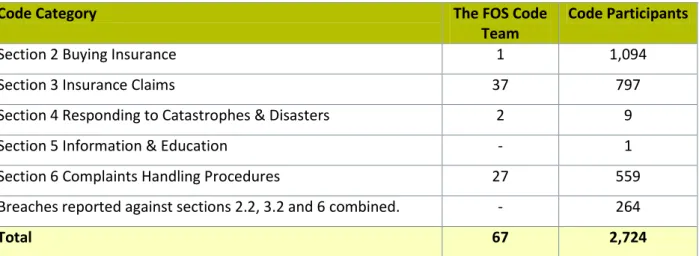
This data is summarised in Table 1 below and is provided in detail in Appendix D of this Report. A discussion of the nature and type of breaches identified during 2011 – 2012 follows.
Table 1 - Aggregated breaches in 2011 – 2012
Code Category The FOS Code
Team
Code Participants
Section 2 Buying Insurance 1 1,094
Section 3 Insurance Claims 37 797
Section 4 Responding to Catastrophes & Disasters 2 9
Section 5 Information & Education - 1
Section 6 Complaints Handling Procedures 27 559
Breaches reported against sections 2.2, 3.2 and 6 combined. - 264
Total 67 2,724
Section 2 Buying Insurance: 40% (1,904) of breaches identified by Code Participants and 2% of breaches finalised by us, arose from the standards of section 2 of the Code. The data in Appendix D of this Report also shows that
Almost one third of breaches (881 breaches) identified by Code Participants arose from section 2.2 of the Code, which requires a Code Participant to refund a premium to a customer within 15 business days.
29
The Code, sections 7.9, 7.12(a), 7.12(b). 30
Code Participants identified 135 breaches (5%) of section 2.4.1, which requires employees and authorised representatives of Code Participants to conduct their services honestly, efficiently, fairly and transparently.
Section 3 Claims: The Code’s claims handling standards accounted for 55% of breaches
finalised by us and 29% of Code Participants’ self-identified breaches. The data provided in
Appendix D shows that more than half of section 3 breaches finalised by us involved either section 3.4.1 or 3.6.1 of the Code, accounting for 16% of all breaches. However, only 1% of the breaches identified by Code Participants related to these standards. Section 3.4.1 requires claims handling to be conducted in a fair, transparent and timely manner, while section 3.6.1 requires claims services to be conducted honestly, efficiently, fairly and transparently.
Section 6Complaints Handling Procedures: Code Participants reported 559 breaches of section 6, accounting for 21% of self-identified breaches. Breaches of section 6 accounted for 40% of all breaches finalised by us. Section 6.1.1 of the Code requires complaints handling to be conducted in a fair, transparent and timely manner. Appendix D shows that 10% of the breaches finalised by us involved section 6.1.1 while Code Participants did not report any breaches of this standard.
Overall Aggregated Breach Data: Fairness and transparency underlie the way in which Code Participants, their Authorised Representatives, employees and service providers conduct themselves in their dealings with customers, and appear throughout the Code in sections 2.1.4, 2.4.1, 3.4.1, 3.6.1 and 6.1.1.
The breach data provided by Code Participants shows that 158 breaches, or 6%, arose from a lack of compliance with Code standards involving elements of fairness and transparency in dealings with customers. 28% of the breaches finalised by us involved these standards.
The remaining discussion in Part 8 of this Report focuses on the 67 Code breaches finalised by us.
These outcomes suggest that Code Participants’ internal breach reporting and Code
compliance monitoring frameworks may be more effective at measuring performance against Code obligations that involve specific timelines. Compliance with, and reporting against, the Code’s conduct obligations which relate to fairness, transparency and balancing interests are also important. We suggest that Code Participants consider strengthening breach reporting and Code compliance frameworks by:
Undertaking an analysis of IDR and EDR complaints and disputes data, to identify issues relating to conduct requirements, and/or
Extending internal claims file audits to include an assessment of the quality of the conduct, claims handling and decision making undertaken by Code Participants, to ensure that the interests of customers are being appropriately balanced with their interests.8.2.2 Breach sources
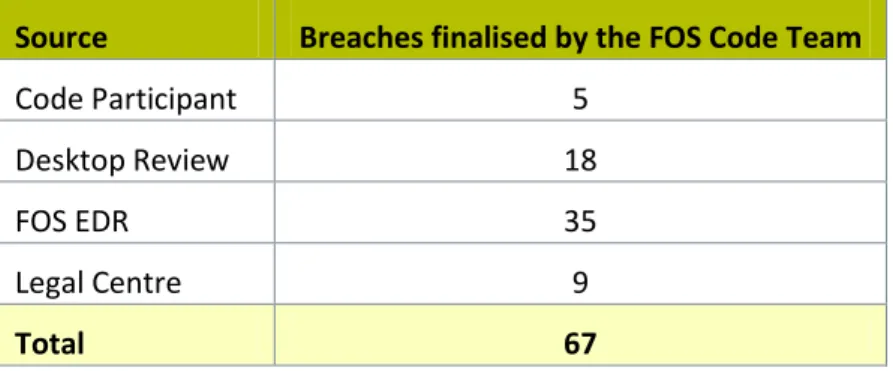
FOS EDR consistently remains the primary source of referral of breach allegations to the FOS Code Team as seen in Table 2.
Thirty-five (52%) of the breaches we finalised during the reporting period were identified from breach allegations referred to us by FOS EDR. In order for us to investigate breach
allegations referred from FOS EDR, the financial services provider in question must also be a Code Participant. At the time of this Report there were 30 Code Participants who were not members of the FOS EDR scheme.
A further 27% of Code breaches finalised by us were identified through our annual desktop compliance reviews.
This year 13% of finalised breaches were sourced from community legal centres, an increase from 9% in 2010 - 2011.
Table 2: Breach sources
Source Breaches finalised by the FOS Code Team
Code Participant 5
Desktop Review 18
FOS EDR 35
Legal Centre 9
Total 67
8.2.3 Breach causes & corrective actions
The predominant cause of Code breaches finalised by us in 2011 – 2012 was a failure to adhere to established processes, resulting in 28 breaches (42%). This was also the main cause of breaches in 2010 – 2011. A further 13 breaches (20%) were due to administrative errors, while 8 breaches (12%) were due to a failure to review documents to ensure
compliance.
Remedial training was the most common method used by Code Participants to address breaches of the Code. This method was used in 15% of the breaches finalised by us. A combination of updating documents, process improvement and providing information to affected customers was used to address seven finalised breaches (11%).
Appendix E of this Report provides detailed information about the causes of breaches and corrective actions undertaken by Code Participants.
8.2.4
Significant Code breaches
As highlighted earlier, we may determine that a breach of the Code is significant having regard to the Code’s definition of “significant breach”. Further, if a Code Participant identifies a significant breach of the Code, it is required to report it to us within 10 business days.31 Significant Code breach data is aggregated with all other breach data. We count a significant breach of a particular Code standard as one breach for reporting purposes. However, a significant breach usually encompasses multiple individual breaches of the relevant Code standard, as seen in each of the significant breach matters we dealt with during the reporting year and described below.
Significant Breach Report 1: Miscalculation of total loss payments - commercial and personal motor vehicle insurance cover.
The Code Participant provided various personal and commercial motor vehicle insurance policies. Each of these policies included an allowance for stamp duty when calculating the total loss payment due to a customer, based on the vehicle’s market value.
The Code Participant failed to include stamp duty allowance when settling a customer’s motor vehicle claim. It subsequently established that a total of 9,307 commercial and personal motor vehicle insurance customers were affected by similar miscalculations.
We were satisfied that the Code Participant’s omission of stamp duty from these calculations of total loss payments, contrary to the clear terms of the policy wording, was unfair to
customers and consequently in significant breach of section 3.4.1. The Code Participant’s corrective actions included:
Retraining all claims staff.
Reviewing all total loss payments made to relevant insurance customers over a six year period.
Assessing the stamp duty payable on each claim taking into account: the relevant State/Territory stamp duty requirements; the date of claim settlement; the vehicle’s pre-accident market value, use, place of registration, and size (if applicable). Reimbursing 9,307 customers a total of $5,287,370.17, including interest.
Notifying each affected customer in writing of the error and the steps being taken to rectify it.
Significant Breach Report 2: Miscalculation of loss of rent payments - commercial and residential landlord cover.
A Service Provider was responsible for assessing and settling claims for loss of rent
available through a number of policies, underwritten by the Code Participant, which provided landlord cover for residential and commercial properties. The Code defines “Service
Provider” as including an external claims management service.
The relevant policies included a definition of “rent” which the Service Provider had incorrectly
31
interpreted as authorising it to deduct third party payments from rental monies owing to policyholders, for loss of rent claims. The Code Participant accepted that the definition of rent was not sufficiently clear and effective to authorise the deduction of such third party payments.
Our investigation established that the Service Provider had incorrectly deducted third party payments from monies owed to policyholders for loss of rent in relation to at least 65 claims. We considered this to be a significant breach of section 3.6.1, due to the failure to conduct claims handling in a fair manner.
The Code Participant’s corrective actions included:
As at 30 June 2012, making payments of $26,985.70 to 65 customers, including interest.
Directing the Service Provider to stop deducting third party payments from loss of rent settlements, to ensure that assessment of all future claims for loss of rent occurred in accordance with the terms of the policy.
Identifying all closed and current claims affected by this issue during a four year period. This established that both residential and commercial property customers had been affected.
Notifying each affected customer in writing of the error and the steps being taken to rectify it.
This matter remained open as at 30 June 2012, while the Code Participant continued to review claim files to ensure that all affected customers had been identified.
Significant Breach Report 3: Delays in claims handling - commercial and personal travel insurance products.
We received a report from the relevant Code Participant that its Service Provider had significantly breached sections 3.1, 3.2.1(a) and (c), 3.2.4 and 3.3 of the Code. Section 3.1 requires a claim decision to be made and notified to a customer within 10 business days of the receipt of a claim, in circumstances where further information, assessment or investigation of the claim is not required.
The provisions of section 3.2 of the Code apply to claims which require further information, assessment or investigation. Section 3.2.1(a) and (c) provide that within 10 business days of receiving a claim a Code Participant must notify a customer of the detailed information it requires to make a claim decision; and provide an initial estimate of the time required to make a decision on the claim.
Section 3.2.4 and section 3.3 require a Code Participant to respond to a customer’s routine requests for information within 10 business days; and agree reasonable alternative
timeframes with a customer when the timeframes in section 3.1 or 3.2 are not practical. In this matter the Service Provider experienced an unexpected influx of claims and an increase in call volumes during a two month period. As a result, it did not have sufficient resources to comply with the claims handling standards in relation to 6,380 new claims, or
48% of the claims it received during that period.
The Service Provider was unable to identify the cause of the increase in claims and calls and it notified the Code Participant of this issue. The Code Participant was satisfied that the circumstances amounted to a significant breach of the Code and reported the matter to us in accordance with its obligation under section 7.3 of the Code.
Despite the number of affected claims, consumer detriment was limited as: The maximum timeframe for responding to a claim was relatively short. Financial hardship claims and other urgent claims remained unaffected.
All other services that the Service Provider was required to provide to customers remained unaffected.
All complaints and disputes were handled in accordance with the standards of section 6 of the Code and ASIC Regulatory Guide 165 (Licensing: Internal and External Dispute Resolution).
Remedial action implemented by the Service Provider included:
Recruitment and training of 13 additional staff, seconding experienced claims staff from other areas and extending working hours for claims staff.
Ensuring that continued priority was given to all urgent claims during this time. Development of a specialised claims area to resolve enquiries and claims, request
supporting documentation, and fast track appropriate claims.
Negotiating alternative claims assessment timeframes with customers where appropriate.
Notifying each affected customer in writing of the possibility of a delay in processing their claim and providing a new timeframe within which the customer could expect a response to their claim. The letter also informed the customer to contact the Service Provider in the event of financial hardship.
Daily monitoring of claims handling timeframes.
Auditing a subsequent random selection of open and closed files, to determine whether claims handling timeframes continued to be met.
This matter remained open as at 30 June 2012 while we considered whether the Code Participant had effectively remedied the issue.
8.3
Code Participants’ Code Compliance Initiatives
Many Code Participants confirmed that they had undertaken specific initiatives to improve their Code monitoring and reporting frameworks in 2011 – 2012. The 11 major initiatives reported to us follow.
Complaints
1. Centralisation of IDR functions to ensure consistent handling of complaints and disputes and facilitate early identification of Code issues.
2. Increased engagement between compliance and customer relations teams, to review complaints issues; discuss investigations which may be needed into areas highlighted by complaints; and facilitate identification of potential significant or systemic issues.
3. Review of general insurance complaints handling processes and procedures to ensure greater compliance with Code requirements.
Governance and Risk Compliance
4. Enhancements to the assurance framework across sales and claims teams to improve the approach to targeted reviews and to identify trends arising from internal Code compliance indicators.
5. Enhancement of a claim file management system to enable identification and tracking of key dates in the claims management cycle, and monitoring of performance against the new claims handling timeframes in the July 2012 Code.
6. Increased engagement with external business partners and service providers to ensure continuing compliance with the July 2012 Code.
7. Review and investigation of internal process and/or procedures identified through referral of alleged Code breaches by FOS and compliance incidents, to correct and prevent the reoccurrence of Code breaches.
8. Review of insurance breach and incident management procedures to ensure that Code breaches are included.
9. Use of a senior management committee to identify the steps required to effectively implement the July 2012 Code changes, and review the Code’s monitoring and reporting framework to facilitate compliance with the July 2012 Code.
Training
10. Reinforcement of internal policies and procedures and Code standards through tailored coaching and/or training sessions with relevant business areas, teams and staff, to correct and prevent the reoccurrence of Code breaches.
11. Review and revision of a compliance training module specific to the Code. These initiatives help to demonstrate Code Participants’ commitment to their Code
obligations and should enhance and strengthen Code monitoring frameworks. We have also summarised Code Participants’ monitoring activities in Appendix F of this Report.
9 General Insurance Industry Data 2011 – 2012: Policies, Claims and
Disputes
9.1 How to read Part 9 of the Report
Part 9 of the Report outlines the extent and nature of the Australian general insurance industry in 2011 – 2012 based on policies, claims, declined claims and internal disputes data provided to us by Code Participants. Data about withdrawn claims has also been collected and this is discussed later in Part 9.6. The complete data set32 is located in Appendices G, H and I of this Report.
We have identified several common factors which in our view have contributed to the variations seen in the 2011 - 2012 data, when compared to other reporting years. These factors must be kept in mind when interpreting the data. While the 2011 – 2012 data provides insights into Code Participants’ dealings with customers, the scope to draw conclusions and identify trends about particular classes of general insurance across reporting years is limited. We have referred to specific contributory factors where relevant and outlined the principal factors here:
1. Six new Code Participants, including two general insurers, provided annual data to us for the first time. The growth in Code participation explains some of the variations in particular classes of general insurance and across all data types.
2. We revised the way in which we categorised some data about policies, claims, declined claims and internal disputes, in particular classes in the Annual Return. This change has contributed to shifts in data across the categories, for example:
Data about Landlord and Residential Strata insurance products are now included in Home Building & Contents Combined and Home Building
respectively. This data was previously reported in “Other”.
All data about products that was previously reported under “Caravans, Mobile Homes, Trailers”, “Other”, “Pleasurecraft” or “Personal Valuables”, is now included in Personal and Domestic Property.
The former categories “Caravans, Mobile Homes, Trailers”, “Other”, “Pleasurecraft” or “Personal Valuables”, have been removed.
3. There was variation across Code Participants in the way in which they recorded or reported on the data during the reporting year. For example:
Some Code Participants counted claims against combination or package products, such as Home Building & Contents Combined or Farm,as single claims, while other Code Participants reported them as multiple claims.
Partially accepted claims were recorded as declined claims by a number of Code Participants.
Withdrawn claims were recorded by some Code Participants as declined claims. Declined claims data was recorded inconsistently by some Code Participants. Where a combination or package policy covers more than one class of business,
such as Farm, some Code Participants were able to count each class separately.
32 Data expressed as a percentage has been rounded up or down to the nearest whole number, and a reference to “<” means “less than”.
4. Continuing improvements in the recording and reporting of data led to the provision of more accurate and comprehensive data by some Code Participants, particularly in relation to declined claims. In some instances declined claims data about particular insurance products was provided for the first time.
9.2 Overview of Key Industry Data
9.2.1 Policies
In 2011 – 2012 there were 39,007,318 general insurance policies reported to FOS by Code Participants. This represents an increase of 5% or 2.2 million additional general insurance policies over the 2010-2011 year. Personal Motor comprised the largest general insurance class (12,877,716 policies) followed by Home (11,123,760 policies).
A significant part of this increase can be attributed to the receipt of policy data for the first time from six new Code Participants, including two general insurers. This added at least 1.2 million policies to the overall total. This still leaves however, an increase of approximately 1 million policies over the previous reporting year.
The number of personal insurance policies reported by Code Participants has increased by 7% from 2010-2011. This increase has been evident in a number of areas: Accident and/or Sickness (50% up), Consumer Credit (15% up), Home33(6% up), Personal Motor (5% up) and Travel (11% up). The factors that Code Participants have indicated might have contributed to the overall increase in policy numbers include:
Increased consumer demand for Travel and Home Building & Contents Combined
policies in particular.
An enhanced ability by some Code Participants to report on individual risk classes within packaged policies.
Policy data is discussed further in Part 9.3.
9.2.2 Claims
Overall, there was a 1% increase in claim numbers during the reporting year. The claims to policy ratio for all claims remained unchanged however, at 10%. There were some
significant changes in claim numbers in certain personal insurance classes, one of which is
Travel.
Travel claims increased 31% on the 2010-2011 figures. Code Participants have advised that some of this increase can be attributed to the collapse of airline Air Australia on 17 February 2012. In addition, expanded risk coverage within these types of policies may have led to additional claims being lodged.
Whilst aggregated claims data in the Home category fell 5%, there was a 79% increase in the number of claims lodged in Home Building & Contents Combined, (a subset of the
Home category). This latter increase was offset in part by a decrease in the number of claims lodged for the Home Building and the Home Contents categories(both of which are also subsets of the Home category). Code Participants have advised that the increased number of claims lodged for Home Building & Contents Combined was in part due to the
33
Home is an aggregation of data from Home Building, Home Building & Contents Combined and Home Contents
impact of the extreme weather events in 2011 – 2012 and the residual effect of previous catastrophes in 2010 - 2011. Claims data is discussed further in Part 9.4.
9.2.3 Declined Claims
In 2011 – 2012, 3% of all general insurance claims lodged with Code Participants were declined. That represents a 1% increase on 2010 – 2011 (up from 2%).
Code Participants reported that they declined 97,118 claims in 2011 – 2012. This
represented a 46% increase on the previous year’s figure of 66,296 claims. This increase can in part be explained by a 53% increase in the number of personal insurance claims that were declined during the reporting year (91,451 declined claims).
This 53% increase was particularly evident in relation to:
Home – there was a 57% increase in the number of declined claims based on
aggregated data from all three Home classes. Personal Motor – was up 66%.
Travel – was up 55%.
Code Participants have advised that the increased number of declined claims reported in these specific classes can in part be explained by:
The continued flow on effect from the 2010 – 2011 Queensland flood events. Some of these claims were not declined until the 2011 - 2012 reporting year due to the
complexity of the investigations required to determine whether the damage and/or loss was due to flood.
A number of claims for damage or loss generated by extreme weather events during 2011 – 2012, which were declined on the basis that the damage or loss was not covered by the policy terms.
Continued refinement of their data recording and reporting systems.
The increase in declined claims however, is significant and in our view requires further assessment by Industry.
The number of declined claims in 2009 – 2010 and 2010 – 2011 were 67,724 and 66,296 respectively. If the data in this reporting year can in part be explained by the scale and impact of the natural disasters that occurred during 2010 – 2011 and 2011 – 2012, we would expect to see a corresponding decrease in declined claims in 2012 – 2013.
Our analysis has revealed however, that the declined claims data being reported to us may include partially accepted claims data and withdrawn claims data. This reduces our ability to identify annual trends.
We encourage Code Participants to review their internal processes to ensure they can differentiate claims data into three categories: declined claims, partially accepted claims and withdrawn claims. As highlighted by ASIC34, the ability to differentiate data in this way will enhance analysis and assist Code Participants and FOS to more readily identify emerging trends in declined claim rates.
34
In our view, a declined claim is one where a Code Participant has made a decision to deny indemnity having had regard to the terms and conditions of the particular policy. It excludes partially accepted claims. Declined claims data should also exclude withdrawn claims data. The defining feature of a withdrawn claim is that it is withdrawn before a Code Participant formally accepts or denies the claim.35 Declined claims data is discussed further in Part 9.5.
9.2.4 Disputes and Internal Dispute Resolution
Our observations about disputed claims are based on industry data recorded by Code Participants between 1 July 2011 and 30 June 2012. We note that recent data published by FOS between 1 July 2012 and 31 March 2013 has shown a general flattening or decline in general insurance disputes over the first nine months of this financial year.36 It is therefore possible that the 2011-2012 data is not representative or indicative of more recent trends. There was a 24% increase in the number of internal disputes lodged with Code Participants during 2011-2012. This is not unexpected given the 46% increase in declined claims. It is also consistent with an increase in the number of general insurance disputes received by FOS EDR during the reporting year. In its 2011 – 2012 Annual Review FOS reported a 19% increase in the number of general insurance disputes it received when compared with 2010 - 2011.37
Of disputes lodged during the reporting year, there was a substantial increase of 26% in disputes arising from personal insurance classes. In addition, there was a 25% increase in disputes about insurance claims. Other reasons for a dispute might include matters arising from buying insurance and matters related to services provided by Code Participants’ authorised representatives, employees and service providers.
Some of the disputes concerning insurance claims may relate to claims decisions or delays in claims handling arising from the impact of natural disasters in 2010 – 2011. Code
Participants have also identified heightened consumer awareness of the availability of internal dispute resolution as another factor contributing to the increase in dispute numbers. The outcomes of internally reviewed disputes remained relatively consistent with previous reporting years, largely in favour of Code Participants. The data shows that overall dispute outcomes were 70:30 in favour of Code Participants, while in 2010 – 2011 it was 68:32. As noted above, the 2011-2012 data may not be representative or indicative of more recent trends. We encourage Industry however, to reflect on its claims decision making and IDR frameworks to ensure that disputes are not related to the fairness, transparency or timeliness of claims decisions or the outcomes of internal disputes. We refer Code
Participants to the recommendations made in the FOS Qld Flood Survey Report38 for further guidance.
Disputes data is discussed further in Part 9.7.
35ASIC Report 245: Review of general insurance claims handling and internal dispute resolution procedures, August 2011, page 20.
36
Recent FOS disputes statistics are available from www.fos.org.au/centric/the_circular_13_home/statistics/statistics_report.jsp 37 Financial Ombudsman Service 2011 – 2012 Annual Review, page 26.
38
9.2.5 Withdrawn Claims
A total of 55 Code Participants reported that 120,573 claims were withdrawn during the reporting year. This corresponds to 3% of all claims made. We do not believe however, that this is an accurate assessment of withdrawn claims across the Industry, as 96 Code
Participants were unable to provide withdrawn claims data. We are also unable to ascertain the stage at which these claims were withdrawn and the reasons for withdrawal, from the data currently reported to us.
We note however, the significant disparity between the number of declined Personal Motor
claims against the high number of withdrawn Personal Motor claims. Withdrawn claims data is discussed further in Part 9.6.
9.3 Policies - 2011 - 2012
The total number of general insurance policies has remained relatively steady, with spikes in some classes as seen in Chart 1 below.
Chart 1 – General Insurance Policies by Class in 2010 – 2011 and 2011 – 2012
Code Participants reported that there were 39,007,318 general insurance policies in 2011 – 2012, consisting of 4,827,243 commercial policies and 34,180,075 personal policies.
Personal insurance policies represented 88% of all policies held by customers.
11,905 141,184 58
8,96
9
260,553 41,858 245,189 60,265
11,
345
147,510 618,301 277
,039
42,246 220
,068 49,591 0 2,000,000 4,000,000 6,000,000 8,000,000 10,000,000 12,000,000 14,000,000 16,000,000 18,000,000 20,000,000 Av iat ion Bu ilders W ar ra n ty Bu sin es s Com m ercial Mo to r Com m ercial Ot h er Con tra cto rs All Ris ks Farm In d u stria l Sp ecial Ris ks Lia b ili ty Acc id en t & /or Sic kn es s Con su m er Cre d it H o m e - Bu ildin g H o m e - Bu ildin g & Co n ten ts Com b in ed H o m e - Con ten ts Pe rs on al & Dom es tic Prop erty Pers o n al Mo to r Tra ve l
Commercial Personal
2011-2012 2010-2011