International Journal of Research in Engineering and Applied Sciences(IJREAS) Available online at http://euroasiapub.org/journals.php
Vol. 7 Issue 5, May-2017, pp. 57~69
ISSN (O): 2249-3905, ISSN(P): 2349-6525 | Impact Factor: 7.196 | Thomson Reuters Researcher ID: L-5236-2015
Petrophysical evaluation and reservoir characterization of the “X” Field, Niger
Delta using well log data
Eze, M. Onyinye.1
Department of Geology,
Michael Okpara University of Agriculture, Umudike.
Okenya, E. Newton.2
Department of Physics,
Michael Okpara University of Agriculture, Umudike2.
Agbo, C.Christian.3
Department of Geology,
Michael Okpara University of Agriculture, Umudike.
ABSTRACT
The wireline log data were studied to characterize the porosity, water saturation, volume of shale of the “X-field” reservoirs. The results of the analysis revealed a total number of 23 reservoir (sand) units in well one, 7 reservoir (sand) units were delineated in well Two. And in Well three, 19 reservoir (sand) units were characterized. The thickness of each sand unit varied between 5.0m and 35.0m in well one, 12.0m and 32.0m in well two and between 1.0m and 27.0m in well three. The porosity values range between 15% and 39%. The volume of shale is not within the limits that could affect the water saturation (between 0.08 v/v decimal to 0.082 v/v decimal) and well above the limit in some reservoirs(>10%). The water saturation (Sw) values of the reservoirs in the study area range from 0.053% - 0.95% which invariably are indication that the hydrocarbon saturation are high in some reservoirs (i.e Sh ranges between 67% - 95%). The reservoirs in well one are more
than reservoirs in well two and three. The hydrocarbon in most of the reservoirs could be gas with the negative crossing of the neutron and density logs. On the other hand, the high Sw values of reservoir “H1”, “J1” “K1” and “O1”, “F2” “L3”, “N3” and “ P3” are evident that they are water filled (64% - 98%). Also, the high resistivity values of reservoirs “H1”, “J1”, “M1”, “P1”, “U1”, “P2”, “R3”, suggest presence of hydrocarbon while the low resistivity values of reservoirs “H1”, “J1”, “K1”, and “O1”, “F2”, “P3,” “N3” confirm they are water filled.
International Journal of Research in Engineering and Applied Sciences(IJREAS) Vol. 7 Issue 5, May-2017
ISSN (O): 2249-3905, ISSN(P): 2349-6525 | Impact Factor: 7.196
1.1: INTRODUCTION
The ever- increasing demand for hydrocarbon products since the 20th century prompted
intensified exploration for oil and gas accumulation reservoir rocks of Niger Delta basin. This is after a long while of non-productive search in the Cretaceous sediments of the Benue trough (Doust and Omatsola, 1990). The Niger Delta is a Cenozoic gross offlap clastic succession built out atop Anambra Basin and forming a part of the western African miogeocline that spread out onto the cooling and subsiding (Whiteman 1982, Wright et.al. 1985) oceanic crust generated as the African and South American lithospheric plates separated. It covers a 75,000 square kilometer area within the Gulf of Guinea, West Africa and is composed of an overall regressive clastic sequence which reaches a maximum thickness of 30,000ft to 40,000f (Weber and Daukoru, 1975; Evamy et al., 1978; Doust and Omatsola, 1990) (Figure 1). The interest of this work is to characterize the reservoir sands encountered by the three deep wells in the “X” field of Niger delta basin using well log data.
Many different modern geophysical well logs exist. They are record of sophisticated geophysical measurements along a borehole (Riders, 1996). These may be measurement of spontaneous phenomena, such as natural radioactivity (gamma ray), which requires a tool consisting simply of a very sensitive radiation detector or they may be induced, as with the formation velocity log (sonic log), in which a tool emits sound into the formation and measures the time taken for the sound to reach the receiver at a set distance along the tool. Geophysical well log is necessary because geophysical sampling during drilling (cutting sampling) leaves a very imprecise record of the formations encountered. Entire formation samples can be brought to the surface by mechanical coring; this is both slow and expensive. The results of logging is precise, and needs interpretation to bring a log to the level of geophysical or petrophysical experience.
2. REGIONAL SETTING AND STRATIGRAPHY OF NIGER DELTA:
Sediments began to accumulate in this region during the Mesozoic rifting (Weber and Daukoru, 1975) associated with the separation of the African and South American continents. Synrift marine clastics and carbonates accumulated during a series of transgressive-regressive phases between the Cretaceous to early Tertiary; the oldest dated sediments are Albian in age (Doust, and Omotsla 1989). These synrift phases ended with basin inversion in the Late Cretaceous (Santonian), by Late Cretaceous and Early Cenozoic time the continental margin subsided as the oceanic crust cooled. Proto Niger-delta regression continued as continental margin subsidence resumed at the end of the Cretaceous (Maastritchian). The Proto-Niger consists of deposits of the regressive interval in the latest cretaceous into the earliest Paleocene (Danian) (Short, and Stauble, 1967).
International Journal of Research in Engineering and Applied Sciences(IJREAS) Vol. 7 Issue 5, May-2017
ISSN (O): 2249-3905, ISSN(P): 2349-6525 | Impact Factor: 7.196
based on the dominant environmental influences (Nwajide, 2013). The main sedimentary environments are the continental environment, the transitional environment and the marine environment. According to Nwajide, (2013), the next marine transgression was across southern Nigeria and terminated the advance of the Proto- Niger Delta which is the Southern Benue Trough “coal measures”. On the assumption that the modern Niger Delta includes from the first major Cenozoic transgression, Niger Delta stratigraphic units is classified into outcropping and subsurface (Nwajide, 2013). The outcropping series range from Imo Formation through Ameki Formation, through Ogwashi-Asaba Formation to the Benin Formation. Subsurface series are the Akata Formation to the Benin Formation. The three lithostratigraphic units are as follows:
2.1: Akata Formation: Akata Formation ranges in age from Paleocene to Recent (Nwajide, 2013). This is the basal major time transgressive lithologic unit in the Niger Delta complex. It comprises mainly of shales with occasional turbidite sandstones and siltstone. The major fossil diagnostic of the formation are basically planktonic foraminifera. This formation is under compacted and over pressured by sediment loading of the overlying bed.
2.2: Agbada Formation: Agbada Formation is strongly diachronous getting younger basinward i.e generally from northeast to southwest and the thickness varies greatly across the Delta (Nwajide, 2013). The maximum thickness is 4,500m (Merki, 1972), while Weber and Daukoru (1975) gave range from 9,600 to 14,000 ft. The formation consists of sands or sandstones and marine shales. The sandy parts constitute the main hydrocarbon reservoirs while the shales constitute seals to the reservoir. It is characterized by alternating sandstones and shales of delta-front, distributary channel and deltaic plain origin that represent a coarsening upward regressive succession (Short and Stauble, 1967). The environment is defined as “transitional” between the upper continental Benin Formation and the underlying marine Akata Formation. The Formation is the principal reservoir of Niger delta 11.
International Journal of Research in Engineering and Applied Sciences(IJREAS) Vol. 7 Issue 5, May-2017
ISSN (O): 2249-3905, ISSN(P): 2349-6525 | Impact Factor: 7.196
Fig. 1: Sectional mapof Niger Delta showing the Depobelts( Nwozor, et.al, 2013).
3. METHODOLOGY
The resistivity logs were first used to identify hydrocarbon or water saturation zones. The various sand bodies were then identified on the gamma ray logs (Slumberger, 1975). Gamma ray was used to calculate the gamma ray index using the following formula,
GR
I
log log
log log
GR
GR
GR
GR
Where, IGR = gamma ray index
GRlog = gamma ray reading of formation
GRmin = minimum gamma ray (clean sand) and
GRmax = maximum gamma ray (shale).
The shale volume was then calculated using the (Larionov, 1969) nonlinear response methods.
Vsh = 0.083(23.71 IGR– 1) (For tertiary unconsolidated rocks)
International Journal of Research in Engineering and Applied Sciences(IJREAS) Vol. 7 Issue 5, May-2017
ISSN (O): 2249-3905, ISSN(P): 2349-6525 | Impact Factor: 7.196
Porosity: Porosity was calculated from density log using the following formula:
ΦD = ρma - ρb
ρma - ρfl Where:
ФD = density porosity
ρma = matrix density (sandstone) 2.65g/cm3
ρb = bulk density (log reading) and
ρfl = fluid density = 1.0g/cm ( for water), 0.7 for gas, and 0.9 for oil.
Water Saturation: This is the amount of pore volume in a rock that is occupied by formation water
(Asquith, and Krygowski, 2004). The water saturations were computed using the (Archie, 1942) equation.
The water saturation formulas used are as follows: Archie’s equation:
Sw: is the water saturation
Rw: is the formation water resistivity (derived by Picket plot).
Rt: is the uninvaded zone resistivity determined from the deep resistivity log
Φ: is the formation porosity determined from the density log.
a: = 1 (Tortuosity factor).
m = 1.6 (derived from average value of core interpretation result) cementation factor.
4: WELL LOG DATA ANALYSIS AND RESULTS
The materials used for this work are three composite wireline logs. The wireline logs include gamma ray log (GR), neutron logs, sonic log, density log, self-potential (SP), resistivity log and caliper logs.
4.1: WELL ONE
In this well, a total number of 23 reservoirs (“A1”-“W1”) were delineated. The average shale volume (Vsh) of the reservoirs in well 4 is between 0.018v/v to 0.34v/v decimal. This suggests that
reservoir “U1”, with Vsh value of 0.34v/v decimal is above the limit of 15% that can affect the water
saturation. Most of the reservoir’s volumes of shale are below the limits of (>10%- 15%) which could affect the value of water saturation value. The average porosity values for the reservoirs range between 0.24% - 0.40%, which indicate good porosity values of typical Niger Delta reservoirs. Reservoir with high value of resistivity is likely hydrocarbon zone and water saturation
Sw = a x Rw
Rt x Фm
International Journal of Research in Engineering and Applied Sciences(IJREAS) Vol. 7 Issue 5, May-2017
ISSN (O): 2249-3905, ISSN(P): 2349-6525 | Impact Factor: 7.196
values for the reservoirs suggest that the reservoirs are mainly water bearing. The negative crossing of the density log and neutron log signature of the following reservoirs “I1”(2885ft-2896ft), “L1”(3166ft-3131ft), “M1”(3155ft-3175ft), “P1”(3345ft-3374ft), “Q1”(3462ft-3467ft) and “U1”(3815ft-3825ft) suggest that it could be gas (Fig.2). In addition, high resistivity values at those zones also support the evidence that the reservoir is gas bearing (Table 1).
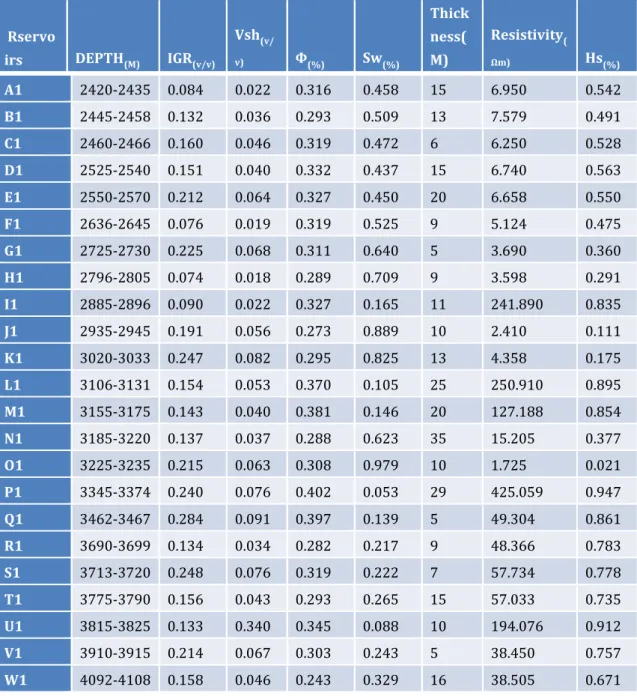
TABLE 1: SUMMARY OF RESERVOIR’S PROPERTIES OF WELL ONE
Rservo
irs DEPTH(M) IGR(v/v)
Vsh(v/
v) Φ(%) Sw(%)
Thick ness( M)
Resistivity(
Ωm) Hs(%)
A1 2420-2435 0.084 0.022 0.316 0.458 15 6.950 0.542
B1 2445-2458 0.132 0.036 0.293 0.509 13 7.579 0.491
C1 2460-2466 0.160 0.046 0.319 0.472 6 6.250 0.528
D1 2525-2540 0.151 0.040 0.332 0.437 15 6.740 0.563
E1 2550-2570 0.212 0.064 0.327 0.450 20 6.658 0.550
F1 2636-2645 0.076 0.019 0.319 0.525 9 5.124 0.475
G1 2725-2730 0.225 0.068 0.311 0.640 5 3.690 0.360
H1 2796-2805 0.074 0.018 0.289 0.709 9 3.598 0.291
I1 2885-2896 0.090 0.022 0.327 0.165 11 241.890 0.835
J1 2935-2945 0.191 0.056 0.273 0.889 10 2.410 0.111
K1 3020-3033 0.247 0.082 0.295 0.825 13 4.358 0.175
L1 3106-3131 0.154 0.053 0.370 0.105 25 250.910 0.895
M1 3155-3175 0.143 0.040 0.381 0.146 20 127.188 0.854
N1 3185-3220 0.137 0.037 0.288 0.623 35 15.205 0.377
O1 3225-3235 0.215 0.063 0.308 0.979 10 1.725 0.021
P1 3345-3374 0.240 0.076 0.402 0.053 29 425.059 0.947
Q1 3462-3467 0.284 0.091 0.397 0.139 5 49.304 0.861
R1 3690-3699 0.134 0.034 0.282 0.217 9 48.366 0.783
S1 3713-3720 0.248 0.076 0.319 0.222 7 57.734 0.778
T1 3775-3790 0.156 0.043 0.293 0.265 15 57.033 0.735
U1 3815-3825 0.133 0.340 0.345 0.088 10 194.076 0.912
V1 3910-3915 0.214 0.067 0.303 0.243 5 38.450 0.757
International Journal of Research in Engineering and Applied Sciences(IJREAS) Vol. 7 Issue 5, May-2017
ISSN (O): 2249-3905, ISSN(P): 2349-6525 | Impact Factor: 7.196
Fig. 2: Composite log of well one
4.2:WELL TWO
In this well, 7 reservoirs (“A2”-“G2”) were delineated and have average thickness which ranges from 12m in reservoir “B2” to 32m in reservoir “F2”. The average shale volume content (Vsh) of the
reservoirs is between 0.05v/v in “A2” and “D2” decimal to 0.1v/v decimal in reservoir “E”. These Vsh values are not within the limits that could affect the values of water saturation (Hilchie, 1978) and suggests that the reservoirs are clean.
The average porosities of the reservoirs are good enough (17%-28%) and the average true resistivity (Rt) value are relatively low (11.9Ωm-124.8Ωm) except reservoirs “D2” which has a resistivity value of 124.776Ωm. The resistivity value of reservoir “D2” recorded the highest Rt value (4000ft-4030ft) and this is a quick indication that the zone is likely a hydrocarbon bearing zone. The low water saturation of reservoir “D2” (40%) indicates 60% hydrocarbon saturation. The average water saturation of these reservoirs ranges between 27%-77%%.The high water
International Journal of Research in Engineering and Applied Sciences(IJREAS) Vol. 7 Issue 5, May-2017
ISSN (O): 2249-3905, ISSN(P): 2349-6525 | Impact Factor: 7.196
saturation values of reservoirs “C2” and “F2” in this well is indicative of poor hydrocarbon saturation in the reservoirs in the reservoirs (see table 2 and fig. 3)
TABLE 2: SUMMARY OF RESERVOIR’S PROPERTIES OF WELL 2 Reservoir
s
DEPTH(M
) φ(%)
IGR(v/v ) vsh(v/v ) Sw(% ) Thickness(M ) Resistivity(Ωm
) Hs(%)
A2
3160-3181
0.26
5 0.161 0.051 0.273 21 39.345
0.72 7 B2 3850-3862 0.20
8 0.250 0.093 0.407 12 47.409
0.59 3 C2 3865-3889 0.18
0 0.175 0.051 0.611 24 23.755
0.38 9 D2 4000-4030 0.19
3 0.151 0.047 0.403 30 124.776
0.59 7 E2 4175-4205 0.16
7 0.196 0.102 0.508 30 72.691
0.49 2 F2 4210-4242 0.16
4 0.204 0.068 0.773 32 11.949
0.22 7 G2 4290-4314 0.15
1 0.175 0.058 0.575 24 24.989
International Journal of Research in Engineering and Applied Sciences(IJREAS) Vol. 7 Issue 5, May-2017
ISSN (O): 2249-3905, ISSN(P): 2349-6525 | Impact Factor: 7.196
Fig. 3: Composite log of well Two
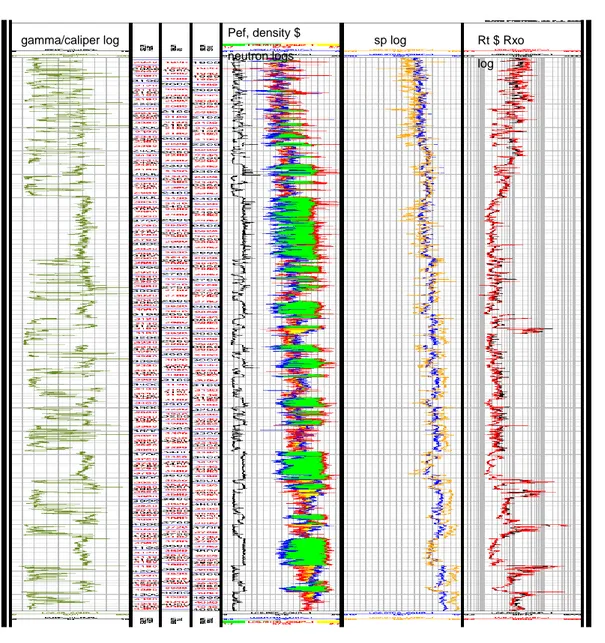
4.3:WELL THREE
Good reservoir was also encountered in this well with reservoir thickness ranging from 1m in S3 to 27m in P3. Most of the reservoirs are clean and are indicated in their low value of volume of shale content (Vsh) except reservoir “O3” and “R3” whose Vsh values exceeded the limits that could
affect the water saturation. Their Vsh values are 19% and 21% respectively. Their porosity values range between 26% to 32% and show they can accommodate fluid. The average true resistivity value for reservoirs “Q3”, “R3”, “S3” (91.93Ωm, 151.07Ωm, 72.71Ωm respectively) is a quick look indication that the interval contains hydrocarbon.
Although, the reservoirs have better to excellent porosity values, hydrocarbon accumulation could be traced only in reservoirs with high resistivity values such as “given as 91.93Ωm, 151.07Ωm, 72.71Ωm respectively is a quick look indication that the intervals contain hydrocarbon. Their water saturation of reservoirs Q3” “R3” & “S3” (Sw) are low (17%, 26%, 31%), which invariably are indication that the hydrocarbon saturations are high (Hs- 82%, 77%, and 73%). The hydrocarbon in reservoir “S”( 3030m -3031m) could be oil with the tracking together of the
gamma/caliper log Pef, density $
neutron logs
sp log Rt $ Rxo
International Journal of Research in Engineering and Applied Sciences(IJREAS) Vol. 7 Issue 5, May-2017
ISSN (O): 2249-3905, ISSN(P): 2349-6525 | Impact Factor: 7.196
density and neutron log signatures while the hydrocarbon in reservoir “Q3”( 2600- 2620) could be gas with the negative crossing of neutron and density logs (fig. 4). On the other hand, the high water saturation (Sw) values of reservoirs “L3”, “N3” and “P3” are evidence that they are water filled (Sw- 82%, 87%, 81% )(see table 3 and Fig. 4).
TABLE 3: SUMMARY OF RESERVOIR’S PROPERTIES OF WELL 3. Res
ervo
irs DEPTH(M)
IGR
(v/v) VS(v/v) Φ(%)
Sw(% )
Thickn
ess(M) Hs(%) Rt(Ωm)
A3
1735-1740 0.122 0.034 0.318 0.278 5 0.722 18.858
B3
1755-1762 0.147 0.050 0.287 0.318 7 0.682 17.973
C3
1905-1912 0.163 0.048 0.308 0.224 7 0.776 29.687
D3
1945-1952 0.260 0.080 0.311 0.269 7 0.731 20.119
E3
1955-1961 0.152 0.040 0.303 0.312 6 0.688 15.471
F3
1970-1975 0.216 0.077 0.306 0.422 5 0.578 10.432
G3
1985-1990 0.134 0.037 0.325 0.346 5 0.653 11.138
H3
2010-2030 0.207 0.092 0.278 0.369 20 0.631 22.709
I3
2035-2045 0.268 0.130 0.282 0.474 10 0.525 13.105
J3
2065-2072 0.151 0.042 0.309 0.337 7 0.663 12.949
K3
2150-2165 0.268 0.103 0.301 0.517 15 0.484 6.291
L3
2185-2212 0.243 0.109 0.269 0.823 27 0.177 3.325
M3
2270-2280 0.371 0.143 0.292 0.672 10 0.328 3.728
N3
2300-2307 0.365 0.152 0.283 0.857 7 0.143 2.488
O3
2323-2332 0.412 0.190 0.293 0.623 9 0.377 4.288
P3
International Journal of Research in Engineering and Applied Sciences(IJREAS) Vol. 7 Issue 5, May-2017
ISSN (O): 2249-3905, ISSN(P): 2349-6525 | Impact Factor: 7.196
Q3
2600-2620 0.179 0.053 0.311 0.303 20 0.697 91.930
R3
2812-2825 0.210 0.210 0.284 0.311 13 0.689 151.071
S3
3030-3031 0.384 0.146 0.261 0.178 1 0.822 72.718
Fig 4: Composite log of well
CONCLUSION
The following conclusion could be made based on the results obtained from this study. The qualities of the reservoirs in the “X-field” Niger Delta are moderate to good. The average porosities of the reservoirs in the three wells are within this range, (0.15% - 0.41%). The density curve in most of the wells (1, 2, 3) especially well one reads much higher porosity than the neutron log – “crossover”. The hydrocarbon in most of the reservoirs could be gas. The volumes of shale in these wells are fair enough to allow for free flow of fluid. The Vsh values of most of the reservoirs are
Gamma ray/Caliper logs Pef, Density $
Neutron logs
SP LOG
RT $ RXO
International Journal of Research in Engineering and Applied Sciences(IJREAS) Vol. 7 Issue 5, May-2017
ISSN (O): 2249-3905, ISSN(P): 2349-6525 | Impact Factor: 7.196
within the limits that could not affect the value of water saturation and suggest that the reservoirs are clean. The reservoirs with lower water saturation are more than reservoirs with higher water saturation in the overall result.
REFERENCE
Archie, G.E. (1942). The Electrical Resistivity Log as an aid in determining some Formation characteristics. Transactions of the American Institute of Mining and Metallurgical Engineers, v. 146, pp. 54-62
Asquith, G. and Krygowski, D. (2004). Basic Well Log Analysis. American Assiociation of Petroleum Geologists, Methods in Exploration Series v. 16, 204p.
Dailly, G.C., (1976). A possible mechanism relating progradation, growth faulting, clay diapirismm, and over-thrustingin a regressive sequence of sediments. Bull canad petrol Geol 24, p 146 -151.
Doust, H., and E. M. Omatsola, (1990). Niger Delta. In Edwards, JD and Santagrossi PA, (Eds), Divergent/Passive Margin Basins.Edwards, AAPG memoir v. 48, pp. 239-248.
Doust, H., and Omotsla (1989). The Niger Delta: Hydrocarbon Potential of a Major Tertiary Delta Province Coastal Lowlands, Geology and Geotechnology. Proceedings of the KNGMG Symposium “Coastal Lowland Geology and Geotechnology”. Dordrecht,Kluwe, pp. 203-212.
Evamy, B.D., J Haremboure, P Kamerling, WA Knaap, F.A. Molloy, and P.H. Rowlands, (1978). Hydrocarbon Habitat of the Tertiary Niger Delta. AAPG Bulletin, v. 62, pp.1-39.
Hilchie, D.W., (1978). Applied Openhole Log Interpretation. Golden, Colorado, DW, Hilchie, Inc, 161p.
Knaap, W.A, (1971). A montane pollen species from the Upper Tertiary of the Niger Delta. J mining and Geol, v 6, p 23-29.
Larionov, V.V. (1969).Borehole Radiometry: Moscow, U.S.S.R., Nedra
Merki, P., 1972. Structural Geology of the Cenozoic Niger Delta. In Africa Geology (T. F. J. Dessauvagie and A. J. Whiteman Eds). 1972. Ibadan University press, pp.635-646.
Nwajide, C.S. 2013. Geology of Nigeria sedimentary basins.CSS press 565pp.
Nwozor K.R., Omudu, M.I., Ozumba, B.M., Egbuachor, C.J., Onwuemesi, A.G., Anike, O.L. Quantitative evidence of secondary mechanisms of overpressure generation: Insights from parts of Onshore Niger Delta, Nigeria, petr. Techn. Dev. Jour, 3(1), 64-83(2013).
International Journal of Research in Engineering and Applied Sciences(IJREAS) Vol. 7 Issue 5, May-2017
ISSN (O): 2249-3905, ISSN(P): 2349-6525 | Impact Factor: 7.196
Schlumberger, (1975), A Guide to Wellsite Interpretation for the Gulf Coast; Schlumberger Offshore Services, 58P.
Short, K.C., and Stauble, A.I., (1967). Outline of Geology of Niger Delta: AAPG Bulletin, V.51, pp. 761-779.
Weber, K.J., (1971). Sedimentological Aspects of Oil Fields in the Niger Detla, Geologic en Mijinbouw, V. 50, pp. 559-576.
Weber, K.J., and Daukoru, E. Petroleum Geology of the Niger Delta: 9th World Petroleum Congress Proceedings 2, pp. 209-221 (1975).
Whiteman, A.J. (1982). Nigeria: its Petroleum Geology, Resources and Potential. Graham and Trotman, London, 39p.
Wright, J.B., Hastings, D.A. Jones, W.B. and Williams, HR, (1985). Geology and mineral Resources of West Africa. George Allen and Unwin, London, 187p.
.
.