Experimental Methodology for the
Evaluation of the 3D Visualization
of Quantitative Information: a Case
Study Concerning SEEG Information
Beatriz Sousa Santos
1 2, Jean-Louis Dillenseger
3and Carlos Ferreira
4 51Dept. Electr´onica e Telecomunica¸c˜oes, Univ. Aveiro, Portugal 2Instituto de Engenharia Electr´onica e Telem´atica de Aveiro, Portugal 3Laboratoire du Traitement du Signal et de l’Image, Univ. de Rennes I, France 4Sec¸c ˜ao Aut´onoma de Gest˜ao e Engenharia Industrial, Univ. Aveiro, Portugal 5Centro de Investiga¸c ˜ao Operacional, Univ. de Lisboa, Portugal
The visual analysis of Stereoeletroencephalographic (SEEG)signals in their anatomical context is aimed at understanding the spatio-temporal dynamics of epileptic processes. The magnitude of these signals may be encoded by graphical glyphs, having a direct impact on the perception of the values. This problem has motivated an evaluation of the quantitative visualization of these signals, specifically with regard to the influence of the coding scheme of the glyphs on the understanding and analysis of the signals.
This work describes an experiment conducted with hu-man observers in order to evaluate three different coding schemes used to visualize the magnitude of SEEG signals in their 3D anatomical context. Before the experiment we had no clue to which of these schemes would provide better performance to the human observers, while the literature offered theories supporting different answers. Through our experiment we intended to find out if any of these coding schemes allows better performance in two aspects: accuracy and speed.
A protocol has been developed to measure these aspects. The results presented in this work were obtained from 40 human observers. Comparison between the three coding schemes was first performed through an Ex-ploratory Data Analysis(EDA). Statistical significance of this comparison was then established using nonpara-metric methods. Influence of some other factors on the observers’ performance was also investigated.
Keywords: evaluation, visualization, empirical evalua-tion, epilepsy.
I. Introduction
Epilepsy is the result of abnormal brain elec-tric activities that mainly appear as synchronous
(paroxystic) discharges within large
popula-tions of neurons belonging to brain structures implied during seizures. Investigation methods used in epileptology are aimed at defining and understanding the organization of the epilepto-genic zone(from the areas originating the
dis-charges to those secondarily affected by their propagation). Among these methods,
Stere-oeletroencephalography (SEEG) (Bancaud et
al., 1970)provides signals, recorded with
intra-cerebral electrodes, which bring major infor-mation on the dynamics of processes inside the brain structures. The visual analysis of SEEG signals is aimed at understanding the spatio-temporal dynamics of epileptic processes. One solution for this spatio-temporal analysis can be provided by the fusion of the signals and the anatomy on the same referential(Rocha et
al., 1996) (Figure 1). In this representation
SEEG signals are displayed on the 3D loca-tion of their measurement points (e.g. on the
plots along depth electrodes), where external
of 3D-computer graphics. This encoding will have a direct impact on the perception of the value.
Fig. 1. SEEG in anatomical context.
According to Tufte(Tufte,1987), there are
con-siderable ambiguities in how people perceive a 2D surface (and, perhaps, even more in 3D)
and convert it to a one-dimensional number; changes in the physical area do not reliably produce proportional changes in the perceived area, thus using two dimensions to show one-dimensional data is a weak technique. However, according to Bertin (Bertin,1998), the
varia-tion of surface is the stimulus to the percep-tion of size. Due to these different theories, and also because the way human observers per-ceive quantitative information from a visual-ization can be very important in the scenarios where they have to make decisions based on the visual analysis of very large data sets, as in the diagnosis of epilepsy, we thought that this problem deserved further investigation through a controlled experiment.
The goal of our work is evaluation of this en-coding technique(3D glyphs)with regard to the
objectives of a medical task. Evaluation of pro-cedures in scientific visualization is generally considered a difficult task because of the large amount of aspects that interfere on the final in-terpretation(Nielson,1996). So, for the sake of
simplification, we have constrained our study to the evaluation of the technique for the quanti-tative visualization of the signals and more es-pecially to the influence the coding scale of the glyphs have on the quantitative understanding and analysis of the signals.
In this paper, we will first introduce the objec-tives and the specification of the planned eval-uation. An experimental protocol for the evalu-ation of the performance in accuracy and speed
of three different coding schemes, for represent-ing the magnitude of the signals, will then be described. As the first statistical results showed that the assumption of normality of the data had to be rejected, some rank-based nonparamet-ric statistical procedures (applied on the data
extracted from this experiment) will finally be
presented and discussed.
II. Objectives and context of the experiment
Objectives of the experiment presented in this work are related to the evaluation of the perfor-mance of human observers in extracting quan-titative information from the visual representa-tion of the signal coded through a glyph without the presence of the scale.
The choice of glyph and visual variables(size,
color, texture, form, etc.) coding quantitatively
the SEEG value was the critical point of the experiment. Bertin (1998) suggests that only
variation of size may be used to encode quanti-tative data, therefore in our application the cho-sen glyph was a sphere(its pattern is invariant
with the viewing point) having a size
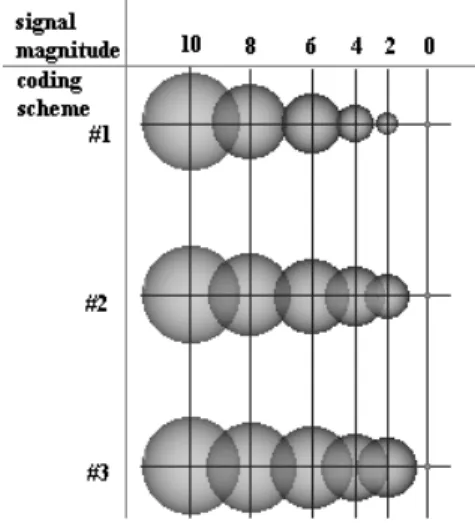
propor-tional to the magnitude of the signals to encode. The coding scheme of the glyphs must state the same organization level as the values. The 3D characteristics of the sphere allow three types of proportionality between the magnitude of the signal and the size of the sphere(figure 2):
# 1 — magnitude/Radius of the sphere(R);
# 2 — magnitude / Projected surface of the
sphere(πR
2
);
# 3 — magnitude/Volume of the sphere ((4/3)πR
3
);
where R is the radius of the sphere.
Through this experiment we intend to study specifically if any of these coding schemes(#1,
#2, #3)allows better performance for the human
observers using them, in the conditions referred to. We assumed that a coding scheme can be compared to the others in two aspects: accuracy and speed. A coding scheme will be considered better than the others if it allows a more accu-rate and/or faster “measure” of the magnitude
of the signal in a statistically significant way. In order to restrain the effect of external factors, our evaluation must be very strongly delimited in time, space, visual variables and amount of information(Bertin,1998; Tufte,1987):
Time — time variation of the signals is of great
importance for the analysis; however, this varia-tion would hold most of the observer’s attenvaria-tion
(human brain is highly specialized in motion
understanding). Moreover, the time variable in
animations is not perceived as linear. To avoid these facts, our evaluation is performed on static frames;
Space — SEEG signals are displayed on the
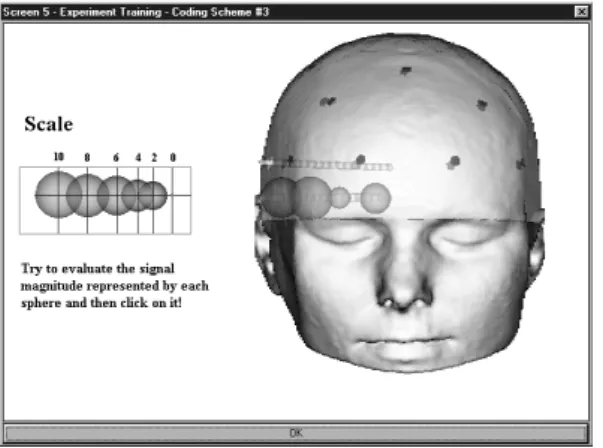
3D location of their measurement points; the external anatomy and the depiction of the depth electrodes yield the anatomical location of these points. But, as shown in Figure 1, the orienta-tion of electrodes can induce some perspective
Fig. 3.Interactive training for one of the coding schemes.
Fig. 4.What is the magnitude represented by this sphere?
or superposition artifacts; therefore, in our eval-uation we used parallel projection and a viewing direction perpendicular to the electrodes(
Fig-ures 3 and 4);
Visual variables — only the size of the spheres
encoded the values. Other visual variables
(color, texture, shape, etc.) remained neutral
and constant throughout the experiment;
Amount of information — this factor
inter-feres with two aspects: the number of signals displayed simultaneously and the quantification of these signals. To limit the first factor, only a few spheres (4 at most)are displayed on each
evaluation step so overlapping of spheres is lim-ited. Choice of the quantification of the scale is more crucial. The scale must present a per-ception step between the values but must still hold a quantitative nature. We chose to quan-tify the scale of the values to integers in the interval0,10]. The range of the coding scheme
is kept similar for all coding schemes: from 0 to a maximum radius encoding value 10 (see
figure 2).
III. The experiment
When we plan an experiment (Cochran,1983;
Preece et al.,1994; Dix et al.,1998), it is
A. Variables
In order to evaluate the accuracy and speed of the coding schemes, we have chosen concerning the:
—independent variable: the coding scheme
(#1, #2 and #3)is the main independent
vari-able;
—dependent variables: the accuracy is mea-sured by the perceived magnitude error and the speed is measured by the decision time
(approximated by the reaction time).
It would be desirable that all measured changes in the dependent variables were due to an ex-perimental effect(i.e., due to a change in the
in-dependent variable). However, other variables
can also be of some influence. We were able to identify a few such variables(gender, age,
pro-fession, nationality, etc. defining an observer profile)and have used them to characterize each
subject.
B. Subjects
One of the main goals of our experiment was to establish which coding scheme should be used to present information from SEEG signal to neurophysiologists who are supposed to use it; however the experimentation presented here was mainly performed in order to establish the first basic experimental protocol and statistical methods. On the other hand we also intended to study a more general issue of conveying quan-titative information through that kind of visual coding. We chose the subjects having educa-tion and scientific levels similar to neurophys-iologists. Thus, most of the subjects that par-ticipated in the experiment were PhDs or post-graduate students of science or engineering.
C. Experimental methodology
A repeated measures design was used(Preece et
al.,1994); all subjects appear in all
experimen-tal conditions. There are no problems of subject allocation, however we must be careful with the order in which the subjects perform in these conditions(Keselman and Keselman,1993). In
our case, there are three experimental conditions with reference to the tasks performed using the
three coding schemes(we have called a task, the
evaluation of the sequence of glyphs encoded by the same coding scheme). As an experimental
methodology, a within-group methodology was chosen(Dix et al.,1998; Shneidermen,1998); an
independent variable coding scheme was placed within groups and all the observers performed the same task under all conditions. In order to compensate for the possible influence of certain side variables(such as learning effects and
in-terference due to the use of different schemes, nervous behavior in the first task or fatigue in the last one), six possible sequences of tasks
were used. Assignment of sequences to ob-servers was performed randomly. For each cod-ing scheme three different images were used
(i.e. nine images were used for the complete
experiment).
In order to minimize the influence of some ex-ternal conditions we chose to keep them from changing. Thus:
all the test images were generated in the same
way, varying only the coding scheme;
the point of view was chosen so that the
spheres were at equal distances from the ob-server;
during the experiment, the viewing
condi-tions were as similar as possible for all the observers (screen, viewing distance,
ambi-ent light, etc.).
D. Protocol
AS/Wpackage, for Windows platforms, was
de-veloped to allow an easy application of the pro-tocol defined for the experiment. All observers received a simple explanation about the context and aims of the experiment and about what was expected from them. After they were fully in-formed and after they agreed to proceede, they were asked for the information needed to define their profiles and then the protocol started. The protocol is divided in three similar parts
(one for each coding scheme)where observers
practise in using a certain coding scheme be-fore observing all the images corresponding to the same coding scheme. This training is in-teractive, involves two screens (similar to the
one shown in Figure 3)and ends only when the
After the training for each coding scheme, the observers are shown three different images con-taining a certain number of spheres and are asked to evaluate the magnitude of one of the spheres (as shown in Figure 4). The accuracy
of the answer and its speed are registered in a file.
Before applying the experiment to the complete subject population, a pilot study was performed on 8 observers of a profile similar to that of the observer population (Cochran,1983; Preece et
al.,1994). That study allowed testing the
proto-col and resulted in some adjustments.
E. Collected data
The following variables were used to establish the profile of each observer: age(<25;25,55];
>55), nationality, gender, familiarity with 3D
video games or 3D synthetic images; profes-sion; number of years of specialty and famil-iarity with 3D medical imaging (for medical
doctors).
For each magnitude assessment by an observer, the following variables were measured:
i)Main output(dependent)variables:
the accuracy was estimated by the error in
perception of the value, E=real magnitude
- perceived magnitude. Note that E2Z;
the speed was estimated by the perception
time, T=time the observer takes to evaluate
the magnitude(approximated by the reaction
time). T is expressed in seconds.
In the rest of the paper we will call En and Tn
the variables of respectively the errors and the perception time for coding scheme #n.
ii) Side variables concerning the images:
Se-quence of coding schemes; order of the tasks
(first, second or third); number of spheres;
spheres are occluding or not; size of the evalu-ated spheres.
Variables concerning the spheres were collected in order to evaluate possible influence of the number and type of displayed spheres on the perception of magnitude. The order of the tasks is expected to give some information on the effects of boredom, fatigue or learning. Famil-iarity with 3D images is collected in order to
establish a possible non-formal training in 3D perception.
During the experiment behavior of the observers was watched closely and after the experiment, each observer was asked if he or she had any preferences about the coding schemes and, if so, why.
IV. Results
The results presented in this work were obtained applying this first experimental set to 40 human observers. The observers exhibited a relative homogeneous profile (faculty staff and
post-graduate students; 25% females). The aim of
this first step was mainly to verify the protocol and the statistical analysis. Nevertheless, we expected it would produce some results about the performance of observers using the three coding schemes, since the data obtained from such a large number of observers could be con-sidered statistically significant.
Statistical analysis was performed on the record-ed data in order to evaluate the part playrecord-ed by the coding scheme in the observers’ performance. But, after the protocol was applied to the ob-servers, some of them said that their practice, size and location of the spheres displayed on each image, as well as their personal prefer-ences to a specific coding scheme, could have influenced their performance. Thus, we car-ried out further statistical analysis of the data corresponding to other collected variables. First we tested the assumption of normality of the distribution of collected data. The per-formed goodness-of-fit test rejected this assump-tion, so we used rank-based nonparametric hy-pothesis and procedures for the data analysis. All these statistical analysis were performed using the commercial s/w package MINITAB (Minitab, 1998).
A. Evaluation of the coding schemes
Framework of the statistical analysis of the ob-tained data corresponding to the main output variables (error and time values) was the
the first analysis was an Exploratory Data
Analysis (EDA) (Hoaglin et al.,1983)
per-formed in order to get an overview of certain data characteristics (such as ranges,
asym-metries, existence of outliers, etc.). It
al-lowed a preliminary comparison among the three coding schemes and helped in the cho-ice of other statistical techniques to be used to further analyze the obtained data. It also allowed us to get an idea of the influence of other factors on the observers’ performance;
the equality or differences between the
sche-mes was then statistically tested. Since the equality hypotheses had been rejected, we investigated the data to determine the cause.
A.1. Overview of the data corresponding to the output variables
To analyze the overall behavior of the errors and times per coding scheme, a well-known EDA
technique, the box plot (Hoaglin et al.,1983),
was used. These plots display the maximum and minimum values as well as a central box indicating the location of the 50% central val-ues (between the lower and upper quartile, in
our case the 30thand the 90thelements from the
sequence of 120 samples in ascending order).
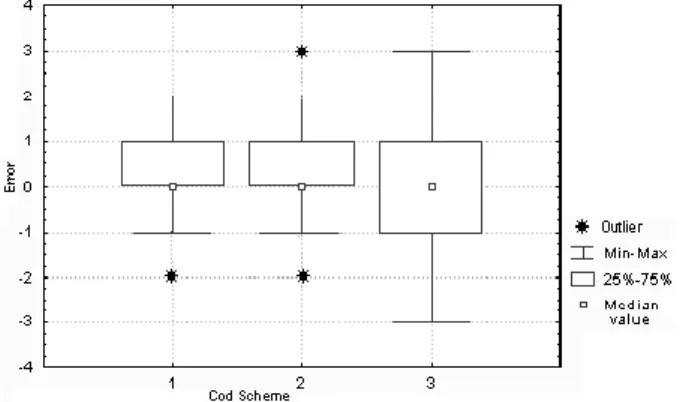
The box plots obtained for the variables E1, E2, E3, T1, T2, T3are shown in figures 5, 6.
The errors corresponding to coding schemes #1 and #2 seem very similar. They have the same minimum, median and 50% of central values
(between 0 and 1), the only difference being
the existence of a maximum value(3)for
cod-ing scheme #2 (considered as an outlier). On
Fig. 5.Box plot for the errors.
Fig. 6.Box plot for the times(T1, T2, T3)corresponding to coding schemes #1, #2 and #3.
the other hand, coding scheme #3, presents a larger range; it must be noted that the minimum values for coding schemes #1 and #2 are con-sidered outliers(just one and two (-2) values,
respectively)and this is not the case for coding
scheme #3(with seven(-2)values). Moreover,
the 50% central values of coding scheme #3 are spread between –1 and 1. Note that the median and the lower quartile values are coincident both for E1and E2(the 30th and the 60th values are
zero), which is not the case for E3. Analyzing
the raw data, it can be verified that 66, 62 and 42 from 120 values for E1, E2and E3, respectively, are equal to zero. Finally the box plot indicates a large asymmetry concerning the distribution of E1and E2(a first sign for non normality).
The minimum, maximum and median values of the perception times obtained for coding scheme #1 are smaller than for any of the other cod-ing schemes; this is also the case with 50% of central values. However the great difference ob-served in the ranges of the three coding schemes may not be so significant since the(worst)
max-imum values of coding schemes #2 and #3 are considered outliers.
A.2. Comparison among schemes
Concerning accuracy
The comparison can be stated as follows: if the proportions of failures (among the
cate-gories) and successes in the perceived
hypothesis: H0e: pe#1=pe#2=pe#3versus H1e:
pe#16=pe#26=pe#3(where pe#nis the proportion
of several categories of failures and successes for coding scheme #n)and tested using theχ
2 test for homogeneity on contingency tables, due the amount of ties between error values(see
ta-ble II)(Everitt, 1992).
Table I shows the contingency table of the fail-ures and successes of the perceived magnitude when using any scheme. Since the statistic X2=11,06 > χ
2
(2);0:05
=5,99, H0e was rejected
with a level of significanceα=5%.
c.s. #1 c.s. #2 c.s. #3 Total
Failure 54 58 78 190
Success 66 62 42 170
Total 120 120 120 360
Table I.Contingency table used to test the differences among coding schemes(#1, #2, #3)concerning the
Error(E1, E2, E3).
If we look more precisely at the distributions by investigating the equality proportions of fail-ures among the categories, i.e. –3, -2, -1, 1,
2 and 3 and successes of the perceived magni-tude when using any scheme (see the
contin-gency table on Table II), H0e is still rejected
with anα of 5%, since the statistic X2
=28,44>
χ2
(12);0:05
=21,06.
The analysis of Table I shows that c.s.#3 has more failures than c.s.#2 and c.s.#1, and Table II shows that this is particularly relevant con-cerning errors of type(-2)and(-1).
Concerning speed
The comparison can be stated as follows: if the median(me)of perception times is equal when
using any scheme, then it is possible to consider that scheme #1 is as good as scheme #2 and as scheme #3 in speed. This can also be stated as the null hypothesis: H0t: met#1=met#2=met#3 versusH1t: met#1 6=met#2 6=met#3, and tested
using the Kruskal-Wallis test (a
nonparamet-ric analog for the one-way ANOVA)(Gibbons,
1997). It requires only that the underlying
dis-tribution of each of the populations be identical in shape and is primarily designed to detect dif-ferences in “location” among the populations. In our case(Table III), H0twas rejected with an
α of 5% since the test statistic H=13,32>χ
2
(2);0:05 =5,99.
-3 -2 -1 0 1 2 3 Total
c.s. #1 0 1 7 66 35 11 0 120
c.s. #2 0 2 13 62 24 16 3 120
c.s. #3 1 7 22 42 32 13 3 120
Total 1 10 42 170 91 40 6 360
Table II.Contingency table used to test the differences among coding schemes(#1, #2, #3) concerning the Error(E1, E2, E3).
N obs Sum of ranks Mean rank Mean rank difference between
c.s.#1 and c.s.#2 c.s.#1 and c.s.#3 c.s.#2 and c.s.#3
c.s. #1 120 19117,0 159,3
15,7 47,9 32,3
c.s. #2 120 20995,5 175,0
c.s. #3 120 24867,5 207,2
We used a pairwise comparison method based on the average ranks(Freund et al., 1993)to
de-termine where the differences are. We inferred that the locations of the distributions differ if the mean rank difference between two coding schemes exceeds the critical value S, which is S=25,9 for this data set. Analyzing Table III
we can say that there is insufficient evidence to declare different locations between coding schemes #1 and #2(15,7<25,9). Locations of
the distributions of times for coding schemes #1 and #3(47,9>25,9)and for coding schemes #2
and #3(32,3>25,9)may be declared different.
B. Observers’ preferences
Relation between the preferences expressed by the observers with regard to coding scheme and their performance with preferred coding schemes was investigated, too. Thirty-five of the forty observers expressed preference for a certain coding scheme; among these, twenty performed better when using the preferred cod-ing scheme (the other fifteen did not). In
or-der to find out whether there is any connec-tion between the performance and the prefer-ence expressed by the observer we performed a Chi-square test on a 3x2 contingency table crossing preference of the observer for cod-ing schemes #1,2,3 with best performance or not (Everitt, 1992). Since we have obtained
an observed value for the statistic of X2
=0,22
<χ2
(2);0:05
=5,99, the null hypothesis of
indepen-dence between preference and performance is not rejected for anα of 5%.
This means that the proportion of best perfor-mances, for this data set, did not differ de-pending on the preference, which illustrates the fact, known to the Human Computer Interac-tion community, that we cannot rely solely on users’ preferences if the goal is to improve the performance(Nielsen, 1993).
C. Influence of other factors
According to the comments of the observers, some parameters could have influenced their performance. More precisely, practice of the observers and the size of the spheres have been mentioned frequently.
In the following analysis, we defined the ob-servers’ performance by only the occurrence of errors(failures)or their absence(successes)
re-gardless of the coding schemes; failures, suc-cesses and times were accumulated for all the observations under the same circumstances. When a different number of observations was registered, we used relative frequencies of suc-cesses, failures and time rates(obtained by
di-viding the former values by the number of ob-servations). We also searched for statistical
sup-port to find out if the observed prosup-portions of failures and successes could be due to random causes (in which case the suspected influence
was not confirmed), or not. For this purpose,
equality of proportions tests were performed on contingency tables(Everitt,1992)to analyze the
samples drawn from different populations to see if these populations have the same proportions of elements in a certain category. More specifi-cally, to test the null hypothesis that probability of some specified event is the same for each population.
C.1. Practice of the observers
To study specifically the influence of the prac-tice they have accumulated along the experi-ment, we have computed the total number of errors made by all 40 observers, for the first,
Failures (errors) Successes (no errors) Acc. Times (s)
First task 67 53 1619
Second task 64 56 1327
Third task 59 61 1244
second and third tasks they had performed. Ta-ble IV shows the corresponding number of fail-ures and successes, as well as the accumulated times.
Analyzing Table IV, we can observe that both the number of errors and the accumulated times of all the observers decrease from the first to the second and the third tasks, i.e., the observers im-prove their performance (specially concerning
the times). This seems to imply that they
be-come more familiar with the application and/or
the type of task they have to perform.
However, the equality of proportions test asserts the independence of the observers’ performance from the order of the task. The differences among their performance obtained in the three tasks seem not to be related to some learning effect but to random causes. This means that, generally, we have to be careful with informal analysis of data.
C.2. Size of the evaluated spheres
To study the influence of the size on the ob-servers’ performance, we have divided the 11 possible values of the spheres into three classes, small, medium and large, according to the sig-nal values they encode(3, between 4 and 6,
or 7). Table V displays the number of
fail-ures and successes, their corresponding rates and number N of evaluated spheres. Overall performance of the observers in the evaluation of small and large spheres is better than in the evaluation of medium spheres. This result had already been anticipated from the observation of the observers’ behavior and remarks during the experiment and was reinforced by a test of the proportion of failures and successes per-formed on a contingency table, which rejected the equality of proportions. This confirms the
existence of a dependence of the observers’ per-formance from the size of the spheres.
V. Discussion
After applying the experiment to the 40 ob-servers, critical reviews of the procedure and of the results were made. Review of the exper-imental procedure was based on the statistical results obtained and on the experience the ex-perimenter herself had accumulated observing the subjects during the experiment as well as in-terviewing them after they have completed the tasks. This review considered the following is-sues:
observer preparation — instructions given to
the observers, as well as the amount of task practice seemed adequate;
task duration — duration of the tasks
ap-peared too small when compared to the prepa-ration time; thus it seemed possible to signif-icantly increase the length of the tasks, with-out the risk of producing fatigue or boredom in the observers;
impact of independent variables — some of
the users said that the sequence in which the coding schemes were used could make a difference, possibly introducing learning or confusion effects. This was not confirmed by statistical analysis.
viewpoint — some observers suggested that
the chosen point of view(parallel projection
and a viewing direction perpendicular to the electrodes)brought back the experiment to a
2D case, which could have influenced the re-sults. A new experiment with a more general point of view could solve this doubt.
To establish what exactly had been found out by the experiment, a critical review of the results
Size of the sphere Failures Successes Num. Obs (N) Failures/N Successes/N
Small 49 79 128 0,38 0,62
Medium 81 38 119 0,68 0,32
Large 60 53 113 0,53 0,47
was performed and the following points were considered relevant:
size effect — the difference between
cod-ing scheme #3 and the others seems rather significant from a practical perspective too. The observers not only make more errors with coding scheme #3 but can also make much bigger errors; this can be important;
observers’ preference — in several cases the
observers claimed some preferences or made remarks(e.g. poorer performances when
oc-cluded spheres, learning effects, better per-formances using coding scheme #1), which
were not validated by the tests. This rein-forces the utility of real formal evaluation of each human computer interaction instead of just recording the users’ comments;
consistency between dependent variables —
the results seem consistent in that one of the coding schemes was found to be the worst both in accuracy and speed. How-ever, some inconsistency may be related to the fact that many observers clearly preferred coding scheme #1, which was not found sig-nificantly different from coding scheme #2. This preference is contradictory to the as-sessment of Bertin (1998) who suggested
that an observer is more sensible to surfaces for the extraction of quantitative data. That preference can perhaps be associated with the specific way coding schemes are shown to the observers(as shown in Figure 2);
the fact that coding scheme #1 was not
dis-criminated from coding scheme #2, through the previous statistical analysis, could also be explained by the small sample of obser-vations (three images per coding scheme),
the observers’ profile and the number of in-dependent variables.
VI. Conclusions
This work described an experiment (the first
from a set of experiments we intend to perform)
integrating a study concerned with the evalua-tion of the influence of glyphs on the under-standing and analysis of SEEG signals visual-ized in anatomical context. The aim of this case study was to experimentally assess the effect of the coding scheme chosen to map a variable
on the observers’ capacities of perceiving fast and accurately quantitative information. This effect may be very important in the scenarios where observers have to take important deci-sions based on the visual analysis of large data sets, as is the case of neurologists using SEEG visualizations to diagnose epilepsy. For this reason, we chose to make use of a statistically supported methodology.
An evaluation methodology specific for our case was designed and an experimental pro-tocol was implemented. The obtained results seem to indicate that one of the three tested coding schemes is worse than the others, both in accuracy and speed. The study performed about the influence of other factors on the ob-servers’ performance (such as task order and
size of the spheres) indicated that the size of
the evaluated spheres has possibly an important impact; moreover, it is a good illustration of the need of formal data analysis since the infor-mal analysis of the influence of learning effects suggested a different conclusion from the one obtained using statistical tests. The study per-formed on the influence of observer’s personal preferences on their performance confirmed the generally known fact that if we want to improve the users’ performance using a user interface
(from which visualization is a particular case)
we cannot solely rely on users’ preferences but have to apply other methods, namely controlled experiments and formal statistical data analysis. The experiment described allowed us to estab-lish a basic protocol and provided several impor-tant hints on how to perform further experiments and analyse the obtained results. As a con-sequence, another experiment, using basically the same protocol is currently being performed. The new protocol differs from the previous one, mainly in the number of images shown per cod-ing scheme. This second experiment will in-volve a greater number of observers with differ-ent user profiles(including neurophysiologists
and observers with formal 3D training)and the
References
1] BERTINJ.,S´emiologie graphique, les diagrammes,
les reseaux, les cartes.3me ed., ´Editions de l’ ´Ecole des Hautes ´Etudes en Sciences Sociales, Paris, 1998 (can be found in english: Semiology of graphics. The University of Madison Press, Madison, 1983). 2] BANCAUD J., R. ANGELERGUES, C. BERNOUILLI,
A. BONIS, M. BORDAS-FERRER, M. BRESSON, P. BUSER, L. COVELLO, P. MOREL, G. SZIKLA, A. TAKEDA, J. TALAIRACH, Functional stereotaxic ex-ploration(SEEG)of epilepsy.Electroencephalogr.
Clin. Neurophysiol. 28(1)(1970), 85–86.
3] COCHRANW. G., Planning and analysis of
obser-vational studies. John Wiley, 1983.
4] DIXA., J. FINLEY, G. ABOWD, B. RUSSELL,Human
Computer Interaction. 2ndEd., Prentice Hall, 1998.
5] EVERITTB. S.,The analysis of contingency tables. 2nded. Chapman and Hall, 1992.
6] FREUNDR., W. WILSON,Statistical methods. Aca-demic Press, 1993.
7] GIBBONS J., Nonparametric methods for
quanti-tative analysis. 3rd Ed, American Sciences Press,
1997.
8] HOAGLIND., F. MOSTELLER, J. TUKEY,
Understand-ing robust and exploratory data analysis. John Wiley and Sons, 1983.
9] KESELMANH., J. KESELMAN, Analysis of repeated measurements. Presented at Applied Analysis of Variance in Behavioral Science, (1993), Marcel Dekker, 105–146.
10] Minitab User’s Guide 2: Data analysis and Quality
Tools.MINITABInc., Statistical Software, 1998. 11] NIELSENJ.,Usability Engineering, AP Professional,
Academic Press, 1993.
12] NIELSONG. M., Theme issue introduction: Chal-lenges in visualization research.IEEE trans. On Vi-sualization and Computer Graphics, 2(2),(1996). 13] PREECEJ., Y. ROGERS, H. SHARP, D. BENYON, S. HOLLAND, T. CAREY, Human Computer
Interac-tion. Addison Wesley, 1994.
14] ROCHA C. J.-L. DILLENSEGER, J.-L. COATRIEUX, Multi-array EEG signals mapped with 3-Dimensional images for clinical epilepsy studies.
Lecture Notes in Computer Science 1131, Visualiza-tion in Biomedical Computing, H¨ohne and Kikinis Eds., Springer Verlag,(1996), 467–476.
15] SHNEIDERMEN B., Designing the user interface,
strategies for effective Human-Computer Interac-tion.3rd ed., Addison Wesley, 1998.
16] TUFTEE., Visual display of quantitative
informa-tion. Graphics Press, 1987.
17] TUFTEE.,Envisioning information. Graphics Press, 1990.
Received:October, 2000 Revised:June, 2001 Accepted:October, 2001
Contact address: Beatriz Sousa Santos IEETA, Dept. Electr´onica e Telecomunica¸c˜oes Universidade de Aveiro, campus de Santiago 3810-193 Aveiro, Portugal e-mail:[email protected] Jean-Louis Dillenseger Laboratoire de Traitement du Signal et de l’Image Bat 22, campus de Beaulieu Universite d´e Rennes 1 35042 Rennes Cedex, France e-mail:Jean-Louis.Dillenseger@u niv -ren nes1 .fr Carlos Ferreira Sec¸c˜ao Aut´onoma de Engenharia e Gest˜ao Industrial Universidade de Aveiro, campus de Santiago 3810-193 Aveiro, Portugal e-mail:[email protected]
BEATRIZSOUSASANTOSgraduated in Electrical Engineering in 1980 and got her Ph.D. in 1989, also in Electrical Engineering at the Univer-sity of Aveiro, Portugal.
Currently she is Associate Professor at the University of Aveiro and researcher at the Institute of Electronics and Telematics of Aveiro. Her research interests are related to scientific visualization, image process-ing and human-computer interaction applied to biomedicine and other areas.
JEAN-LOUISDILLENSEGERreceived the title of Electrical Engineer in 1988 at the National Engineer School from Brest, France, and his Ph.D. in Biomedical Engineering in 1992 from the University of Tours, France. He is currently Associate Professor at the Institute of Technology of Rennes. His research at the LTSI, Universit´e de Rennes 1, is involved in image processing and scientific visualization applied in biomedi-cal areas. He was coorganizer in 1998 of the 3rd IEEE International Summer School in Biomedical Imaging.
CARLOSFERREIRAgraduated in Electrical Engineering in 1982 at the
University of Aveiro, Portugal. He got an MSc in Statistics and Opera-tion Research, in Lisbon, in 1993 and a Ph.D. in Mathematics in 1998 at the University of Aveiro.