Selecting Low-level Features
for Image Quality Assessment
by Statistical Methods
Atidel Lahouhou, Emmanuel Viennet and Azeddine Beghdadi
Laboratoire de Traitement et Transport de l’Information, Institut Galil´ee – Universit´e Paris 13, FranceImage quality assessment is an important component in every image processing system where the last link of the chain is the human observer. This domain is of increasing interest, in particular in the context of image compression where coding scheme optimization is based on the distortion measure. Many objective image quality measures have been proposed in the literature and validated by comparing them to the Mean Opinion Score (MOS). We propose in this paper an empirical study of several indicators and show how one can improve the performances by combining them. We learn a regularized regression model and apply variable selection techniques to automatically find the most relevant indicators. Our technique enhances the state of the art results on two publicly available databases.
Keywords: image quality assessment, perceptual quality, JPEG, JPEG2000, structural similarity measure(SSIM), variable selection
1. Introduction
Considering the subjective appreciation of im-age quality in the imim-age storim-age or transmission devices is very important. However, our know-ledge about human perception mechanisms is still very limited. The few existing models of the Human Visual System (HVS)are estab-lished under very restrictive conditions. Since image quality is subjective in nature, its evalua-tion based on subjective experiments is a widely accepted solution. However, a lot of applica-tions would gain from automatic real time im-age quality estimation(e.g. online QoS control in data networks used for video transmission). Historically, objective image quality assessment methods were mainly based on simple mathe-matical measures such as the Euclidian distance
between the pixels of the original image taken as the reference and its distorted version. The Peak Signal to Noise Ratio(PSNR)has been one of the most widely used metrics until now due to its analytical and computational simplicity. This makes the PSNR practical for the optimization of image coding, filtering and quality enhance-ment systems. But simple quantitative mea-sures like PSNR or mean square error (MSE) do not always reflect the image distorsions as perceived by the HVS: for instance, two images with a large MSE distance can be considered nearly identical by the human observer.
In the last decade, numerous methods for image distortion evaluation inspired from the findings on Human Visual System mechanisms[2]have been proposed. For some known distortions, it is possible to develop a measure which exploits the a priori knowledge on the image degrada-tion. These approaches focus particularly on the contrast sensitivity functions, on the per-ceptual decomposition into multiple channels, on the visual masking and on the visual atten-tion. However, the resulting models are very limited in practice and function only in some simple and particular situations.
follows: in the next section we discuss the prob-lematic of image quality and introduce the con-cept of Mean Opinion Score (MOS). Then we present the image features we will use. Section 4 briefly presents the statistical model used and the variable selection technique. Finally, we discuss experimental results on several public images databases and suggest some directions for future work.
2. Image Quality
After years of research on image quality assess-ment, no definition of the concept of “quality” is universally accepted. In fact, the precise def-inition of image quality depends on the kind of images and on the application (still images or video, usage, . . .) [8]. Obviously, the quality criteria should be different for machine vision applications and for image and video destined to human observation. In this work, we focus on applications where the final destination is the human visual system.
2.1. Image Quality Assessment Models
The goal of objective image quality assessment models is to automatically estimate the percep-tual quality of images, in a way correlated with the human appreciation.
We distinguish three families of models in the literature:
• Full reference models, which use the origi-nal version of the image for the quality as-sessment of the processed version. The task reduces to a comparison of two images( fi-delity). This comparison should be fast
(easy to compute in real time)and correlated with human subjective appreciation. The vast majority of the proposed methods, in-cluding the ones proposed in this paper, fall in this category.
• Reduced reference models: in some appli-cations (e.g. video-transmission), one can transmit along with the compressed image a feature vector giving relevant information to control the quality of the result image. Methods based on these features are fast, but their relatively poor performances re-strict their use to some specific applications.
• No reference models: also called “blind models”, they attempt to evaluate the quality of an image without access to its reference. This is a complex task, which requires prior information on the distorsion, the domain and on the interpretation of the scene.
2.2. Objective Versus Subjective Quality
Subjective image quality assessment is purely experimental. It consists of inviting a group of subjects to judge the quality of a set of im-ages under well defined conditions, for instance, the protocols normalized by the International Telecommunication Union(ITU) [1].
The ITU test is divided into several sessions, each of 31 minutes and constituted of sets of at least 15 observers. Each image is shown to an observer(either the pair original/degraded, or only the degraded version) who is asked to score the image on a scale from 1 to 5(see Table 1).
1 2 3 4 5
Very Poor Good Very Excellent poor quality quality good quality
quality quality
Table 1.Mean Opinion Score classes.
It is known that subjective image quality varies from one individual to another: usually, the scores given by different individuals are not identical. The oberver’s score depends on his general experience(if he/she is expert in image processing or not), on his personal appreciation and may vary according to his mood. To allevi-ate this problem, an average score is computed over all observers. ThisMean Opinion Scoreis denoted by MOS.
Another approach attempts to overcome those drawbacks by developing objective image qual-ity assessment models that describe the influ-ence of several physical features of the im-age[11]. These models still suffer from certain inconsistencies.
3. Feature Extraction
In this section, we describe the images features used as input to the quality estimation model. These features are extracted from images pairs
(original and degraded).
Several previous studies (e.g. [11]) concluded that the most important information for image quality assessment is carried by the luminance signal. Hence, all our images have been con-verted from the RGB space to the YCbCr space
(where CbCr are the chrominance components andY is the luminance signal), and the features derived fromY only.
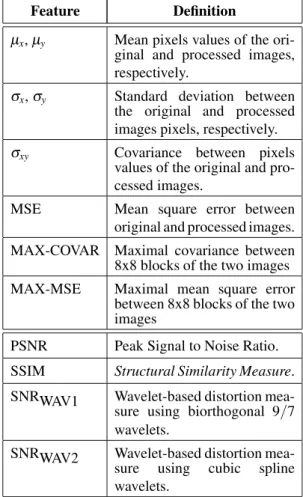
The table below lists the features chosen. They can be grouped in two categories: simple local statistical statistics(μ,σ, MSE, MAX-COVAR, MAX-MSE), and composite indices devised in the litterature to directly estimate the image quality(PSNR, SSIM, SNRWAV). Lots of other features could be added, but the main objective of this work is to test and combine well-known indices and to get a fast and simple estimator. PSNR is a classical index defined as the ratio be-tween the maximum possible power of a signal and the power of corrupting noise that affects the fidelity of its representation. It is given by:
PSNR=20 log10 max√ (I)
MSE
where max(I)is the maximal possible value the image pixels can take, and MSE is the Euclidian distance between the original and the degraded images.
SSIM is an objective image quality measure pro-posed by Wang et al.[11], which compares two images, a reference image and its distorted ver-sion, using information about luminance, con-trast and “structure”. The SSIM between two images x and y is thus based on pixels means and standard deviations:
SSIM(x,y) = (2μxμy+C1)(2σxy+C2)
(μ2
x +μy2+C1)(σx2+σy2+C2) C1 andC2 are positive constants chosen empi-rically to avoid the unstability of the measure. Note that all SSIM components(μ.,σ.)are also considered invidually in our experiments, al-lowing us to validate the combination proposed by SSIM.
Feature Definition
μx,μy Mean pixels values of the
ori-ginal and processed images, respectively.
σx,σy Standard deviation between
the original and processed images pixels, respectively.
σxy Covariance between pixels
values of the original and pro-cessed images.
MSE Mean square error between original and processed images. MAX-COVAR Maximal covariance between 8x8 blocks of the two images MAX-MSE Maximal mean square error
between 8x8 blocks of the two images
PSNR Peak Signal to Noise Ratio. SSIM Structural Similarity Measure. SNRWAV1 Wavelet-based distortion mea-sure using biorthogonal 9/7 wavelets.
SNRWAV2 Wavelet-based distortion mea-sure using cubic spline wavelets.
Table 2.Images features extracted.
SNRWAVis another image distortion measure[3], based on wavelet decomposition. The multires-olution analysis computed by the wavelet trans-form allows to take into account the effect of the distorsions at different scales. The measure is defined as SNRWAV=
20 log10
k,l,dmaxj2−jsp|cdj(kj,lj)|p
maxj2−jsp|cdj(kj,lj)−cˆdj(kj,lj)|p 1/p
4. Estimation Model and Variable Selection
A lot of statistical models can be used to build an estimator of the MOS based on the fea-tures described above. We chose to stick with a simple and efficient approach, a regularized multi-dimensional polynomial estimator(of or-der 1 or 2), implemented by KXEN K2C/K2R components1. This model relies on a Struc-tural Risk Minimization approach to optimize the parameters and hyperparameters(encoding of the variables and ridge regression) [5]. These parameters are estimated on a set of labeled im-ages (with known MOS), and then the model can be applied to new images. It is important to understand that the variables are encoded using a non-linear(stepwise)procedure before being used by the polynomial regressor.
This kind of statistical modeling can supply an accurate estimation of the target variable
(MOS) (Figure 1), and can also estimate the contribution of the various features (for a de-tailed study of features selection techniques, see [6]). Basically, the features are ranked ac-cording to their weight in the polynomial ex-pression. This allows to take into account even-tual correlations between the features and cases where individual features are not correlated to the target variable, but their (non linear) com-bination carries valuable information.
Figure 1.Modeling of the MOS.
5. Experimental Results
5.1. Image Databases
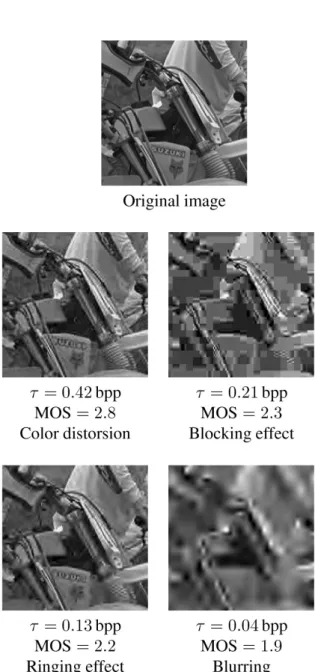
We used two distinct publicly available databases, composed of natural images, original and com-pressed, using the widely used JEPG and JPEG 2000 algorithms. Degradations caused by JPEG
coding are: blocking and ringing effects, blur and color distortion(Figure 2).
The LIVE database [10] contains 29 high res-olution color images (24 bits/pixel) of differ-ent sizes (typically 754x640). These images have been encoded at different bit rates (from 0.028 bit-per-pixel to 3.34 bpp)using JPEG and JPEG2000 algorithms, generating 460 distinct images. The induced distortion levels cover a large range of quality: from excellent qual-ity where artefacts are not visible, to very poor quality where distortions are annoying(see
Fig-Figure 2.JPEG(above)and JPEG2000(below) artefacts for different compression levelsτ, with
ure 2). For each image, the Mean Opinion Score
(MOS)has been estimated by experimentation under specified conditions recommended by the International Union of Telecommunications as detailed in[1].
The IVC database has been published by the IVC (Image Video and Communication Lab,
http://www2.irccyn.ec-nantes.fr/ivcdb/),
University of Nantes[4]. This database contains 10 original images that were subjected to JPEG, JPEG2000 and blurring image processing algo-rithms to generate 170 processed images. Sub-jective evaluations of images were carried out by 15 observers using double stimulus method mentioned above. The subjective quality scores
(MOS)were derived from the obtained quality scores which are in the range [0,1]by using a psychometric function. This methodology has been approved and recommended by the Video Quality Experts Group (VQEG) [9]. To fairly compare results on both databases, we selected only the JPEG and JPEG2000 images of the IVC database.
5.2. Experimental Setup
All presented results are obtained by a ten-fold cross-validation procedure[7]: the image set is splitted in three parts, the estimation set with 80% of images, the validation set with 10% of the images, and a test set with the remaining 10%. On each of the ten runs, the models pa-rameters are fitted on the estimation set, and generalization(hyper-parameters)is controlled by observing the error on the validation set. Fi-nally, the model is applied on the test set. The performance measure is simply the linear correlation rate between the estimated MOS and the real MOS, averaged on ten distinct test sets. We present (Tables 3 and 4)the results on the two databases (LIVE and IVC), obtained with different feature sets. The right column, L/IVC, corresponds to experiments where the models are fitted on LIVE images, but applied(tested)
on the IVC images.
5.3. Discussion
Both used databases were designed to test JPEG
/JPEG2000 image quality assessment meth-ods, but they are quite different. In fact, the
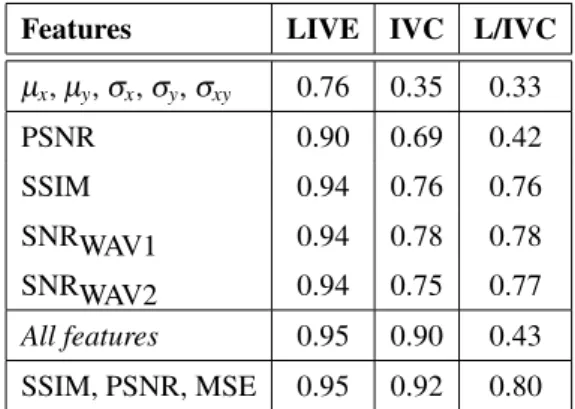
Features LIVE IVC L/IVC
μx,μy,σx,σy,σxy 0.76 0.35 0.33
PSNR 0.90 0.69 0.42
SSIM 0.94 0.76 0.76
SNRWAV1 0.94 0.78 0.78 SNRWAV2 0.94 0.75 0.77 All features 0.95 0.90 0.43 SSIM, PSNR, MSE 0.95 0.92 0.80 Table 3.MOScorrelations on three databases for different variables, linear regression models(10 fold
cross-validation, test set, average on ten runs).
Features LIVE IVC L/IVC
μx,μy,σx,σy,σxy 0.88 0.80 0.44
All features 0.95 0.88 0.72 SSIM, PSNR, MSE 0.95 0.91 0.79 Table 4.Same results with second order
regression models.
models performances are significantly lower on IVC, suggesting that the subjective evaluation is harder to reproduce on these images. The first line of the two tables gives the correlation rate of the models based only on the features
(μx,μy,σx,σy,σxy). It is surprising to note that these models perform so badly on IVC, while they give quite good results on LIVE. The SSIM index combines these same five features. We tried to combine these features with polynomi-als of order 1 or 2 (Table 4). Although the latter performs better, it is worth noting that the ad-hoc non linear combination computed by SSIM[11] gives superior results: SSIM incor-porates a priori expert knowledge which cannot be learned using only a few images.
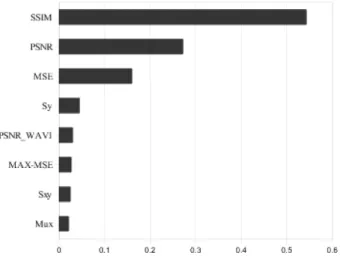
In order to build faster models, we applied a variable selection procedure to determine the most important features. The ranking of the variables is presented in Figure 3. Three fea-tures(SSIM, PSNR and MSE)contribute most. We then built models using only these three fea-tures. Reducing the number of features also en-hances the robustness of the models, as some features may only add noise. The resulting model(bottom lines)is effectively the best one. In particular, it performs very well on the L/IVC experiment, where we estimate the models on LIVE images, but apply them(and measure cor-relation)on IVC. This is the harder task, stress-ing the generalization ability of the models.
Figure 3.Variables contributions.
Finally, let’s note that, to our disappointment, the SNRWAV, while beeing more complex to compute and performing quite well individually
(it is roughly equivalent to SSIM), does not en-hance the correlation rate when combined with other features. This is a surprise, because we thought that it would carry information of dif-ferent nature. A possible explanation is that JPEG artefacts are well detected using only lo-cal features and do not require multiresolution analysis.
This work is a preliminar step in the develop-ment of new automatic image quality assess-ment methods. We are now analyzing the errors
(images where the MOS discrepancy is higher)
and trying to propose new feature extractors to handle these cases. For instance, one could use a convolutionnal neural network to process the images and extract relevant information. The methodology proposed in this paper allows to
quickly test new ideas and determine the best combination of features.
Another interesting extension of our work will be to devise an estimator based only on the trans-mitted image, without access to the reference.
References
[1] ITU-RRECOMMENDATIONBT.500-7: Methodology
for the subjective assessment of the quality of television pictures, 1995.
[2] Special issue of Signal Processing on Image quality assessment, vol. 70, 1998.
[3] A. BEGHDADI, B. PESQUET-POPESCU, A new image distortion measure based on wavelet decomposition. InProceedings of the 6th International Symposium on Signal Processing and Its Applications (ISSPA ’03), volume 1, pages 485–488, Paris, July 2003. [4] M. CARNEC, P. LECALLET, D. BARBA, Objective
quality assessment of color images based on a generic perceptual reduced reference. Image Com-munication, 23(4):239–256, 2008. ISSN 0923-5965.
[5] F. FOGELMAN-SOULIE´, E. MARCADE´,
L’industria-lisation des analyses – besoins, outils & applica-tions.MODULAD, 1(38): 140–158, July 2008. [6] I. GUYON, S. GUNN, M. NIKRAVESH, L. A. ZADEH,
Feature Extraction: Foundations and Applica-tions (Studies in Fuzziness and Soft Computing). Springer-Verlag New York, Inc., Secaucus, NJ, USA, 2006. ISBN 3540354875.
[7] T. HASTIE, R. TIBSHIRANI, J. FRIEDMAN, The
Ele-ments of Statistical Learning. Springer, 2001. [8] T. J. W. M. JANSSEN, F. J. BLOMMAERT, A
compu-tational approach to image quality.Displays, 21(4): 129–142, 2000.
[9] A. NINASSI, P. L. CALLET, F. AUTRUSSEAU, Pseudo
no reference image quality metric using perceptual data hiding. InSPIE Human Vision and Electronic Imaging, volume 6057, pages 146–157, 2006. [10] H. SHEIKH, Z. WANG, L. CORMACK, A. BOVIK,
LIVE image quality assessment database release 2. http://live.ece.utexas.edu/research/ quality.
[11] Z. WANG, A. C. BOVIK, Modern Image
Qual-ity Assessment. Morgan and Claypool Publishing Company, New York, 2006.
Contact address: Emmanuel Viennet Laboratoire de Traitement et Transport de l’Information Institut Galil´ee Universit´e Paris 13 e-mail:[email protected]
ATIDELLAHOUHOUreceived the Ing´enieur d’Etat degree in computer science from the University of Constantine(Algeria)in 2000, the Mag-ister degree from the University of Jijel (Algeria)in 2003. She is currently preparing her PhD degree jointly at Ecole Nationale Poly-technique of Algiers (Algeria)and Institut Galil´ee of the University Paris 13(Paris). Her research work concerns image quality assessment and neural approaches.
DR. EMMANUELVIENNETis Professor at the University Paris 13( In-stitut Galil´ee). He received his PhD in Computer Sciences from the University Paris XI in June 1993. His research activities are in the field of statistical pattern recognition, applying tools like artificial neural net-works and support vector machines to data mining or image processing tasks. His recent work concerns image quality assessment and social network analysis.
DR. AZEDDINEBEGHDADIis Professor at the University of Paris 13