PLANNING MALAYSIA:
Journal of the Malaysian Institute of Planners SPECIAL ISSUE IV (2016), Page 225 - 242
SPATIOTEMPORAL LAND USE AND LAND COVER CHANGE IN MAJOR RIVER BASINS IN COMPREHENSIVE DEVELOPMENT
AREA
Wan Yusryzal Wan Ibrahim1 & Ahmad Nazri Muhamad Ludin2
1,2
Faculty of Built Environment UNIVERSITI TEKNOLOGI MALAYSIA
Abstract
INTRODUCTION
In the past decades, rapid land use and land cover changed due to high demand for urban land uses such as residential, commercial, industrial, infrastructure and utilities especially in developing countries. High population growth and evident policy evolution increased demand for more spaces that resulted in rapid urbanization. In relation to this, it is estimated that global urban population will be 3.8 billion in 2015 and expected to achieve 5 billion people in 2030 (Unesco, 2010). Thus, urban development will continue modifying the landscape structure globally. More artificial land uses will replace other landscapes and consequently disturbing environmental quality. In particular, the increasing artificial surfaces from various types of development areas could be the potential source of pollution within watershed area (Tanga et al., 2005; Xiana et al., 2007; Edwin et al., 2010 and Mark et al., 2011). Many past studies show significant impact of land use and land cover (LULC) change contributing to source for pollution and removing the existing landscape and increase exposure to other problems (Carlson et al,. 2011; Youa et al., 2012; Wang et al. 2012; Chu et al., 2013 and Fu et al., 2014). This will be more critical as future development will restructure the landscape and could contribute to negative issues in the environment.
Spatiotemporal study is important to understand the possible characteristics of spatial changes in past and future landscape. The dynamic change information is essential for experts to predict the possible impact of the changes towards environment (Lathrop et al., 2007; Sun et al., 2012 and Xu et al., 2013). In undertaking the study, GIS and remote sensing are important tools in analyzing the spatiotemporal of LULC change. Remote sensing provides a series of spatial features information with spatial pattern dimension and temporal changes (Frondoni et al., 2011; Wang et al., 2012). It illustrates the composition and configuration on the earth surface which relates to the land use activities. Meanwhile GIS is capable to handle spatial data and conduct analysis for the spatiotemporal study. Spatial analysis in GIS particularly is able to visualize the spatial dimension for the future development. Then, the analysis is enhanced when landscape indices specifically describes the composition and configuration spatiotemporal of land use and land cover change (Fan and Myint, 2014).
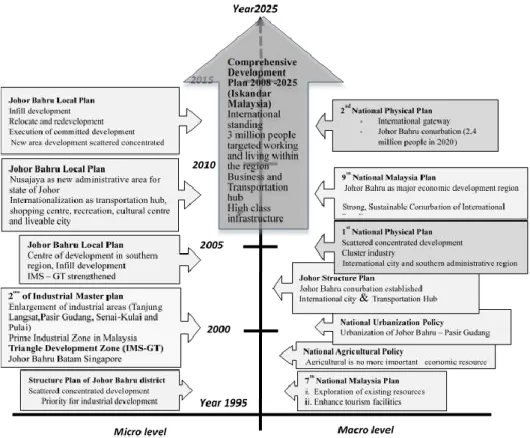
For further understanding of urbanization and spatiotemporal changes, the study was conducted in the comprehensive development region of Iskandar Malaysia (Johor Bahru). Previously, Johor Bahru especially has experienced significant change of LULC characteristics in recent years. Due to the implementation of new policy, presently there is no sign of slowing down the development. The rapid changes are related to the fast population growth in this area in line with the evolution of the policy to elevate Johor Bahru as a city of international standing (Figure 1). Thus, large areas have been converted into urban land use and the trend will continue as population and demand for spaces increase in the future.
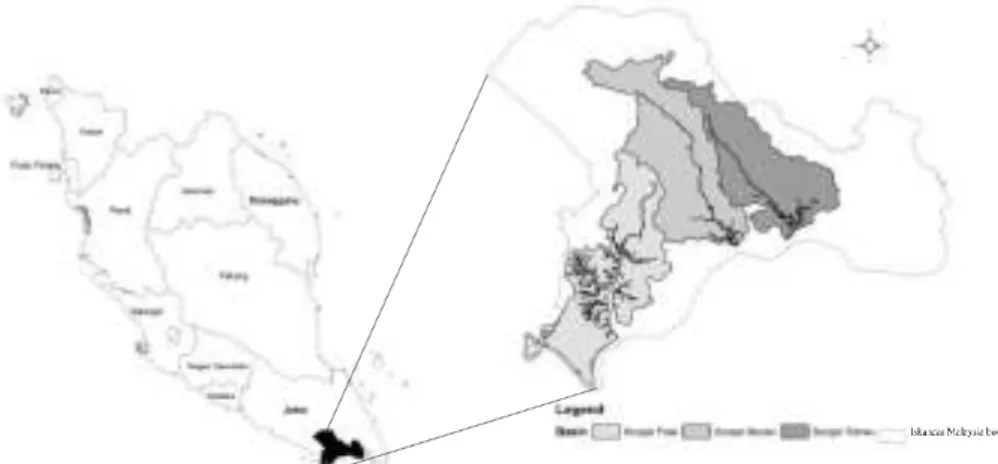
economic activities, Johor Bahru particlularly is an important region that experienced large economic concentration and various spatial changes since 1990s. Now it has become one of the prominent cities in Malaysia having high competitive development especially for commercial, industrial and residential sectors. Population has grown considerably with enormous immigration of people from surrounding areas. As a result, large land use and land cover has significantly changed due to this rapid socioeconomic development and change the overall landscape. For the purpose of the study, the focus study area is in the major river basins within the region such as Sungai Pulai, Sungai Skudai, Sungai Tebrau and the coastal area around the city center of Johor Bahru (Figure 2).
Figure 2: The river basins (study area) in Iskandar Malaysia region
OBJECTIVE AND METHODS
The objective of this paper is to discuss the spatiotemporal land use and land cover change in the three major river basins in Iskandar Malaysia region. It is important to understand the characteristics of land use and land cover of the study area related to the quality of river basin in this area. Besides that, this study references the requirement of adaptive management for observing and predicting the consequence of environmental problems. Several steps were involved in this study such as identification of the focus and study area, data collection, database development, image processing and data analysis (Figure 3).
Figure 3: The sequence and methods involved in this study
Data Collection and Database Development
2007 and 2013) and other land use information. The Spot 5 satellite images with 10x10 meter accuracy were obtained from ARSM (Agencies of Remote Sensing Malaysia). The images are registered into Rectified Skewed Orthomorphic of Malaysia (RSO) coordinate system. Then by using supervised classification method the images were classified into five categories such as natural, agriculture, water body, built up and open land. Meanwhile, the land use data was collected from several sources in different formats. Past land use data was developed by referring to the printed documents. Land use in 2000 was digitized by referring to the past Local Plan of Johor Bahru and Structure Plan of Johor Bahru. Land use data in were 2007 and 2011 collected from secondary sources and then were transformed into standard format.
Method of Analysis
There are three sections of analysis in this study which is firstly to identify the historical character of change and secondly, to project the future spatiotemporal lulc change in the study area. Then, the landscape index analyzes the composition and configuration of the spatiotemporal changes in the past and future changes. The analysis reveals different characteristics of spatial pattern in the river basins. In the first part of analysis, the spatial analysis performs the transition of change analysis and indicates the location and type of the past changes. Similarly, the same method is used in analyzing the future change besides interpreting the configuration and composition of the change. Comparison of the LULC changes and trends from 2015 to 2030 is measured to reveal the behavior of the changes and impact on the river basins. Several software were used in this study such as Erdas Imagine, Idrisi Selva, ArcGIS and Fragstats to run the analysis.
In the second part of analysis, the projection of the LULC is based on the period from 2007 to 2013. This period is chosen because of apparent transformation with the current situation as well as in line with the starting point of the comprehensive development policy. Meanwhile the transition probability for urban changes is calculated based on a series of variables within the components of existing urban areas, transportation network, geophysical condition and development policy engagement. The map was created through input from analytical hierarchical process (AHP) which shows the priority area for future development.
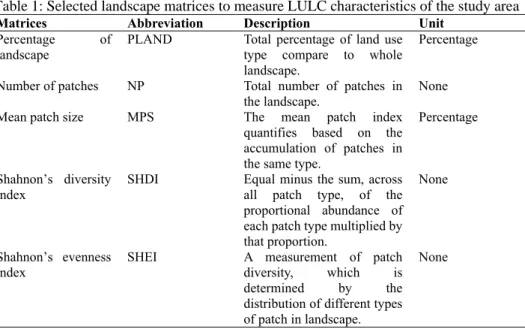
Table 1: Selected landscape matrices to measure LULC characteristics of the study area
Matrices Abbreviation Description Unit
Percentage of landscape
PLAND Total percentage of land use type compare to whole landscape.
Percentage
Number of patches NP Total number of patches in the landscape.
None
Mean patch size MPS The mean patch index quantifies based on the accumulation of patches in the same type.
Percentage
Shahnon’s diversity index
SHDI Equal minus the sum, across all patch type, of the proportional abundance of each patch type multiplied by that proportion.
None
Shahnon’s evenness
index SHEI A measurement of patch diversity, which is determined by the distribution of different types of patch in landscape.
None
Source: Adopted from McGarigal, 2002
URBANIZATION AND LANDSCAPE CHARACTER CHANGES
LULC Change
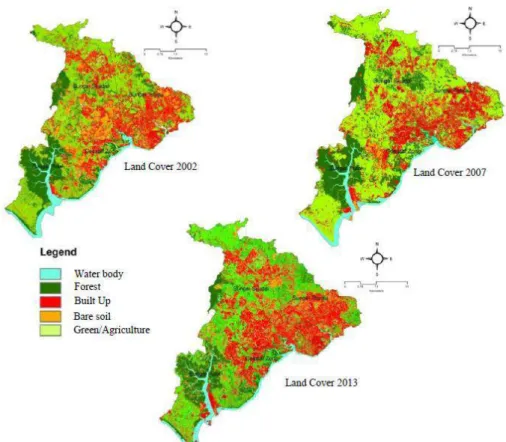
The primary findings show that there was significant change of the land use and land cover in the past in the study area. It is obvious different trends of land use changes can be seen in the different periods of the study due to evolvement of urban development. The urban area has replaced the surrounding natural and agriculture areas and directly changed the overall landscape composition of the river basin in the study area (Figure 4 and Table 2). The total urban land of 22387.65 hectares in 2002 increased to 22 441.31 hectare in 2007. In 2007 rapid urban development started due to the implementation of the comprehensive development plan in Iskandar Malaysia and shows that the urban land enlarged enormously. As a result, the total urban land increased to 64 5954.7 hectares in 2013. The changes significantly change the composition of every river basin in this region (Table 2).
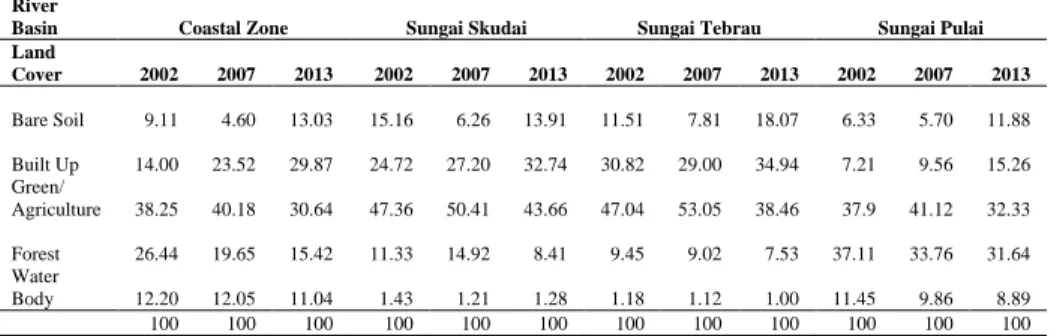
Table 2: The percentage of land cover in all the river basins in 2002, 2007 and 2013
River
Basin Coastal Zone Sungai Skudai Sungai Tebrau Sungai Pulai Land
Cover 2002 2007 2013 2002 2007 2013 2002 2007 2013 2002 2007 2013
Bare Soil 9.11 4.60 13.03 15.16 6.26 13.91 11.51 7.81 18.07 6.33 5.70 11.88
Built Up 14.00 23.52 29.87 24.72 27.20 32.74 30.82 29.00 34.94 7.21 9.56 15.26 Green/
Agriculture 38.25 40.18 30.64 47.36 50.41 43.66 47.04 53.05 38.46 37.9 41.12 32.33
Forest 26.44 19.65 15.42 11.33 14.92 8.41 9.45 9.02 7.53 37.11 33.76 31.64 Water
Body 12.20 12.05 11.04 1.43 1.21 1.28 1.18 1.12 1.00 11.45 9.86 8.89
100 100 100 100 100 100 100 100 100 100 100 100
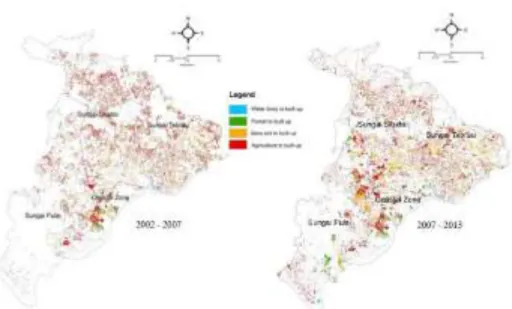
Figure 5: The figure shows the transition of land cover change towards built up areas in all the river basins
Table 3: Transition matrix of the conversion of land cover towards built up areas between 2002-2007 and 2007 – 2013
Period 2002-2007
Basin Sg.Tebrau Sg.Skudai Sg.Pulai Coastal Total
Land cover (Hec.) % (Hec.) % (Hec.) % (Hec.) % (Hec.) %
Water Body 64.78 1.59 24.35 0.61 28.31 1.65 88.57 3.97 209.8666 1.71
Forest 330.24 8.13 377.4 9.47 273.47 15.95 458.26 20.55 1472.9201 11.98
Bare Soil 777.52 19.13 756.91 19.00 208.01 12.13 351.53 15.76 2144.2356 17.44
Agriculture 2890.85 71.14 2826.28 70.94 1204.75 70.27 1331.99 59.72 8466.2212 68.87
Total 4063.39 100.00 3984.94 100.02 1714.54 100.00 2230.35 100.00 12293.244 100.00 Period
2007-2013
Basin SgTebrau SgSkudai SgPulai Coastal Total
Land
Cover (Hec.) % (Hec.) % (Hec.) % (Hec.) % (Hec.) %
Water
Body 61.65 1.57 57.46 1.19 127.22 3.54 105.88 5.39 352.21 2.46
Forest 242.79 6.18 555.18 11.53 633.13 17.62 552.36 28.13 1983.46 13.87
Bare Soil 1155.17 29.40 1259.69 26.17 846.87 23.57 316.75 16.13 3578.48 25.03
Agriculture 2468.92 62.85 2941.67 61.11 1986.25 55.27 988.45 50.34 8385.29 58.64
Meanwhile, the Sg. Skudai river basin shows the total conversion area towards urban land is 3 984.94 hectares between 2002 and 2007 (Table 3). Similarly agriculture land was the largest area converted into urban land with 2826.28 hectares. The Pulai river basin and coastal zone areas also have significant changes in their existing land cover. Critically, the conversion in the first period in both basins shows that the water body area has been converted extensively. The reclamations of land for urban development along the coastal areas show the replacement of urban land with total 88.57 hectares between 2002 and 2007. Then the enlargement of the transportation hub (Tanjung Pelepas port) shows another significant change of water body to urban land with a total conversion of 28.31 hectare in the Sg. Pulai river basin. As urban development sprawled to the outskirt of Johor Bahru city centre and the demand for urban land use increased, showing the conversion of water body in Tebrau river basin and Skudai river basin with 64.78 and 24.35 hectares respectively. The change of the water body was mostly related to the development of housing area in the river banks directly attached to the rivers. This development trend basically involved the preferences of people want attaching to the serenity of the natural ecosystem.
Figure 6: Percentage of landscape (PLAND) change in different river basin in Iskandar Malaysia.
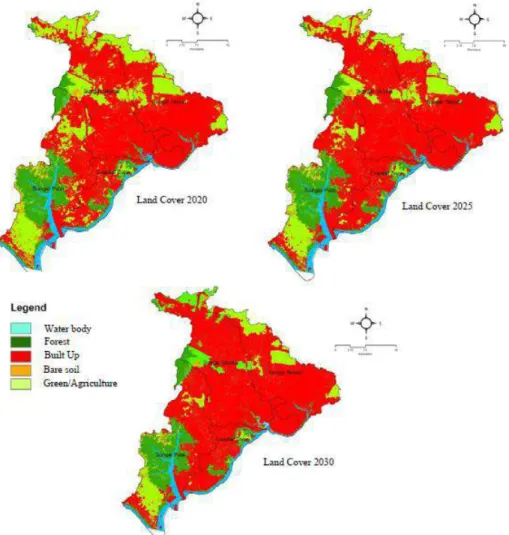
Figure 7: Spatiotemporal dimension of future land use and land cover change in the study area
Landscape configuration and composition characteristic
The spatiotemporal landscape changes significant transformation on the landscape composition and configuration in the past as well as in future development. In this study, urban landscape configuration and composition are evaluated to show the characteristics of spatial urban pattern changes in the study area with regard to development policy and environmental consequences. From past experience, the changes have restructured the landscape characteristic besides hugely removing green areas (natural and agriculture land). All development within 2002 and 2007 seems to enlarge the existing urban areas and show a small number of patches increased (Figure 8). It can be seen that the developments were allocated in the new areas as the number of patches (NP) increased in all river basin except for Sg. Skudai river basin. The percentage of urban land increased and NP reduced that shows the development has merged the urban patches through infill development. This situation is clear in Sg. Skudai river basin where past rapid development concentrated at the area surrounding Johor Bahru towards Pasir Gudang area where NP decreased from 2398 in 2002 to 1839 in 2013.
The trend was different in the following period where NP slowly decreased in 2013 in all areas except for Sg. Pulai river basin. The urban areas started to merge by removing other areas as percentage of urban area increased. However, the development in Sg. Pulai river basin with also outlying new patches indicates significant change in urban land distribution pattern between 2007 and 2013. The developments were big in this area particularly Nusajaya development and reflects to the concentration scattered development in this area. Overall, the expansion of urban landscape and pattern of development were complying with the development policy.
Figure 9: Mean patches size of urban land changes (hectare)
In relation to the spatiotemporal dimension of the study area, the increase of percentage and agglomeration of urban land point out the increase of mean patch size urban area (MPS). Overall development in the past shows the increase of urban patch size to be more significant in the future development in all river basins (Figure 9) were all urban area will merge and the NP will decrease. Nevertheless, the mean patch size of urban land in Sg. Tebrau and Sg. Skudai river basins shows substantial changes in the future. The changes will significantly change the spatial character in the entire landscape and consequently influence the environmental condition of the river basins. The increasing urban land with high concentration of development will change the microclimate and alter the hydrology system particularly water run-off in the river basins. It could contribute to heat island and flash flood when impervious surface increase besides pollution of the rivers. Those issues will be critical when urban land expand their boundary without concern to environmental impacts.
Figure 10: Diversity index (SHDI) of land cover in the river basins
Figure 11: Evenness index (SHEI) of land cover in the river basins
CONCLUSION
As a conclusion, the study has revealed the overall changes of the spatiotemporal LULC change and its character due to urbanization process. It observed significant changes of the spatial pattern over past periods and in the future. The measurement of the landscape pattern in different basins shows the implication of urbanization towards impacts on the environmental condition. The pressure on the environmental condition is very significant in all river basins and consequently could disturb the community within those areas. In a technical perspective, the integration of GIS and remote sensing in this study has contributed to the understanding of landscape pattern in those river basins. Detail characteristics of land cover give a clear indication on measuring spatial characteristic of landscape changes. Series of satellite images show the important temporal characteristics of LULC changes which can be related to policy evolution and environmental condition.
The spatiotemporal study is beneficial for decision-makers to evaluate the trade-off in their decision regarding spatial changes. This application allows decision-makers to predict future landscape configuration and composition in relation to environmental condition. Furthermore, the allocation of future land use should be evaluated thoroughly by considering all aspects and consequences. Such elements are crucial to maintain the quality of the entire landscape and conserving the environmental system in the region. This approach could improve management in land use planning and increase the capability of adaptive management.
ACKNOWLEDGMENT
The authors would like to thank Agency Of Remote Sensing, Malaysia, for providing satellite images in the study area. We also like to thank Department of Town and Country Planning Johor for providing information on development policy and geophysical data.
REFERENCES
Chu, M. L., Knouft, J.H., Ghulam, A., Guzman, J. A. and Pan, Z. (2013). Impacts of urbanization on river flow frequency: A controlled experimental modeling-based evaluation approach. Journal of Hydrology, 495, 1–12.
Du, J., Qian, L., Rui, H., Zuo, T., Zheng, D., Xu, Y. and Xu, C. (2012). Assessing the effects of urbanization on annual runoff and flood events using an integrated hydrological modeling system for Qinhuai River basin, China. Journal of Hydrology 464–465, 127–139.
Duh, J., Shandas, V., Chang, H. and George, L. A (2008). Rates of urbanisation and the resiliency of air and water quality. Science of the Total Environment, 400, 238-256.
Edwin D. Ongley, E. D., Xiaolan, Z. and Tao, Y (2010). Current status of agricultural and rural non-point source pollution assessment in China. Environmental Pollution, 158, 1159–1168.
Fan and Myint (2014). A comparison of spatial autocorrelation indices and landscape metrics in measuring urban landscape fragmentation. Landscape and Urban Planning, 12, 117–128.
ecological implications of land cover transitions from 1954 to 2001. Landscape and Urban Planning, 100(1-2), 117–128.
Fu, Y., Ruan,B., Ge, H. and Zhao, N. (2014). Agricultural non-point source pollution in the Yongding River Basin Wenxian Guo. Ecological Indicators 36, 254– 261. Jiang, J., Li, S., Hu, J., Huang, J. (2014). A modeling approach to evaluating the impacts
of policy-induced land management practices on non-point source pollution: A casestudy of the Liuxi River watershed, China. Agricultural Water Management 131, 1– 16.
Jiayu Wu, J. and Jan Thompson, J. (2013).Quantifying impervious surface changes using time series planimetric data from 1940 to 2011 in four central Iowa cities, U.S.A. Landscape and Urban Planning 120, 34– 47.
Lathrop, R. G., Tulloch, D. L. and Hatfield, C. (2007). Consequences of land use change in the New York-New Jersey Highlands, USA: Landscape indicators of forest and watershed integrity. Landscape and Urban Planning 79, 150-159.
Mark A. Carlson, M. A., Lohse, K. A., McIntosh, J. C. and McLain, J. E.T (2011). Impacts of urbanization on groundwater quality and recharge in a semi-arid alluvial basin. Journal of Hydrology 409 (2011) 196–211.
McGarigal, K., Cushman, S. A., Neel, M. C., E., 2002. Fragstats: spatial pattern analysis
program for categorical maps.
www.umass.edu/landeco/research/fragstats/fragstats/html.
Rose, S. (2007). The effects of urbanization on the hydrochemistry of base flow within the Chattahoochee River Basin (Georgia, USA). Journal of Hydrology, 341, 42– 54.
Schaffner, M., Hans-Peter Bader, H. P. and Scheidegger, R. (2009). Modeling the contribution of point sources and non-point sources to Thachin River water pollution. Science of the Total Environment, 407, 4902–4915.
Shena, Z., Houa, X., Wen Li, W. and Guzhanuer Aini, G. (2014). Relating landscape characteristics to non-point source pollution in a typical urbanized watershed in the municipality of Beijing. Landscape and Urban Planning, 123, 96– 107. Sun, X., He, J., Shi, Y., Zhu, X. and Li, Y. (2012). Spatiotemporal change in land use
patterns of coupled human-environment system with an integrated monitoring approach: A case study of Lianyungang, China. Ecological Complexity 12, 23-33. Tanga, Z., B.A. Engela, B. A., Pijanowskib, B.C., Lim, K.J. (2005). Forecasting land use change and its environmental impact at a watershed scale. Journal of Environmental Management 76, 35–45.
United Nation. Population Division of the Department of Economic and Social Affairs of the United Nations Secretariat, 2009.World Population Prospects: The 2008 Revision and World Urbanization Prospects: The 2009 Revision. Available at http://esa.un.org/unpd/wup/Maps/maps_1_2025.html.
Xu, X. and Min, X. (2013). Quantifying spatiotemporal patterns of urban expansion in China using remote sensing data. Cities, 35, 104-113.
Youa, Y.Y., Jina, W.B., Xionga, Q.X., Xueb, L., Aib, T.C. and Lia, B.L. (2012). Simulation and Validation of Non-point Source Nitrogen and Phosphorus Loads under Different Land Uses in Sihu Basin, Hubei Province, China. Procedia Environmental Sciences, 13, 1781 – 1797.
Zhang, H. and Huang, G. H. (2011). Assessment of non-point source pollution using a spatial multicriteria analysis approach. Ecological Modelling, 222, 313–321. Zhang, P., Liu, Y., Pan, Y. and Yu, Z. (2013). Land use pattern optimization based on