LOCATING THE DROPOUT CRISIS
Which High Schools Produce the Nation’s Dropouts?
Where Are They Located?
Who Attends Them?
Robert Balfanz and Nettie Legters
Johns Hopkins University
Report 70
September 2004
This report was published by the Center for Research on the Education of Students Placed At Risk (CRESPAR), a national research and development center supported by a grant (No. R117-D40005) from the Institute of Education Sciences (IES, formerly OERI), U.S. Department of Education. The content or opinions expressed herein do not necessarily reflect the views of the Department of Educa-tion or any other agency of the U.S. Government. Reports are available from: PublicaEduca-tions Depart-ment, CRESPAR/Johns Hopkins University; 3003 N. Charles Street, Suite 200; Baltimore MD 21218. An on-line version of this report is available at our website: www.csos.jhu.edu.
T
HE
C
ENTER
Every child has the capacity to succeed in school and in life. Yet far too many children fail to meet their potential. Many students, especially those from poor and minority families, are placed at risk by school practices that sort some students into high-quality programs and other students into low-quality education. CRESPAR believes that schools must replace the “sort-ing paradigm” with a “talent development” model that sets high expectations for all students, and ensures that all students receive a rich and demanding curriculum with appropriate assis-tance and support.
The mission of the Center for Research on the Education of Students Placed At Risk (CRESPAR) is to conduct the research, development, evaluation, and dissemination needed to transform schooling for students placed at risk. The work of the Center is guided by three cen-tral themes—ensuring the success of all students at key development points, building on stu-dents’ personal and cultural assets, and scaling up effective programs—and conducted through research and development programs in the areas of early and elementary studies; middle and high school studies; school, family, and community partnerships; and systemic supports for school reform, as well as a program of institutional activities.
CRESPAR is organized as a partnership of Johns Hopkins University and Howard University, and is one of twelve national research and development centers supported by a grant (R117-D40005) from the Institute of Education Sciences (IES, formerly OERI) at the U.S. Depart-ment of Education. The centers examine a wide range of specific topics in education including early childhood development and education, student learning and achievement, cultural and linguistic diversity, English language learners, reading and literacy, gifted and talented stu-dents, improving low achieving schools, innovation in school reform, and state and local edu-cation policy. The overall objective of these centers is to conduct eduedu-cation research that will inform policy makers and practitioners about educational practices and outcomes that contrib-ute to successful school performance.
E
XECUTIVE
S
UMMARY
Imagine a nation in which all students, from Benton Harbor to Watts, from Akron to Balti-more, from Chicago’s South side to rural South Carolina, routinely graduate from high school ready and prepared to succeed in college or advanced post-secondary training. Imagine the social and economic implications of being able to say to any child, in any locale in the United States, “you will be provided with a high school that will educate you, challenge you, care for you, support you, and graduate you ready to compete and succeed in the world.”
Fifty years after Brown vs. the Board of Education, the image of public high schools provid-ing all youth with equal opportunity to receive a high quality education remains inspirprovid-ing and compelling. Current reality, however, offers a much more troubled picture. In each of the lo-cations listed above, half or more of high school students do not graduate, let alone leave high school prepared to fully participate in civic life. It is no coincidence that these locales are gripped by high rates of unemployment, crime, ill health, and chronic despair. For many in these and other areas, the only real and lasting pipeline out of poverty in modern America, a solid high school education followed by post secondary schooling or training, is cracked and broken.
Consider the central findings of this study:
• Nearly half of our nation’s African American students, nearly 40% of Latino students, and only 11% of white students attend high schools in which graduation is not the norm.
• Between 1993 and 2002, the number of high schools with the lowest levels of success in promoting freshmen to senior status on time (a strong correlate of high dropout and low graduation rates) increased by 75%, compared with only an 8% increase in the total num-ber of high schools.
• There are currently between 900 and 1,000 high schools in the country in which graduat-ing is at best a 50/50 proposition. In 2,000 high schools, a typical freshman class shrinks by 40% or more by the time the students reach their senior year. This represents nearly one in five regular or vocational high schools in the U.S. that enroll 300 or more students.
• A majority minority high school is five times more likely to have weak promoting power (promote 50% or fewer freshmen to senior status on time) than a majority white school.
• Poverty appears to be the key correlate of high schools with weak promoting power. Ma-jority minority high schools with more resources (e.g., selective programs, higher per pu-pil expenditures, suburban location) successfully promote students to senior status at the same rate as majority white schools.
• The majority of high schools with weak promoting power are located in northern and western cities and throughout the southern states.
• High schools with the worst promoting power are concentrated in a sub-set of states. Nearly 80% of the nation’s high schools that produce the highest number of dropouts can
be found in just 15 states (Arizona, California, Georgia, Florida, Illinois, Louisiana, Michigan, Mississippi, New Mexico, New York, North Carolina, Ohio, Pennsylvania, South Carolina, and Texas).
• While only 20% of high schools that enroll more than 300 students are located in large and medium-sized cities, 60% of the nation’s high schools with the lowest levels of pro-moting power are found in these cities.
• Many cities have high concentrations of high schools with weak promoting power. In half of the nation’s nearly 100 largest cities, 50% or more of high school students who attend regular or vocational high schools with more than 300 students attend high schools with weak promoting power. In some cities, students have virtually no other choice but to at-tend a high school with weak promoting power.
• More than half of African American students in Illinois, Ohio, Michigan, New York, and Pennsylvania attend high schools in which the majority of students do not graduate on time, if at all. African American students in these states are up to 10 times more likely to attend a high school with very weak promoting power, high dropout and low graduation rates than white students.
• Five southern states—Georgia, South Carolina, North Carolina, Florida, and Texas— collectively lead the nation in both total number and level of concentration of high schools with weak promoting power.
These findings are a chilling reminder of how much further we need to go to truly realize the vision of Brown. They are also a call to action. We must no longer tolerate the squandered potential, limited life chances, and social malaise that result from poorly educating our na-tion’s youth. Increasing momentum for high school reform is a promising development but must not become a passing fad. With sustained commitment and judicious use of resources, transforming the American high school will be a powerful vehicle to achieving a more just and prosperous society.
A
CKNOWLEDGMENTS
The work of Carolyn Henry Barber, our chief research assistant on the project, has been in-valuable. Her mastery of the data set and speed with which she was able to process our many requests was phenomenal. We would also like to thank Chris West, Barbara Colton, and Gregg Howell for their assistance in putting this report together. We would like to thank the Harvard Civil Rights Project for helping to shepherd this research through its many phases and helping it make a difference. Finally, we would like to acknowledge the teachers and stu-dents whose daily struggle to provide and receive a good high school education inspired us to conduct this research in the first place.
I
NTRODUCTION
It is hard to find a critical social or economic issue that does not ultimately intersect with the American High School. It is central to long-term health of the U.S. economy. It is vital to Justice O’Connor’s hope that the need for affirmative action will recede within 25 years. It is paramount to meeting the 50-year-old promise of Brown vs. the Board of Education to provide equal educa-tional opportunity to all. It is the missing cornerstone of central city renewal and a potentially powerful tool in reducing crime and promoting positive youth development.1
To see this, indulge in a brief thought experiment. Imagine a nation in which all students, from Benton Harbor to Los Angeles, from Akron to San Antonio, from Chicago’s south side to rural South Carolina, routinely graduate from high school ready and prepared to succeed in college or advanced post-secondary training. Imagine the social and economic implications of being able to say to any child, in any locale in the United States, “you will be provided with a high school that will educate you, challenge you, care for you, support you, and graduate you ready to compete and succeed in the world.”
Now, flash back to cold reality. In each of the locations listed above, close to half of the high school students do not graduate, let alone leave high school prepared to fully participate in civic life. It is no coincidence that these locales are gripped by high rates of unemployment, crime, ill health, and chronic despair. For many in these and other areas, the only real and lasting pipeline out of poverty in modern America, a solid high school education followed by post secondary schooling or training, is cracked and broken.
Recognition of the importance of the American high school to the economic and social well be-ing of the nation has been buildbe-ing over the past decade. Since the mid 1990s, public and private investment in transforming high schools has grown, and a spate of reports and conferences has amplified the need for reform.2 The newfound attention to high schools is long overdue. High schools have been the orphans of school improvement efforts, as states and districts have chosen to invest the too few dollars available for low-performing schools in schools serving younger children. High schools still receive only 5% of federal funds available for low-performing schools (Alliance for Excellent Education, 2004). Policymakers and education decision makers are now realizing that support for preschoolers and elementary school students must be sustained through the secondary grades to keep achievement and attainment gains from fading as students face the academic and social challenges of their middle and high school years.
The emerging high school reform movement is at risk, however, of achieving only superficial impact if reform experiments are not successfully brought to scale. Worse, current reform in-vestments could result in wider achievement gaps if they do not tackle head-on, with systematic focus and adequate resources, the high schools that are producing the greatest number of the na-tion’s dropouts. Failing to address these schools and the students who attend (and then do not
1 The economic benefits of a solid high school education have most recently been detailed in Carnevale and Des-rochers, 2004. The social benefits can be seen in Wald and Losen, 2003.
2 Fall 2003 saw an unprecedented number of conferences and meetings of national, state, and district education poli-cymakers focused on the needs of adolescents and the unique challenges of high school reform (Harvey and Hous-man, 2004); the US Department of Education recently launched a High School Initiative designed to spread and support effective reform practices; and the National Association of Secondary Schools Principals recently released Breaking Ranks II: Strategies for Leading High School Reform (NASSP, 2004).
attend) them is tantamount to treating a chronic illness with a manicure—pleasant, but ultimately pointless.
Recent reports reveal, however, that there is much confusion among policymakers and the lay public about the scale and scope of the dropout problem. Researchers from major research insti-tutes that span the political spectrum have shown that federal dropout statistics underestimate the number of students who dropout of high school (Greene, 2002; Swanson, 2004). Others have shown that state and school level reporting of graduation rates under No Child Left Behind is subject to significant error (Education Trust, 2004; Orfield et al., 2004). One reason for this is that the most widely used method to calculate graduation rates for NCLB, the graduation rate formula developed by the National Center for Education Statistics (NCES), is ultimately depend-ent on high schools accurately self reporting how many studdepend-ents dropout (Swanson, 2003). Re-cent investigations into dropout reporting in New York City and Houston indicate how difficult this is to do.
As a result, there is no ready understanding of how many high schools have high dropout and low graduation rates, where they are concentrated, or the extent to which they dominate the edu-cational opportunities provided to different groups of students. It is not known, for example, the extent to which all states and large cities have significant numbers of high schools that produce large numbers of dropouts, or if the problem is concentrated in a sub-set of states and cities. The first step to stemming the tide of our nation’s dropouts and reclaiming their squandered po-tential is to target the high schools and school systems that are producing them. The aim of the present study is to locate the dropout crisis―to determine its scale and scope by identifying the number of high schools with severe dropout problems, detailing the states, cities, and locales where they are concentrated, and establishing who attends them.
Promoting Power as an Indicator of High Schools with High Dropout and
Low Graduation Rates
Currently there is no available direct and common measure of high school dropout or graduation rates at the school level. Available federal measures can provide estimates at the state and district level only (Kaufman, 2001). Under NCLB, states are allowed to use different graduation meas-ures, so it is not even possible to use common state level measures to identify which high schools have high dropout rates nationwide.
Fortunately, available federal data can be used to develop an indirect measure. The Common Core of Data (CCD) compiled by the federal government’s National Center for Education Statis-tics provides enrollment rates by grade for every public high school in the United States. We have used this to develop a measure we call promoting power, which compares the number of freshmen at a high school to the number of seniors four years later (or the number of tenth grad-ers to seniors three years later in schools with a 10-12 grade span). Ideally, we would compare freshmen to the number of graduates four years later but currently the CCD does not provide data on the number of graduates at individual high schools.3
Using the ratio of freshmen to seniors four years later we argue does provide a reliable indicator of the extent to which a high school is succeeding in its core mission of graduating the students who enter its doors. The underlying assumption of the promoting power measure is that high schools in which the number of seniors closely approximates the number of freshmen four years earlier will have high graduation rates and low dropout rates because most students will have remained in school, been promoted in a timely fashion, and are on course to graduate. Con-versely, a high school where there are half as many seniors as freshmen is likely to be a school where on-time graduation is not the norm. We make no claim that promoting power equals the graduation or dropout rate in the schools we identify. In the technical appendix we discuss sev-eral reasons why this will not be the case. We do believe, however, that the cumulative evidence on in-direct measures of the graduation rate that use students enrollments, most notably the work of Christopher Swanson and John Warren, supports the efficacy and accuracy of using promoting power to identify high schools with high dropout and low graduation rates. Further details about the promoting power measure and its reliability as an indicator of graduation and dropout rates are detailed in the technical appendix of this report.
In our analysis of high schools across the country, we use two cut-points to identify those that have high dropout and low graduation rates. The first cut point is high schools in which there are 50% or fewer seniors than freshmen four years earlier. We classify these high schools as those with the worst promoting power in the U.S. because in these schools students have less than a 50/50 chance of graduating on time, if at all. The second cut point we use is high schools in which there are 60% or fewer seniors than freshmen. We added this second cut point because analysis of the data revealed a large number of high schools with promoting power between 50% and 60%. We believe it is analytically useful to isolate the high schools with the worst promoting power but also identify all high schools in which graduation is likely not the norm. Identifying high schools with promoting power of 60% or less provides a good estimate of the number of high schools with severe dropout rates and thus can be used to locate the high schools which produce the majority of the nation’s dropouts.
F
INDINGS
HOW MANY HIGH SCHOOLS HAVE WEAK PROMOTING POWER?
One in five high schools in the U.S. have weak promoting power, indicating unacceptably low graduation rates and high dropout rates.
In the United States there are currently between 900 and 1,000 high schools in which graduation is at best a 50/50 proposition. In these high schools, which represent about 8% of all regular and vocational high schools with enrollments of 300 or more students, the senior class has half or less the number of students than the freshman class four years earlier. If the standard used to classify a school as having weak promoting power is relaxed slightly to include high schools with 60% or fewer seniors than freshmen, the number of chronically low-performing schools doubles to 2000. This represents nearly one in five (18%) regular and vocational schools that en-roll 300 or more students. These high schools collectively educate more than 2,600,000 students.
The number of high schools with weak promoting power grew substantially during the 1990s.
Comparing the class of 2002 to the classes of 1993, 1996, and 1999 indicates that the number of high schools with weak promoting power grew substantially during the 1990s. This can be seen in Table 1. Between 1993 and 2002 the number of high schools with the lowest rates of promot-ing power increased by 75% and overall the number of high schools with weak promotpromot-ing power increased by 60%. This stands in contrast to only an 8% increase in the total number of schools.4
Table 1:
Number of schools with weak promoting power in the United States, Class of 2002
< 50% Promoting Power
< 60% Promoting Power
Class
Total # of High Schools*
# of High Schools
% of High Schools
# of High Schools
% of High Schools
2002 11,129 930 8% 2007 18%
1999 10,915 903 8% 1968 18%
1996 10,709 783 7% 1717 16%
1993 10,296 530 5% 1254 12%
* Regular and vocational high schools with more than 300 students.
The gap between promoting power for high schools with the weakest promoting power and the national norm is a striking 40 to 60 percentage points.
Promoting power of 80% or higher is the norm for regular and vocational high schools in the U.S. This can be seen in Figure 1. Promoting power is 40 to 60 percentage points lower in the 930 high schools with the worst promoting power (50% or less).
Figure 1:
Number of High Schools by Different Levels of Promoting Power, Class of 2002
36 540 510 253 95 6 2278 1751 1077 2534 2049 0 500 1000 1500 2000 2500 3000
WHO ATTENDS HIGH SCHOOLS THAT PRODUCE THE NATION’S DROPOUTS?
High schools with weak promoting power are overwhelmingly majority minority. A major-ity minormajor-ity high school is five times more likely to have weak promoting power than a ma-jority white school.
It is rare for a high school that is predominately attended by white students to have weak promot-ing power. The nation’s dropout factories are overwhelmpromot-ingly the province of minority students. This can be seen in Figure 2. In 2002, there were 4,417 high schools with enrollments of 300 or more that were composed of 90% or more white students. Only 27, or 1%, of these schools had 50% or fewer seniors than freshmen. In contrast 29% of the nation’s majority minority high schools (712 out of 2,468) have senior classes with 50% fewer seniors than freshmen. When the comparison is made at the 60% level of promoting power the contrast is even starker. Only 3% of high schools in the United States that enroll 90% or more white students have weak promoting power compared to 49% of majority minority schools, and a stunning 66% of high schools that enroll 90% or more minority students.
Figure 2:
Percent of High Schools by Minority Concentration that Have Weak Promoting Power, Class of 2002
44% 29%
2% 1%
66% 49%
9% 3%
0% 20% 40% 60% 80% 100%
Less than 10% Minority (n=4417)
50% or Less Minority (n=8413)
More than 50% Minority (n=2468)
More than 90% Minority (n=878) < 50% promoting power < 60% promoting power
The most telling comparison is seen in Figure 3, which shows the percent of high schools at each level of promoting power that are majority minority. Figure 3 clearly reveals that the lower the level of promoting power, the greater the concentration of majority minority schools. Overall, a majority minority school is five times more likely to have weak promoting power than a majority white school.
4 Both Haney (2004) and Warren (2003) find that the graduation rate declined at the state level during the 1990s as well.
Figure 3:
Percent of High Schools by Promoting Power Level that are Majority Minority, Class of 2002
8% 5% 9%
18% 27% 47% 68% 86% 96% 89%
83% 0
500 1000 1500 2000 2500 3000
0% 10% 20% 30% 40% 50% 60% 70% 80% 90% 100%
Majority minority schools Schools that are not majority minority
Fifty years after the Brown vs. Board of Education decision, nearly half of the nation’s African American students, nearly 40% of its Latino students, and only 11% of white stu-dents attend high schools in which graduation is not the norm.
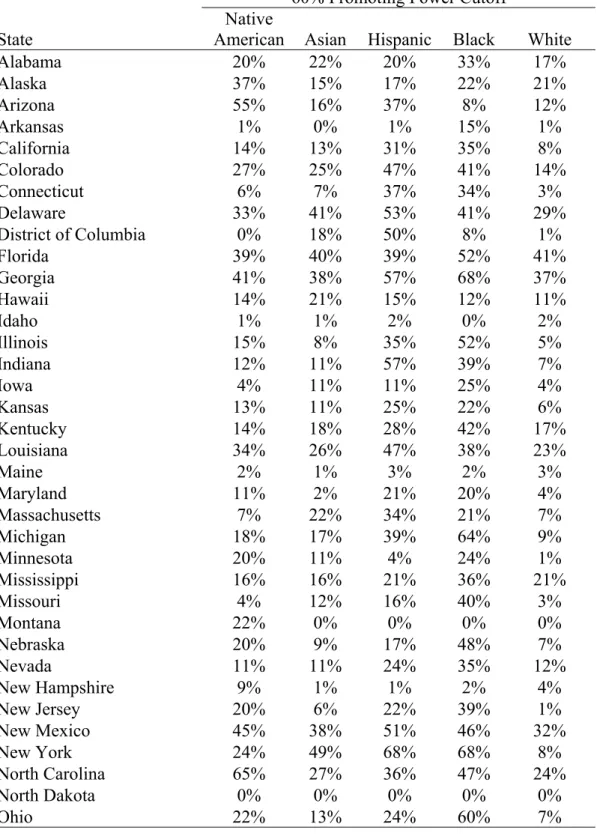
The prevalence of weak promoting power among majority minority schools when combined with the continuing segregation or resegregation of schools in many locales (Orfield & Chungmei, 2004) means that 50 years after Brown vs. the Board of Education approximately 46% of the na-tion’s African American and 39% of its Latino students attend high schools in which graduation is not the norm. This compares to only 11% of White students (Figure 4). Separate and unequal high schools are unfortunately alive and well in our nation. Table 1 in Appendix A shows the percent of students from different minority groups and White students by state that attend high schools with weak promoting power.
Figure 4:
Percentage of the nation's minority student populations in low promoting power high schools
46%
39%
11% 0%
20% 40% 60% 80% 100%
Two exceptions to the rule: Selective high schools and high schools in affluent suburbs.
Not all majority minority high schools have weak promoting power. In many of the nation’s ma-jor cities there are selective high schools that rank among the nation’s best. These high schools often educate predominately minority students and have strong promoting power. This is illus-trated in Table 2, which shows minority concentration and promoting power in selective high schools located in New York City, Newark, and Philadelphia.
Table 2:
Promoting Power in Selective Admissions High Schools in New York City, Philadelphia, and Newark, Class of 2001
District School Percent Minority
Promoting Power for Class of 2001
New York City Bronx HS of Science 63% 82%
Stuyvesant HS 57% 98%
Newark University HS 100% 101%
Arts HS 95% 75%
Technology HS 92% 74%
Science HS 81% 76%
Philadelphia Central HS 60% 85%
Girls HS 77% 87%
Creative Arts HS 52% 93%
Another exception, at least in the New York metropolitan area, are high schools located in afflu-ent suburbs. Table 3 compares promoting power in the 14 majority minority high schools found in four affluent counties near New York City to promoting power in the majority white schools in these areas. Overall in these counties majority minority schools have the same high level of promoting power as majority white schools.
Table 3:
Promoting Power by High School Minority Concentration in Bucks County PA, Somerset County NJ, Fairfield County CTa, and Westchester County NYb
High Schools, Class of 2001
Concentration of Minority Students
Number of Schools
Total # of 9th Grade Students in
1997-98c
Total # of 12th Grade Students in 2000-01
Ratio of 2000-01 12th Graders
to 1997-98 9th Graders
50% or more minorities 14 4,526 4,151 92%
Less than 50% 70 18,729 16,944 90%
Total 84 23,255 21,095 91%
a Excludes Bridgeport School District b Excludes Yonkers City School District
One striking difference between the majority minority high schools with strong promoting power in the affluent suburbs of the greater New York Metropolitan area and majority minority high schools with weak promoting power in New York City is the amount of funding available to provide quality education. Figure 5 compares per pupil spending in the 30 majority minority high schools with the lowest levels of promoting power in New York City to district per pupil spend-ing in the 14 majority minority schools located in New York metropolitan area suburbs. Average per pupil spending is $4,500 per pupil higher in suburban majority minority high schools than in New York City, and the lowest spending suburban district spends more than the average per pu-pil in the New York City High schools.
WHERE ARE HIGH SCHOOLS WITH WEAK PROMOTING POWER LOCATED?
The majority of weak promoting power high schools are located in northern and western cities and throughout the southern states.
There are two key points regarding the location of the high schools that produce the majority of the nation’s dropouts. First, the high schools with the worst promoting power are concentrated within a relatively small sub-set of cities and states. Second, when the standard for low promot-ing power is raised from the 50% to 60% fewer seniors than freshmen the location of weak pro-moting power schools becomes more diffuse. At this level a weak propro-moting power high school can be found in every state except North Dakota. However, the majority of weak promoting power schools remain located in northern and western cities and throughout the southern states.
High schools with the worst promoting power are concentrated in a sub-set of the nation’s cities.
The high schools with the worst promoting power (50% or less) are primarily found in the na-tion’s cities. This can be seen in Figure 6. Only 20% of high schools that enroll more than 300 students are located in large and medium sized cities. Yet among them are 60% of the nation’s high schools with the lowest levels of promoting power.
Figure 5:
Per-Pupil Expenditures of High Schools with High Minority Concentrations: New York City vs. Suburbs
$9,908 $8,725
$13,245 $18,527
$6,696 $11,554
$-$4,000 $8,000 $12,000 $16,000 $20,000
New York City Suburbs
Urban areas, moreover, not only contain the majority of low-performing high schools but have weaker promoting power altogether. This is seen in Figures 7a, b, and c, which show the distribution of promoting power in the nation’s urban, suburban, and rural areas. In suburban schools the modal pattern is promoting power in the 90s, in rural schools it’s in the 80s, and urban schools it’s in the 70s.
Figure 6:
Percentage of Weak-Promoting Schools by Locale, Class of 2002
19%
34%
18% 61%
20% 45%
24% 29% 19%
7%
13% 12%
0% 20% 40% 60% 80% 100%
Urban Suburban Towns Rural
% Total Regular and Vocational HS's >300 < 50% promoting power < 60% promoting power
Figure 7a:
Promoting Power in Urban High Schools by Decile (n=2,159), Class of 2002
3 32 86
186 260
367 387
296 155
49 338
0 200 400 600 800 1000
Figure 7b:
Promoting in Suburban High Schools by Decile (n=3,740), Class of 2002
2 2 4
294 484
687
894 935
263
35 140
0 200 400 600 800 1000
0% 10% 20% 30% 40% 50% 60% 70% 80% 90% 100%
Figure 7c:
Promoting Power in Rural Schools by Decile (n=3,277), Class of 2002
89
260
874
3 2
1 23
528
719 646
132 0
200 400 600 800 1000
0% 10% 20% 30% 40% 50% 60% 70% 80% 90% 100%
All cities, however, are not the same. Fifteen of the nation’s largest cities have no high schools with weak promoting power (See Appendix A, Table 2). These are primarily western cities, and in 10 of the 15 cities minority students do not make up the majority of students in the school sys-tem. Long Beach and Anaheim, California stand out as exceptions. They are the only two urban school districts in which minority students equal two thirds or more of the student population that have no weak promoting power high schools.
At the other end of the spectrum there are 10 cities that educate primarily minority students and have 10 or more high schools with very weak promoting power. They include the nation’s three largest cities (New York, Los Angeles, and Chicago) and collectively these ten cities contain nearly one third (29%) of the nation’s high schools with the lowest levels of promoting power. These cities are listed in Table 4.
Table 4:
10 Cities with the Greatest Number of Weak Promoting Power High Schools, Class of 2002
< 50% Promoting Power
< 60% Promoting Power
City
Population rank
# of High Schools
in City
% of High Schools
in City
# of High Schools
in City
% of High Schools
in City
New York 1 92 68% 110 81%
Chicago 3 31 50% 42 68%
Los Angeles 2 26 46% 39 68%
Philadelphia 4 20 61% 20 61%
Houston 8 18 72% 20 80%
Dallas 9 18 69% 21 81%
Detroit 10 18 69% 19 73%
Jacksonville (Duval) 13 12 63% 15 79%
Cleveland 36 12 86% 12 86%
Milwaukee 22 10 67% 13 87%
Total 257 311
Thirty-four cities have four or more high schools with promoting power of 50% or less. This ac-counts for 86% of the high schools in the 100 largest cities and 43% of high schools in the nation in which the senior class has half as many or fewer students than the freshman class four years earlier.
In some cities, students have virtually no other choice but to attend a high school with weak promoting power.
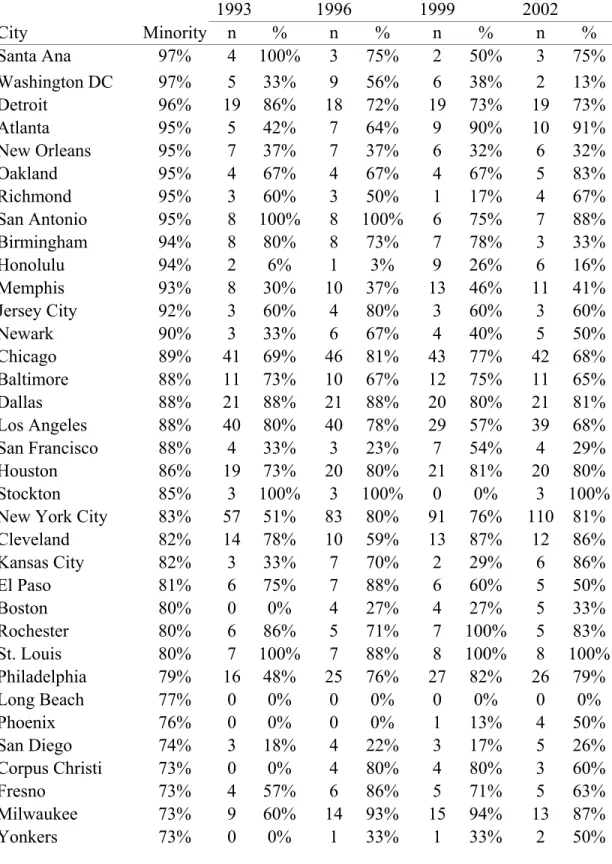
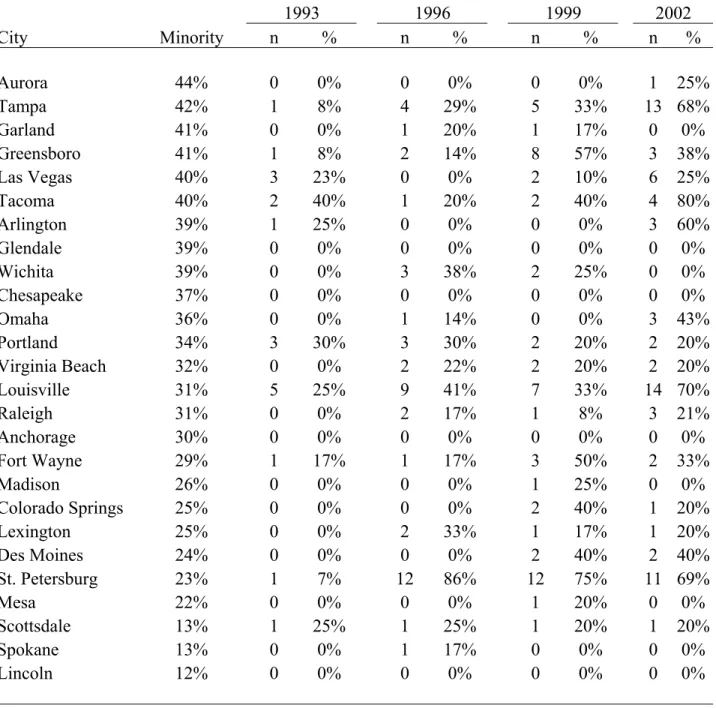
What is most significant about promoting power in many of the nation’s largest cities, however, is not the number of weak promoting power high schools but their concentration. In half of these cities, 50% or more of high school students who attend regular or vocational high schools with more than 300 students attend high schools with weak promoting power. In 21 cities, this climbs to 75% of high school students and, for the Class of 2002, it reaches an incredible 100% in St. Louis and Indianapolis. In these cities, attending high schools where graduation is not the norm, is the norm. Table 5 lists the cities with the highest concentrations of weak promoting power high schools and organizes them by region.
Table 5:
Cities in which 50% of High Schools or more have weak promoting power, Class of 2002
< 60% Promoting Power
Region City % of High Schools in City # of High Schools
North St. Louis 100% 8
Indianapolis 100% 5
Milwaukee 87% 13
Cleveland 86% 12
Kansas City 86% 6
Rochester 83% 5
New York 81% 110
Akron 75% 6
Detroit 73% 19
Toledo 71% 5
Chicago 68% 42
Cincinnati 67% 6
Baltimore 65% 11
Pittsburgh 64% 7
Philadelphia 61% 20
Jersey City 60% 3
Minneapolis 57% 4
Columbus 53% 9
Newark 50% 5
Yonkers 50% 2
South Atlanta 91% 10
Shreveport (Caddo) 80% 8
Norfolk 80% 4
Jacksonville (Duval) 79% 15
Augusta (Richmond) 70% 7
Louisville (Jefferson) 70% 14
St. Petersburg (Pinellas) 69% 11
Tampa (Hillsborough) 68% 13
Richmond 67% 4
Table 5 (continued)
< 60% Promoting Power
Region City % of High Schools in City # of High Schools
Southwest San Antonio 88% 7
Dallas 81% 21
Houston 80% 20
Austin 80% 8
Oklahoma City 78% 7
Fort Worth 75% 9
Albuquerque 64% 7
Arlington 60% 3
Corpus Christi 60% 3
Tulsa 56% 5
El Paso 50% 5
Tucson 50% 5
Phoenix 50% 4
West Stockton 100% 3
Oakland 83% 5
Tacoma 80% 4
Santa Ana 75% 3
Denver 73% 8
Los Angeles 68% 39
~
SPOTLIGHT ON NEW YORK CITY
~
EW YORK CITY DWARFSALL OTHER city school districts in size. With more than a
mil-lion students, its student population is four times greater than Philadelphia’s and more than ten times greater than most major cities. Given this, the fact that New York City has the greatest number of low-performing high schools is no surprise. With more than 100 weak promoting power high schools, however, the scale of the city’s reform challenge is daunting. What stands out in New York City is not only the sheer concentration of poorly performing high schools, but how low promoting power is in many of its schools. For the class of 2002, there were more than 30 high schools in which the senior class was less than one-third the size of the freshman class four years earlier. The challenge of the reform task in New York City can be seen in Table 6. It shows that, on average, in the high schools with the worst promoting power in New York City more than a third of entering ninth graders are over-age, and less than 20% have met eighth-grade standards in English and math. Average attendance rates are in the 70s. This great need is clearly not being met with enhanced resources. In addition to the relatively low per pupil expenditures cited earlier, on average one in five teachers in these schools is not certified and two in five teachers have less than five years experience. Moreover, the typical low-performing high school in New York City with very weak promoting power is overcapacity.
Table 6:
Characteristics of High-Minority (90% or More), Low-Promoting Power (30% or Less) New York City High Schools
Range
Average Min Max
Percent of Entering 9th Graders
Over-age for Grade 35.0% 11.0% 78.0%
Meeting Standards in English 17.9% 0.0% 41.9%
Meeting Standards in Math 8.9% 0.0% 29.1%
Attendance Rate for 2001 78.0% 67.0% 90.0%
Percent Fully Licensed/Permanently Assigned Teachers
in 2001 80.0% 49.0% 97.0%
Percent Teachers With Less Than 5 Years Teaching
Experience in 2001 39.0% 15.0% 71.0%
School Capacity 2001 107.0% 76.0% 174.0%
▄ ▄ ▄ ▄
High schools with the worst promoting power are also concentrated in a sub-set of states.
More than two thirds of the high schools with the lowest promoting power (50% or less) are lo-cated in just 11 states (Georgia, Florida, Texas, South Carolina, North Carolina, New York, Ohio, Illinois, Michigan, Pennsylvania, and California). If four more southern and southwestern states are included (Mississippi, Louisiana, New Mexico, and Arizona) nearly 80% of the na-tion’s high schools that produce the highest number of dropouts can be found.
In the Northern Industrial States (Rust Belt) weak promoting power schools are over-whelmingly attended by minority students and located in large and medium sized cities.
More than one quarter (28%, n=263) of the high schools with the worst promoting power is lo-cated in five northern industrial states (Ohio, Michigan, Illinois, Pennsylvania, and New York). These high schools are located almost entirely (89%, n=233) in the large and medium-sized cit-ies of these states, and are overwhelmingly attended by minority students. Ninety percent (n=237) of the high schools with the worst promoting power in these states are majority minor-ity.
While these states are at about the national average for the percent of all high schools with weak promoting power, they are well above the national average for percent of minority students at-tending weak promoting power schools. When the standard for weak promoting power is set at the 60% level in four of the states (Ohio, Michigan, Pennsylvania, and New York) more than 70% of all majority minority schools have weak promoting power. This can be seen in Figure 8.
Figure 8:
Percentage of majority minority and five 90% minority high schools with less than 60% promoting power in Northern
Industrial States, Class of 2002
58% 75%
78% 77%76% 90% 89% 90%
49% 70%
72% 66%
0% 20% 40% 60% 80% 100%
National average
Illinois Michigan Ohio New York Pennsylvania
Majority Minority > 90% Minority
More than half the African American students in Illinois, Ohio, Michigan, New York, and Penn-sylvania attend high schools in which the majority of students do not graduate on time, if at all. By contrast the percent of White students attending weak promoting power high schools in these states is below the national average. As a result, African American students in these states are up to 10 times more likely to attend a high school with very low graduation rates than White stu-dents. Even more striking gaps can be found by looking at the high schools with the worst pro-moting power in Illinois, Ohio, Michigan, New York and Pennsylvania. As Figure 9 shows, very few White students in these states attend these high schools but between one-third and one-half of African American students do.
Figure 9:
Percentage of African American and White Students attending a high school with very weak promoting power (50% or less) in five Northern
Industrial States, Class of 2002
26%
46% 55% 43%
4% 1% 3% 3% 4% 2%
33% 50%
0% 20% 40% 60% 80% 100%
National average Illinois M ichigan Ohio New York Pennsylvania African American White
In the South, weak promoting power high schools can be found in high numbers through-out the states.
Weak promoting power high schools are not limited to northern industrial states. In fact, in terms of both total number and level of concentration five southern states―Georgia, South Carolina, North Carolina, Florida, and Texas―lead the nation. More than one third (n=765) of high schools with weak promoting power can be found in these five states. Across these five states, as seen in Figure 10, the percent of regular and vocational high schools with weak promoting power (at the 60% level) ranges from 34% in North Carolina and Texas to a stunning 53% in Georgia and 58% in South Carolina.
Figure 10:
Percentage of regular and vocational High Schools enrolling more than 300 students with weak promoting power in five Southern States,
Class of 2002
18%
58%
10%
27% 24%
8%
21% 15%
30%
45% 34%
53%
0% 20% 40% 60% 80% 100%
National average
North Carolina Texas Florida Georgia South Carolina
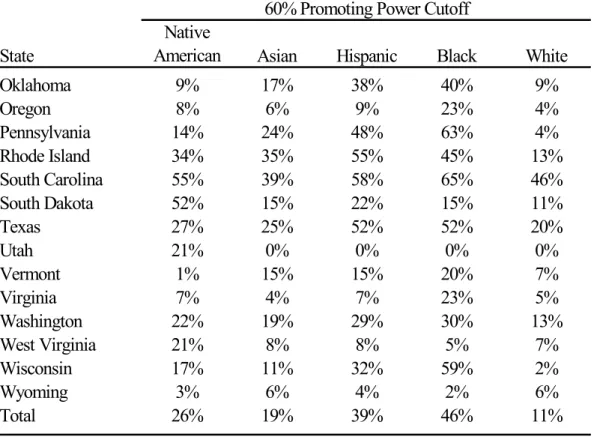
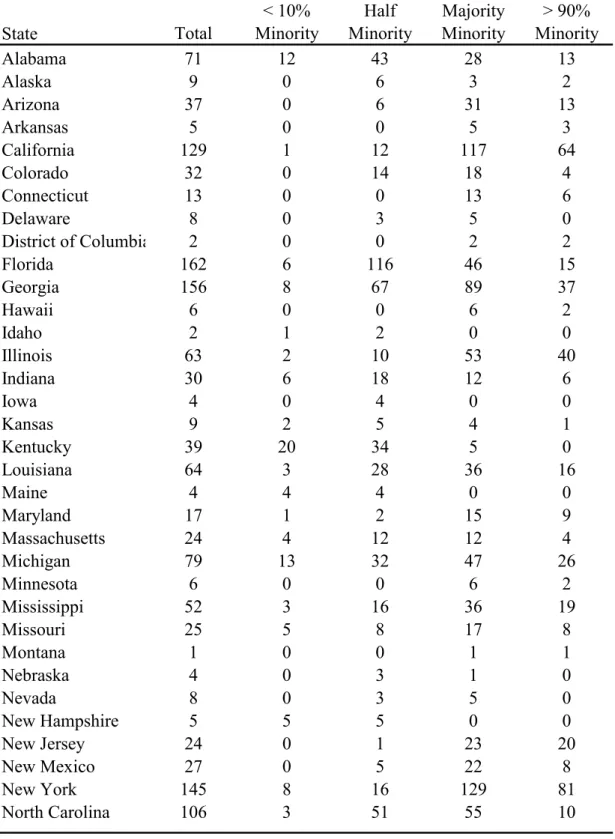
One result of the pervasiveness of weak promoting power high schools in these states is that across all minority groups (Native American, Asian, Hispanic and Black), as well as among white students, the percent of students who attend a weak promoting power high school is above the national average (Table 7).
Table 7:
Percentage of students attending High Schools with Weak Promoting Power (60% or less) in five Southern States by race/ethnicity, Class of 2002
Black Hispanic Asian Native American White
Texas 52% 52% 25% 27% 20%
Georgia 68% 57% 38% 41% 37%
South Carolina 65% 58% 39% 55% 46%
North Carolina 47% 36% 27% 65% 24%
Florida 52% 39% 40% 39% 41%
National average 46% 39% 19% 26% 11%
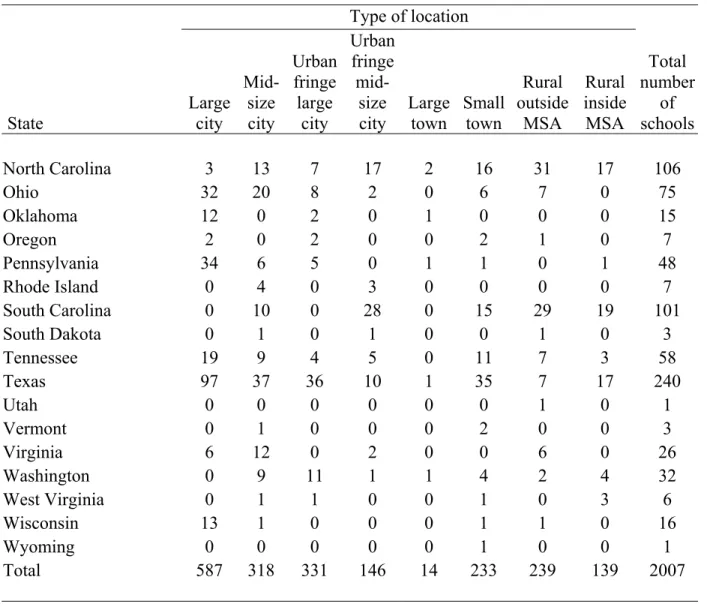
It is only in the South that large numbers of White students attend high schools in which on-time graduation is not the norm. In some states, this appears to be partly a function of rural poverty. In North and South Carolina, as seen in Table 8, most of the high schools with weak promoting power are located in small towns or rural areas. In these areas, which are typically one high school counties, there are about equal numbers of majority White and majority minority high schools with weak promoting power. In Georgia and Florida, however, weak promoting power high schools are pervasive in both rural and urban areas.
Table 8:
Number of Weak Promoting Power (60% or less) High Schools by Locale in five Southern States, Class of 2002
Locale
State Total Cities
Urban
Fringe Towns Rural
North Carolina 106 16 24 18 48
South Carolina 101 10 28 15 48
Georgia 156 34 44 41 37
Florida 162 51 61 15 35
Texas 240 134 46 36 24
~ SPOTLIGHT ON TEXAS ~
EXAS IS DIFFERENT. In many respects, Texas’s distribution of weak promoting power high
schools more closely resembles a northern industrial state than a southern state. As seen in Table 8, the majority of weak promoting power high schools in Texas are found in urban areas and they are almost exclusively majority minority high schools. More than half of the state’s 240 high schools with weak promoting power are located in cities; 91% of these high schools are minority majority and 56% are more than 90% minority (Figure 11).
Figure 11:
Percentage of High Schools in Texas Cities with Weak Promoting Power (60% or less) that are Majority Minority and 90% Minority,
Class of 2002
56% (75) 91% (122)
0% 20% 40% 60% 80% 100%
50% or more minority 90% or more minority
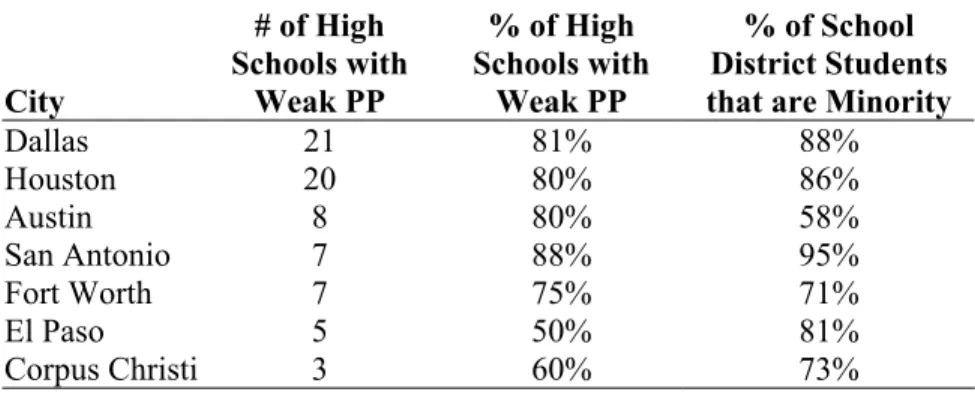
Table 9 shows that in most of Texas’ central city school districts, which educate predominately minority students, three fourths or more of the high schools have weak promoting power. In these districts, students have few opportunities to attend a high school in which graduating is the norm.
Table 9:
Minority Concentration of High Schools with Weak Promoting Power (less than 60%) in Major Texan Cities, Class of 2002
City
# of High Schools with
Weak PP
% of High Schools with
Weak PP
% of School District Students that are Minority
Dallas 21 81% 88%
Houston 20 80% 86% Austin 8 80% 58%
San Antonio 7 88% 95%
Fort Worth 7 75% 71%
El Paso 5 50% 81%
The Rest of the Nation
Details on the number of high schools with weak promoting power, their concentration, locale, and the extent to which they are attended by minority students can be found in Appendix A for each state and the 100 largest cities.
There are only five states, all with small minority populations, (Maine, New Hampshire, North Dakota, Idaho, and Wyoming) in which high schools with weak promoting power are rare. In these states 90% or more of all students, regardless of majority or minority status attend high schools with good promoting power. Montana, Utah, and West Virginia stand out as states in which all groups attend high schools with decent promoting power at high rates except for Na-tive Americans. In each of these states roughly one in five NaNa-tive Americans attends a high schools in which graduation is not the norm. This is still considerably better, however, than in Arizona, New Mexico, South Dakota, and North Carolina, states with large Native American populations, where nearly half or more of all Native American high school students attend a high school with weak promoting power.
Delaware and Rhode Island stand out as two small states, in which students across all groups at-tend high schools with weak promoting power at relatively high rates. New Mexico and Colo-rado share that distinction among larger states.
P
OLICY
I
MPLICATIONS
This study locates the nation’s dropout crisis in approximately 2,000 high schools. These high schools are found in nearly every state, but are concentrated in northern and some western cities, southern and southwestern states and three mega-districts—New York City, Chicago, and Los Angeles. Currently, close to one in five students attends a high school with weak promoting power. Among minorities, the rate approaches one in two. There are cities and rural counties where students have virtually no choice but to attend a public high school in which graduation is not the norm.
Until the nation’s dropout factories are reformed or replaced, the promise of the American High School as an engine of economic growth and social transformation will not be met. Indeed, given their fierce concentration in areas populated by large numbers of poor and minority youth, these high schools not only deny many the promise of equal educational opportunity; they act as a wedge driving the country further apart.
Transforming high schools that produce the majority of the nation’s dropouts is a daunting chal-lenge that current reform efforts have not even begun to confront. Traditional approaches to school reform have applied a “pipeline” approach to improving education achievement and at-tainment, favoring investment in the early grades with minimal direct intervention in high schools themselves. Recent findings from Chicago, however, show that this approach, in itself, is not enough. In Chicago, targeting reform resources to the elementary grades, ending social pro-motion with an eighth-grade gateway exam, expanding summer school and other extra help structures, implementing high stakes accountability and assessments for students, teachers and administrators, and providing just general technical assistance to high schools did not lead to substantial improvements in the graduation rate (Allensworth, 2004). The message from Chicago is clear―low-performing high schools cannot be fundamentally improved by attempts to
“inocu-late” children early and encouraging high school teachers and students to work harder at existing practices within the traditional organizational structure of large, non-selective neighborhood high schools (Lee, 2002). High schools with high dropout rates need to be directly targeted and radi-cally re-invented if they are going to see substantial improvement.
Similarly, current federal policy and programs provide necessary but insufficient guidance and resources for the systemic overhaul needed to improve national graduation rates. Recent reports by Education Trust (2004) and the Harvard Civil Rights Project (2004) demonstrate that No Child Left Behind (NCLB) has no real teeth at the high school level. States have been allowed to adopt minimal improvement targets for graduation rates and most have done just that. Throw in the lack of a uniform measurement standard for graduation rates and it becomes clear that NCLB, in its current form, will neither accurately identify the nation’s dropout factories nor prod many of them to improve.
The U.S. Department of Education currently funds two initiatives that provide some direct fund-ing for high school reform―the Comprehensive School Reform (CSR) and the Small Learning Communities (SLC) grants program. Both fight annually for their survival and provide neither enough funding nor guidance to reform the nation’s most troubled high schools. Each, for exam-ple, only provides funds for three years, not long enough to see even one class through to gradua-tion. The U.S. Department of Education is also seeking additional funds to provide instructional supports to students who enter high school unprepared for high standards high school work. This too is welcome, but its initial goal is very modest―to support demonstration programs in a small number of districts. As a result it does not come close to providing sufficient support to assist all high schools with severe dropout rates.
Other advocates of increased attention to high school reform are also aiming too low to effec-tively solve the problem of high schools with weak promoting power. There are bills before Congress, for example, which call for a literacy coach to be placed in every low-performing high school. This would clearly be beneficial, especially if coaching was connected to curriculum specifically designed to support the skill development of adolescent learners. The strategy en-tirely ignores mathematics, however. Failing ninth-grade Algebra is the reason many students are left back in ninth grade, which in turn is the greatest risk factor for dropping out.
Three high school reform approaches promise to promote fundamental change to the traditional organizational structure of large, non-selective neighborhood high schools―the creation of new small schools, the creation of new medium-to-large theme-based schools, and converting large high schools into multiple small learning communities that operate with varying amounts of autonomy within the larger school building. Evidence from this and other studies strongly sug-gests, however, that an exclusive emphasis on any one of these strategies will fall far short of resolving the nation’s dropout crisis. To point:
New Small School Creation. A substantial amount of local and private foundation resources currently supports a movement to replace large comprehensive high schools with small high schools of typically 300 or fewer students. The hope here is that the creation of new, small high schools will provide students with an energized faculty and a higher degree of personalized at-tention and instruction which, in turn, will lead to substantially greater graduation rates. While based on a compelling and largely research-based theory, this movement’s singular focus on new
more of the student population attends high schools with weak promoting power, there are 39 with five or more weak promoting power high schools. To replace these high schools with small schools would require starting, staffing, and sustaining between 25 to 50 high schools in most of these cities, with many more than 100 new high schools needed in the largest cities. The question that remains to be addressed is the extent to which the financial, human, and social capital exists to accomplish this overwhelming task. In cities and rural counties hard pressed by shrinking middle class populations and tax bases, as well as shortages of skilled principals, and near con-tinual churn of superintendents and CEOs, will it be possible to find and sustain the civic capac-ity and investment in personnel development needed to equitably create, successfully run, and manage 25, 50, or 100 plus new high schools?
New Medium-to-Large School Creation. In some cities, efforts are underway to create some-what larger new high schools serving from 600 to 800 students. While the economies of scale afforded by these schools make them a potentially more feasible option for school systems with limited resources, early anecdotal evidence suggests caution. The dual pressures of a high stan-dards environment and expectations of private and local funders (typically present when schools require new buildings or major renovations to existing buildings) can result in the shunting of equity concerns as new school leaders scramble to implement rigorous curriculum and achieve dramatic results in a short time period. In one such school that replaced a declining neighborhood high school, the new school remained non-selective but adopted an open-enrollment system to attract students from across the city interested in its technology focus. The school’s brand new curriculum and energized teachers were not prepared, however, to meet the needs of the substan-tial number of students coming in two or more grade levels behind in basic literacy and mathe-matics skills. As a consequence, the school has a significantly higher transfer rate than other high schools in the city. Just as telling, the enrollment slots reserved for students from the surrounding neighborhood now go unfilled; neighborhood families have concluded that the school is for “other people’s children” (read White and privileged).
Existing High School Conversions. Different approaches to break free from bureaucratic iner-tia and create smaller, more personalized and flexible learning environments, such as converting large schools into multiple small learning communities, face different challenges. First, not all low-performing high schools are good candidates for conversion. Some (we estimate perhaps from 1% to 5% of the 2,000) are such demoralized environments so lacking in leadership, teach-ing capacity, and community support that any effort to turn them around would be quixotic at best. Second, attention to the process of conversion is very important to its outcome. Evidence is emerging that high schools that pursue a phased-in or voluntary approach to converting into mul-tiple small learning communities or schools-within-a-school can produce marked inequities. The first smaller units to be developed typically attract the strongest teachers, entrepreneurial leaders, most motivated students, and community resources, leaving subsequent efforts to struggle with fewer resources. Striking images are emerging of large low-performing high schools in which a section has been turned into a new better resourced small high school, where the fortunate few are provided with access to a better education under the daily gaze of the unfortunate majority still stuck attending a marginally smaller dropout factory. The alternative, converting an entire school at the same time, is an extremely intensive experience requiring substantial technical ex-pertise and commitment to working through difficult staffing, curriculum, facilities, and schedul-ing challenges.
Transforming the Nation’s Dropout Factories:
What Would It Take?
Despite growing interest in high school reform and an increasing number of reform experiments, nothing close to a systematic plan to transform the nearly 2,000 high schools with low graduation rates and high dropout rates currently exists. Such a plan must be forged, however, if we are go-ing to overcome the feasibility, equity, and quality challenges that current reform efforts are fac-ing. Failure to do so runs the risk that current attempts to reform high schools will fall so short of the mark in transforming the high schools that produce the majority of the nation’s dropouts, that the energy behind the reform movement may dissipate before substantial progress can be made. Enough is known about reforming low-performing, high-poverty, neighborhood high schools to transform them. Working models and success stories exist.5 The challenge is to develop the ca-pacity, know-how and will to implement what is known to work in all the high schools in need. First and foremost, it needs to be recognized that truly comprehensive reform is required. A dominant focus on one or even several levers of improvement will not be enough. Increased per-sonalization and student outreach, high standards, intensive instructional programs to close achievement gaps, improved teacher quality, professional development, and teacher supports, engaging school programs, and strengthened connections between high schools and colleges and employers are all needed in large, sustained, and coordinated measures. To date, however, this has rarely occurred because schools and districts have lacked the energy, know-how, and re-sources to do all that is needed. Instead districts and schools focus on one or two areas of needed reform and then become disappointed and frustrated when the results are not sufficient.
The findings in this report, however, are hopeful in this regard. They show it is possible to iden-tify the number and location of high schools that produce the majority of the nation’s dropouts. This means that reforms and resources can be targeted. Transforming 2,000 high schools, more-over, is not beyond the bounds of human agency. Especially, when the payoff is potentially so large economically, educationally, and socially. In order to get the energy needed to sustain this effort it will be important to bring into the high school reform movement all who stand to benefit from the demise of the nation’s dropout factories-groups interested in economic growth, social justice, youth development, crime reduction, rural prosperity, and urban renaissance at the local, state, and national levels. In order to get the know-how needed to the high schools in need it will be necessary to invest in the development of technical assistance groups who can shepherd school systems and schools through an effective reform process, and join them to networks of reformed and reforming high schools. In order to gather and distribute the financial resources necessary to fundamentally change high schools with weak promoting power a federal commit-ment to raise the budgets of 2,000 high schools by 10% or more will be needed. Because of the tight correlation between weak promoting power and poverty, this could be accomplished by funding Title I to its authorized levels, using the increase to provide high schools with their fair and proportional share of Title I funding. In return for the additional funding, high schools could be required to implement proven reforms. In order to develop, support, and sustain the human resources needed to bring about major improvements in teaching and learning it will be neces-sary for states and school districts to make a commitment to put a high quality teacher in every classroom in every high school with weak promoting power and sustain them with ongoing pro-fessional development.
In addition to human and financial resources, a pragmatic approach will be required. No single reform strategy or set of comprehensive reforms will work for all high schools and all locations. In large cities with multiple high schools in need of reform a mix of strategies will likely be the most productive and efficient. In other words, a combination of new small high schools, middle schools transformed into high schools, and existing high schools broken up into both several small high schools and converted into wall-to-wall small learning communities with a common principal but clearly defined separate spaces, teaching staffs, and student bodies. It will also need to be recognized that the same strategy that works in Detroit, might not be the most effective in rural South Carolina. In fact, the data in the report on the location of high schools with weak promoting power make clear that three very different strategies might be needed. A district strat-egy for cities in which half or more of the students attend a high school with weak promoting power, a state strategy for southern and southwestern states where weak promoting power schools can be found throughout the state, and a school-level strategy for states and school dis-tricts in which weak promoting power schools exist but are not the norm.
Finally, a middle grades connection cannot be overlooked. Every high school with weak promot-ing power is fed by one or more low-performpromot-ing middle grades schools. The major reason stu-dents repeat the ninth grade and enter the dropout track is that they fail too many ninth grade courses. Ninth grade course failure in turn, is in good part driven by students’ lack of intermedi-ate academic skills, weak reading comprehension and fluency abilities, and underdeveloped mathematical knowledge. In short, the academic outcomes of a good middle grades education. The connection between a poor middle school education and weak promoting power high schools can vividly be seen in the fact that the very areas which have the highest concentration of weak promoting power high schools, the urban North and the South, are also the areas with the lowest eighth-grade NAEP scores, particularly among minorities (Flanagan & Grissmer, 2002). Hence, high school reform must ultimately be seen as part of a broader secondary school reform movement.
C
ONCLUSION
There are about 2,000 high schools in the United States where graduation is not the norm. These are high schools in which the senior class routinely shrinks to 60% or less, often much less, of the freshman class that entered four years earlier. These high schools are located throughout the nation, but are concentrated in about 50 large cities and 15 primarily southern and southwestern states. High schools with weak promoting power are overwhelmingly attended by minority stu-dents. Outside of the rural South, it is rare to find White students in appreciable numbers attend-ing high schools with the high dropout and low graduation rates signaled by weak promotattend-ing power. Consequently, high schools with weak promoting power are the engines driving the low national graduation rate for minority students, and the growing number of dispossessed young adults who are neither employed nor in school. These high schools must be specifically targeted for reform if the American High School is to fulfill its pivotal role as the means by which chil-dren who grow up in poverty can become adults who lead the nation. Transforming the nation’s dropout factories into high schools that prepare all their students for post-secondary schooling or training and successful adulthood should thus be an urgent national priority. The promoting power indicator allows us to identify the number and location of the high schools that produce the bulk of the nation’s dropouts. We now know where these schools are. It is time to go about the hard work of fixing them.
R
EFERENCES
Allensworth, E. (2004). Ending social promotion: Dropout rates in Chicago after implementation of the eighth-grade promotion gate. Chicago: Consortium on Chicago School Research.
Allensworth, E., & Easton, J. (2001). Calculating a cohort dropout rate for the Chicago Public Schools: A technical research report. Chicago: Consortium on Chicago School Research.
Balfanz, R. (2000). Why do so many urban public school students demonstrate so little academic achievement? In M. Sanders (Ed.), Schooling students placed at risk. Mahwah, NJ: Erlbaum.
Balfanz, R., & Legters, N. (2001). How many central city high schools have a severe dropout rate, where are they located, and who attends them? Estimates from the Common Core of Data. Paper presented at the Dropouts in America Conference, Harvard Civil Rights Project and Achieve, Cambridge, MA. Balfanz, R., Spiridakis, K., Neild R., & Legters, N. (2003). High poverty secondary schools and the
juve-nile justice system: How neither helps the other and how that could change. Paper presented at School to Prison Pipeline Conference, Harvard Civil Rights Project, Cambridge, MA.
Baltimore City Public School System (BCPSS) (1995). Maryland School Performance Program Report, 1995. Baltimore, MD.
Baltimore City Public School System (BCPSS) (1997). Maryland School Performance Program Report, 1997. Baltimore, MD.
Carnevale, A., & Desrochers D. (2004). Standards for what? The economic roots of K-16 reform. Prince-ton, NJ: Educational Testing Service
Council of Great City School Systems (1994). National Urban Education Goals: 1992-93 Indicators Re-port. Washington DC: Council of Great City Schools.
Corvers, S., & Franklin, B. (2003). A second look at Louisiana dropout, completion, and graduation rates. Paper presented at the annual meeting of the American Educational Research Association, Chicago. Educational Testing Center (ETS) (1995). Dreams deferred: High school dropouts in the United States
(Policy Information Report). Princeton NJ: Policy Information Center.
Flanagan, A., & Grissmer, D. (2002). The role of federal resources in closing the achievement gap. In J. Chubb & T. Loveless (Eds.), Bridging the achievement gap. Washington, DC: Brookings Press. Frymier, J. (1996). Determining dropout rates in the large city school districts: Problems and
accom-plishments. The High School Journal, Oct./Nov. 1-10.
Greene, J.P (2002). Public school graduation rates in the United States (Civic Report No. 31). New York: The Manhattan Institute for Policy Research
Haney, W., Maduas, G., Abrams, L., Wheelock, A., Miao, J., & Gruia, I. (2004). The education pipeline in the United States 1970-2000. Boston: Boston College, The National Board on Educational Testing and Public Policy.
Johnston, R.C. (2000). Chicago study questions results of retention. Education Week, Sept. 20, p. 3 Jordan, W., McPartland, J., Legters, N., & Balfanz, R . (2000). Creating a comprehensive school reform
model: The Talent Development High School with Career Academies. Journal of Education for Stu-dents Placed At Risk, 5 (1-2), 159-183.
Kaufman, P. (2001). The national dropout data collection system: Assessing consistency. Paper presented at “Dropouts in America” Conference, Harvard Civil Rights Project and Achieve.
Kominski, R. (1990). Estimating the national high school dropout rate. Demography, 27(2), 303-311. Legters, N. (2000). Small learning communities meet school-to-work: Whole school restructuring for
urban comprehensive high schools. In M. Sanders (Ed.), Schooling students placed at risk. Mahwah, NJ: Erlbaum:
Legters, N., Balfanz, R., Jordan, W., & McPartland, J. (2002). Comprehensive reform for urban high schools: A talent development approach. New York: Teachers College Press.
Lee, V. (Ed.) (2002). Reforming Chicago’s high schools: Research perspectives on school and systems level change. Chicago: Consortium on Chicago School Research.
Maryland State Department .of Education (MSDE) (1997). 1996-1997: The fact book. Baltimore, MD. Maryland State Department of Education (MSDE) (1999). 1998-1999: The fact book. Baltimore, MD. National Association of Secondary School Principals (2004). Breaking ranks II: Strategies for leading
high school reform. Washington, DC: Author.
National Association of Secondary School Principals (2004). Breakthrough high schools. Washington, DC: Author.
Neild, R., & Weiss, C. (1999). The Philadelphia Education Longitudinal Study (PELS): Report on the transition to high school in the School District of Philadelphia. Philadelphia: Philadelphia Education Fund.
Neild, R. (2000). Special tabulation of the Philadelphia Education Longitudinal Study data.
Neild, R., Balfanz, R. (2001) An extreme degree of difficulty: The educational challenge of the ninth grade in Philadelphia’s neighborhood high schools. Baltimore, MD: Johns Hopkins University, Cen-ter for Social Organization of Schools.
Orfield, G., Losen, D, Wald, J., & Swanson C. (2004). Losing our future: How minority youth are being left behind by the graduation rate crisis. Cambridge, MA: Harvard Civil Rights Project.
Orfield, G., & Lee, C. (2004). Brown at 50: King’s dream or Plessy’s nightmare? Cambridge, MA: Har-vard Civil Rights Project.
Philadelphia Education Fund. 2000. The Talent Development High School: First year results of the Ninth Grade Success Academy in two Philadelphia schools, 1999-2000. Philadelphia: Philadelphia Educa-tion Fund.
Roderick, M., Choing, J., & DaCosta, K. (1998). The Student Life in High School Project: First follow up student outcomes. Chicago: University of Chicago, School of Social Service Administration.
Roderick, M., & Camburn, E. (1999). Risk and recovery from course failure in the early years of high school. American Educational Research Journal, 36, 303-343.
Steinberg, J. (2000). Frustrated parents hope their votes will change schools’ ways. New York Times, Oct. 10. p. A23.
Swanson, C., & Chaplin, D. (2003). Counting high school graduates when graduates count: Measuring graduation rates under the high stakes of NCLB. Washington, DC: Education Policy Center: The Ur-ban Institute. Paper prepared for the annual meeting of the National Economic Association.
Swanson, C. (2004). Who graduates? Who doesn’t? A statistical portrait of public high school gradua-tion, Class of 2001. Washington, DC: Education Policy Center: Urban Institute.
Toch, T. (2003). High schools on a human scale: How small schools can transform American education.
Boston: Beacon Press.
Wald, J., & Losen, D. (Eds.) (2003). Deconstructing the school to prison pipeline. New Directions for Youth Development No.99 Fall. San Francisco: Jossey-Bass.
Warren, J.R. (2003). State-level high school graduation rates in the 1990s: Concepts, measures, and trends. Paper presented at the annual meeting of the American Sociological Association, Atlanta. Wehlage, G., & Rutter R. (1986). Dropping out: How much do schools contribute to the problems?