SIGMOD RWE Review
”Towards Proximity Pattern Mining in Large Graphs”
Fabian Hueske, TU Berlin June 26, 2010
1
Review
This document is a review report on the paper ”Towards Proximity Pattern Mining in Large Graphs” by A. Khan, X. Yen, and K. Wu by Sigmod’s 2010 Repeatability and Workability Evaluation Committee.
In this section the provided resources (code, data sets, setup information) and hardware setups of the authors and reviewers are discussed. Detailed information on all experiments that the review conducted or tried to conduct for repeatability or workability can be found in sections 2 and 3.
1.1
Provided resources
The authors provided the source code, binaries and data sets to repeat most of the presented experiments. One data set (Intrusion Network data set) and the corresponding source code were not provided. For some experiments the appropriate source code was not included. Following the authors instructions, the reviewer was able to modify the available code (commenting out code lines or replacing constants). While the experiments for Figures 9a, 9b, and 10 could be (partly) successfully conducted, the reviewer failed to repeat Figure 12. However, the author did not spend too much time on Figure 12, due to time restrictions. The experimental setup was well described. Although some more automatism (scripts to execute the full pipeline and collect results) would have eased the review.
1.2
Comparing Experimental Setups
The experiments of the paper were run on a server with a single-core Intel Xeon CPU running at 2.5GHz and 32GB RAM.
The reviewer’s experiments were conducted on a server with two AMD Opteron QuadCore CPUs running at 2.3GHz and 32GB RAM.
Both setups run Linux (Authors: Fedora 8, Reviewer: Ubuntu 8.04 LTS). Both hardware configurations are quite similar. The provided source code is single threaded and very memory consuming. Hence, the multiple cores of the reviewers setup have no impact and both setup should have similar restrictions on memory consumption.
1.3
Interaction with Authors
The authors were very helpful and responded fast to the reviewers questions. All questions of the reviewer were satisfyingly answered.
2
Repeatability Evaluation
In this section detailed information on the experiments to repeat the result presented in the paper are given. The reviewer ran all runtime experiments three times and presents the average of those runs.
2.1
Table 3 & 4
Both tables could be exactly reproduced.
2.2
Table 5 & 6
Experiments could not be repeated due to the missing Intrusion Network data set.
2.3
Table 7
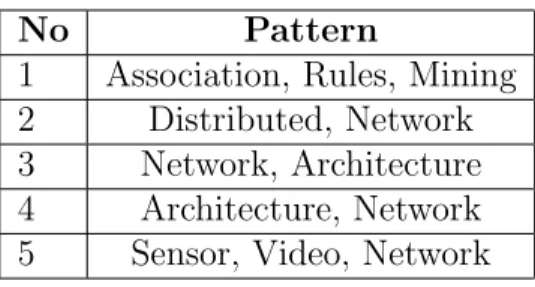
The results of Table 7 could not be fully reproduced. However, the Top-5 interesting patterns presented in the paper are included in the Top-25 results obtained from the reviewer’s experiment. The reviewer asked the authors to comment on that: ”due to limited space in the paper, we tried to report top-5
No Pattern
1 Association, Rules, Mining 2 Distributed, Network 3 Network, Architecture 4 Architecture, Network 5 Sensor, Video, Network
Table 1: Repeated Table 7
patterns of different types. Therefore, instead of reporting the small patterns of size 2 (where you have many repetitions of some label, i.e., 29 [Network], 5 [Architecture], 4 [Distributed] etc), we report the top patterns of size-3 from the bottom of the result file. The smaller patterns are anyway not the closed patterns
Also note that, this is a comparison result based on the randomized graph. In the data submitted, we provide one randomized graph; however, when we did the experiment before writing the paper; we ran the randomization code and generate a separate random graph; so there might be slight difference in the top-5 patterns. However, this difference should not be very abrupt. For example, out of the top-5 that you reported for fpTree k proxy, I can see two patterns of size 3, which are exactly same as the two mentioned in our paper.”
2.4
Table 8
Table 2 shows the repeated results for Table 8. The reviewer observed longer runtimes compared to the authors results. However, the ratio of the repeated runtimes (percentages of total runtime) are consistent with the results pre-sented in the paper.
The column with the intrusion data set could not be verified.
2.5
Figures 9a, 9b & 10
The authors provided (partly) incorrect source code for the experiments in this section. Following the authors instructions, the reviewer had to exclude some lines in one source code file and recompile the program.
Steps Last.fm DBLP
NmPA 2 305
FP-tree formation 11 117.6
Mining 8 380.6
Table 2: Repeated Table 8
Figs9
Page 1 100000 200000 300000 400000 500000 600000 684911
0 200 400 600 800 1000 1200
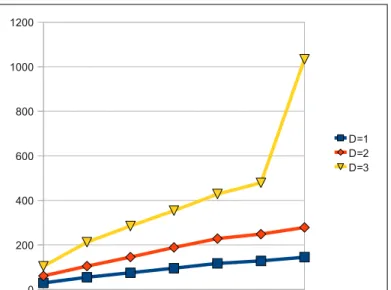
Fig 9a
D=1 D=2 D=3
Figure 1: Repeated Fig 9a
Figs9
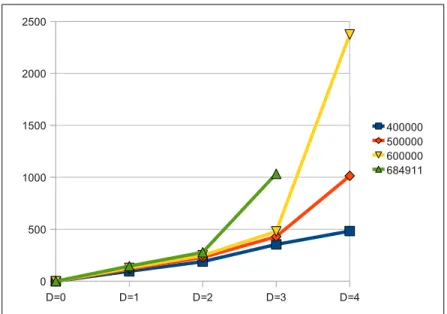
Page 1 D=0 D=1 D=2 D=3 D=4 0
500 1000 1500 2000 2500
Fig 9b
400000 500000 600000 684911
Figure 2: Repeated Fig 9b
Figures 1 shows the results for the repeated experiments to obtain Figures 9a). Again the reviewers observed longer runtimes in general. The curves in the figure have a similar behavior. Only the data point depth=3 and 680k nodes is significantly different. The reviewer observed that the executing machine ran out of memory and had to swap to disk which might be a reason for the significantly lower performance. However, it is not clear why this behavior can not be concluded from the authors figure 9a.
Figure 2 is the reconstruction of Figure 9b) from the paper. The reviewer was not able to get runtime information for depth=4 and 680k nodes. The program terminated because it was not able to allocate additional memory. Although the repeated figure resembles the original figure from the paper.
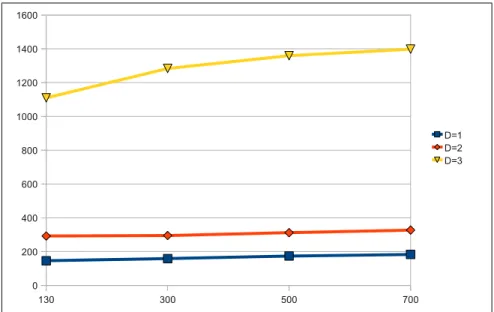
Figure 3 repeats Figure 10 from the paper. The slope of curves of the repeated figure are very similar to original figure. However, the repeated ex-periments for depth=3 have significantly longer runtimes that the presented results. The reviewer accounts this to the high memory requirement of the experiment, again swap-space is used.
Fig10
Page 1
130 300 500 700
0 200 400 600 800 1000 1200 1400 1600
Fig 10
D=1 D=2 D=3
Figure 3: Repeated Fig 10
Steps aFP (approx.) pFP (exact)
FP-Tree Formation 0.3 High variance, min: 1, max: 42
Mining 8 High variance, min: 10, max: 300
Table 3: Repeated Table 10
2.6
Table 9 & 10
Table 9 from the paper was reproduced (not shown).
Table 3 shows the results for reproducing Table 10 of the paper. For the aFP algorithm the results seem to support the presented results. However, the runtimes of the pFP algorithm have very high variance. This issue might be solved with help of the authors.
2.7
Figures 11 & 12
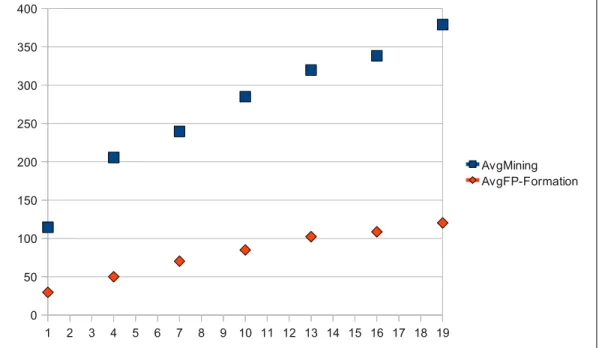
Figure 4 repeats Figure 11. Although the runtimes of the reviewer’s runs are longer, the curves of both figures show identical behavior.
The reviewer was not able to conduct experiments to reproduce Figure 12.
Fig11
Page 1
1 2 3 4 5 6 7 8 9 10 11 12 13 14 15 16 17 18 19 0
50 100 150 200 250 300 350 400
AvgMining AvgFP-Formation
Figure 4: Repeated Fig 11
First, the authors did not provide the source code necessary to conduct the experiments. The author modified a source file by changing the values of constants as instructed by the authors: ”Fig 12: As you have rightly figured out, the two files lex sort.cpp and fpTree k proxy.cpp needs to be modified if the number of labels vary. Also, it is not difficult to figure out what are places where one needs to make changes. I provide the list of line numbers where the changes should be made. Assume, the total no of labels after preprocessing is L.” However, the reviewer was not able to run the reproduce the results, because of the program’s termination. Although it should be mentioned, that the reviewer did not spend too much effort in solving the issue due to time restrictions.
3
Workability Evaluation
The reviewer conducted a workability experiment to see how the runtime of the NmPA method depends on the number of edges. In the paper the authors state that their NmPA algorithm’s complexity is the same as NPA’s. NPA’s complexity is given as O(|V| ∗dt∗s), where d is the is the average
degree of the nodes, t is the number of iterations (which depends on and α), and s is the average number of labels of a node. The authors comment the complexity with following statements:
• ”Since t << |V|, the complexity is almost linear in the number of vertices. [...] In NPA, the probabilistic association value of a label at distance t is given by e(−α∗t). Since we ignore the value less than ,
t ≤1/α∗ln(1/)”. (Section 4.1)
• ”NmPA has the same complexity as NPA. However, in practice the propagation decays much faster since we normalize the probabilistic as-sociation with respect to the number of neighboring nodes at each iter-ation.” (Section 4.2)
The reviewer generated a synthetic graph with the following properties: 100k nodes, 20 labels, labels are assigned randomly to nodes with an average of 5 labels per node, edges are assigned randomly between nodes. The number of nodes is varied from 1m to 5m. Hence, the average degree of nodes vary from 20 to 100 (one edge increments the degree of two nodes). The reviewer ran the experiments with the NmPA-code (normalizedI.cpp) provided for
varyEdges
Page 1
1000000 2000000 3000000 4000000 5000000 0 50 100 150 200 250 300 350 400 D=2 D=3
1000000 2000000 3000000 4000000 5000000 0 50 100 150 200 250 300 350 400 450 500 D=2 D=3 D=4
Figure 5: NmPA - Vary Edges
the dblp dataset. For varying the maximum depth (number of iterations) the reviewer adapted constant in the code to allow maximum depths of 3 (= 0.03) and 4 (= 0.01).
Figure 5 shows the result of the experiment. For all depths the increase of runtime is linear to the increasing number of edges. Looking at the stated complexity of NmPA, the number of iterations (depth) should have a sig-nificant impact in the runtime of NmPA. The linear increase indicates that most labels are only propagated over one hop. An increasing number of edges also increases the average degree of nodes which may leads to a smaller nor-malization factor. Hence, the nornor-malization factor significantly reduces the propagation depth of labels.
The findings of the experiment to analyze NmPA’s dependency on the number of edges support the statements of the authors. NmPA’s normal-ization factor significantly reduces the propagation depth of labels such that NmPA’s runtime becomes linear with respect to the number of nodes for randomly generated graphs. Given a real-world graph where the labels are not randomly assigned to nodes might lead to different results.
4
Conclusion
The reviewer was able to reproduce most results presented in the paper. However, some experiments failed or could not be run due to a missing data set, lack of available memory, or possibly wrong modifications of the source code by the reviewer. In some cases the authors did not provide correct source code to repeat the experiments. However, those issues were solved when the reviewer asked the authors for help.
The reviewer conducted a workability evaluation to analyze NmPA’s com-plexity with respect to the number of edges. The result is in line with the author’s statements in the paper.