Infrastructure Initiative
When the Road Price Is Right
Land Use, Tolls, and
When the
Road Price
Is Right
Land Use,
Tolls, and
Congestion
Pricing
© 2013 by the Urban Land Institute
Printed in the United States of America. All rights reserved.
Recommended bibliographical listing: Urban Land Institute. When the Road
Price Is Right: Land Use, Tolls, and Congestion Pricing. Washington, D.C.:
Urban Land Institute, 2013. ISBN 978-0-87420-262-5
About ULI
The mission of the Urban Land Institute is to provide leadership in the responsible use of land and in creating and sustaining thriving communities worldwide. ULI is committed to
• Bringing together leaders from across the fields of real estate and land use policy to exchange best practices and serve community needs;
• Fostering collaboration within and beyond ULI’s membership through mentoring, dialogue, and problem solving;
• Exploring issues of urbanization, conservation, regeneration, land use, capital formation, and sustainable development;
• Advancing land use policies and design practices that respect the uniqueness of both the built and natural environments;
• Sharing knowledge through education, applied research, publishing, and electronic media; and
• Sustaining a diverse global network of local practice and advisory efforts that address current and future challenges.
Established in 1936, the Institute today has nearly 30,000 members worldwide, representing the entire spectrum of the land use and development disciplines. ULI relies heavily on the experience of its members. It is through member involvement and information resources that ULI has been able to set standards of excellence in development practice. The Institute has long been recognized as one of the world’s most respected and widely quoted sources of objective information on urban planning, growth, and development.
About the ULI Infrastructure Initiative
The mission of the ULI Infrastructure Initiative is to promote more sustainable infrastructure investment choices and to foster an improved understanding of the links between infrastructure and land use. Because infrastructure is the foundation for metropolitan prosperity, and because it provides the physical framework for real estate investment, ULI has identified infrastructure as a key priority.
Established in 2007, the initiative achieves its mission through a multifaceted program of work that leverages ULI’s extensive public and private networks and includes research and education, publications, and convenings.
The ULI Infrastructure Initiative is led by full-time staff with a deep understanding of global infrastructure challenges and opportunities. An advisory group composed of industry leaders guides the program. Key Infrastructure Initiative activities include • A global infrastructure report, produced in collaboration with Ernst & Young
since 2007;
• Ongoing programming to promote regional infrastructure solutions; • Regular e-mail updates to infrastructure audiences; and
• Exploration of infrastructure topics relevant to ULI members and to ULI’s public and private partners.
Connect with the ULI Infrastructure Initiative
To learn more about the ULI Infrastructure Initiative’s work, visit the website (www. uli.org/infrastructure) and blog (www.uli.org/infrastructureblog) and follow us on Twitter (@uli_infra). To subscribe to the Infrastructure Update newsletter, e-mail infrastructure@uli.org.
The ULI Infrastructure Initiative welcomes new partners and sponsors. To explore opportunities to work with us, contact infrastructure@uli.org.
ULI Senior
Executives
Patrick Phillips
Chief Executive Officer Cheryl Cummins Executive Officer Michael Terseck
Chief Financial Officer/Chief Administrative Officer Richard M. Rosan
President, ULI Foundation Lela Agnew
Executive Vice President, Communications Kathleen B. Carey
Executive Vice President/Chief Content Officer
David Howard
Executive Vice President,
Development and ULI Foundation Joe Montgomery
Chief Executive, Europe Marilee Utter
Executive Vice President, District Councils
Project Staff
Rachel MacCleery
Vice President, ULI Infrastructure Initiative Sarah Jo Peterson
Research Director, ULI Infrastructure Initiative
Casey Peterson
Project Employee, ULI Infrastructure Initiative
Production Staff
James Mulligan Managing Editor David James Rose Manuscript Editor Betsy VanBuskirk Creative Director Anne Morgan Graphic Designer Craig Chapman
Senior Director, Publishing Operations
Authors
Sarah Jo Peterson
Research Director, ULI Infrastructure Initiative
Rachel MacCleery
Vice President, ULI Infrastructure Initiative
The views, opinions, and recommendations expressed in this report are the
responsibility of the ULI Infrastructure Initiative and do not necessarily reflect those of individual ULI members, individual participants in the workshops and interviews conducted as part of the research project, or the project funder.
Contents
Executive Summary ... 1
Part 1:
Shifting Approaches to
Collecting Revenue from Transportation... 3
• Taxes on Motor Fuels: A Declining Revenue Source ... 4
• Technology Breathes New Life into Tolling ... 5
• Connections between Land Use and How to Pay for Roads ... 6
• From Free Roads to Tolled Roads ... 9
• Conclusion ... 14
Part 2:
Land Use and Tolls, VMT Taxes, and Congestion Pricing ...15
• Introduction to the ULI Thought Experiment ...16
• Metropolitan Development Trends ...22
• Two Scenarios: Value Pricing on Managed Lanes ...23
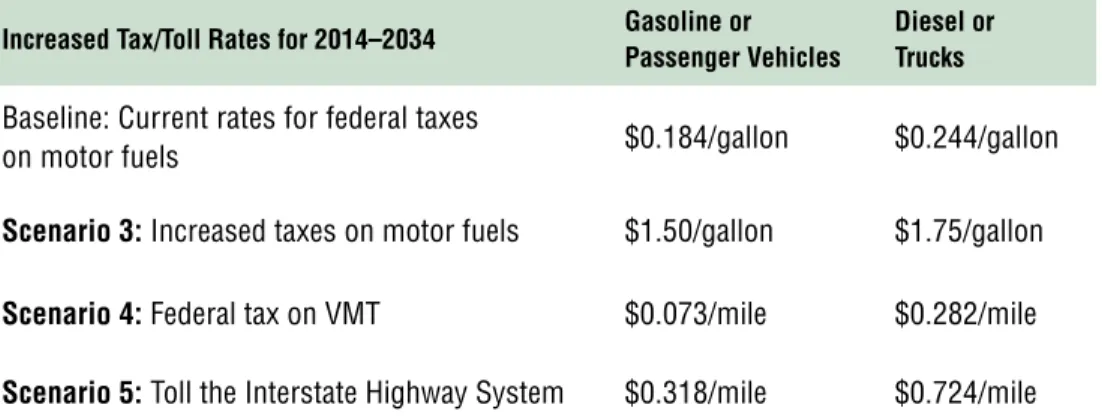
• Three Scenarios: Increased Tax Rates and Tolls ...31
• Conclusion ... 40
Part 3:
Conclusions for Today’s Decision Makers ... 41
• A Broader Look at Toll Roads ...42
• Transportation Revenue Mechanisms and Equity ...42
• Implications for Developers, Planners, and Researchers ...43
• Conclusion ... 44
Acknowledgments ... 45
• List of Participants ... 45
• Special Thanks ... 46
Sidebars
• U.S. Federal Transportation Policy and Tolling ...12• I-95 Express Lanes, Broward and Miami-Dade Counties, Florida ...20
• I-15 Express Lanes, San Diego, California ...26
• U.S. 36 Bus Rapid Transit/Managed-Lanes Project, Colorado ...28
• Intercounty Connector, Maryland ...34
Figures
Figure 1: Vehicle Fuel Efficiency and Motor Fuel Taxes ... 4
Figure 2: Express Lanes and HOV Lanes in the United States ... 6
Figure 3: The Range of Tolls for Roads and Bridges ... 7
Figure 4: Revenue Mechanisms and Their Relationship to Motor Vehicle Travel.. 9
Figure 5: Review of Transportation Revenue Mechanisms ... 10
Figure 6: Quick Summary of the Thought Experiment Scenarios ... 15
Figure 7: Transportation and Land Use: Two Models ... 17
Figure 8: Summary of the Five Scenarios and Their Impacts ... 19
Figure 9: Trends for Four Types of Metropolitan Development ... 22
Figure 10: The Relationships among Speed, Flow, and Price ... 24
Figure 11: Tax and Toll Rates Used in the Thought Experiment ... 32
Abbreviations
BRT bus rapid transit HOT high-occupancy/toll HOV high-occupancy vehicle ICC Intercounty Connector IHS Interstate Highway System TOD transit-oriented development
Executive Summary
The United States is in the beginning stages of a significant shift in how the country collects revenue from—and pays for—its transportation system. After decades of de-pending on taxes on motor fuels, federal, state, and metropolitan leaders are expand-ing the use of tolls. They are lookexpand-ing to tollexpand-ing to pay for new and revitalized transporta-tion infrastructure. They are also experimenting with tolling’s powerful ability to provide a new benefit to road users: the reliable, congestion-free trip.
Compared with other potential revenue sources, such as sales taxes, income taxes, and even taxes on motor fuels, tolling and related schemes to charge a tax or fee for every mile driven have much stronger potential to affect decision making about land use. Tolling that enables congestion-free travel increases the probability that the tolled road will have impacts on land use and development.
New types of tolling also present decision makers with many choices about how to manage new tolled roads and how to coordinate tolled facilities with transit service. The outcome of these decisions will influence how these new facilities interact with land development and whether the opportunities they promise for widespread benefits will be fully realized.
ULI believes it is important to include land use—the impacts, concerns, and opportu-nities—in discussions about the future of tolling and other changes to how revenue is collected from transportation. The prism of land use should encompass how tolling’s impacts on land use will affect societal equity.
To raise awareness of land use and frame the issues for future research and discus-sion, the ULI Infrastructure Initiative convened a group of experts, including leaders representing transportation and land development, to participate in workshops and interviews conducted in the summer of 2012. Study participants explored scenarios constructed as part of a thought experiment on how land development in metropolitan areas would be affected by the spread of congestion pricing, the expansion of tolled highways, or the adoption of taxes on vehicle-miles traveled (VMT).
The ULI Infrastructure Initiative also developed five brief case studies of tolling in Flor-ida, Texas, California, Colorado, and Maryland. The case studies illustrate the different policy options for managing travel reliability, traffic volume, travel speeds, and revenue targets and for integrating tolling and transit service. They also explore how these new tolled facilities are being coordinated with land use and development.
This report documents the results of the ULI Infrastructure Initiative thought experiment and the case studies. Among the most significant conclusions:
• The potential for tolling and other new transportation revenue mechanisms to influence land use is real, but the magnitude of the impacts is likely to be modest.
• The most dramatic impacts—and opportunities—are likely to be located in the corridors surrounding tolled roads or highways with the option for congestion-free travel.
• The impacts on land use will vary greatly by metropolitan region and will be influenced by the transportation network—including mass transit services—land use patterns, local land use policies, and economic trends.
• Tolling and other transportation revenue mechanisms have the potential to interact with land use in ways that support growing market preferences for development in compact, mixed-use, walkable nodes, but achieving this objective will require careful coordination with land use policies and other transportation services, include transit service.
• Because tolling that manages congestion is permanent and not priced according to the cost of the facility, policy discussions need to include the appropriate uses for “excess” revenue.
Developers, planners, and researchers should work within their respective professional communities to advance and disseminate knowledge about these new uses for tolling and congestion pricing and their impacts on land use. Reaching out across disciplines will strengthen efforts to conceptualize research projects, develop best practices, and set standards. Of equal importance, developers, planners, and researchers offer unique perspectives that will be valuable to policy makers at the federal, state, and local levels. All should strive to ensure that these new transportation services and the land uses that are attracted to them achieve a broad set of policy goals without creating unintended consequences.
By paying attention now—through framing the issues for policy discussions, future re-search, and the development of best practices—Americans can more fully realize the potential opportunities to tie transportation choices to desired land use outcomes.
Part 1:
Shifting Approaches to Collecting
Revenue from Transportation
Imagine living and working in American metropolitan areas 20 years from now:
l Will the Interstate Highway System be converted to toll roads, making expressway travel available only for an extra charge? To what lengths will people go to avoid the toll roads? Will locations near the toll roads be attractive places to live? To work? To shop?
l Will the government send you a monthly bill charging for every mile you drive? Or will you opt to load miles in advance on a card that triggers a meter installed in every car? Will you think about that charge per mile every time you decide on a destination and make a vehicle trip? Or, instead, will you prefer to pay the charges through an unlimited-miles plan?
l Will the stress of being stuck in congestion on highways be a thing of the
past? Instead, will people talk about choosing to use the free-flowing express lanes—by riding a bus or paying a higher toll for a trip by personal vehicle—or taking their chances in the regular lanes? How much of a premium will people be willing to pay for locations near the best congestion-free express lanes?
l Will the new toll roads, charges per mile of driving, and the option for
congestion-free highway travel change how people think about land use? Will they change where people want to live? Locate a business? Shop and recreate? The United States is on the cusp of a tremendous shift in how the country collects revenue from—and pays for—its transportation system. After decades of depending on the proceeds from taxes on motor fuels, decision makers are looking anew at a wide range of revenue sources to fund investments in and operations of roads, bridges, and mass transit.
In search of revenue to pay for transportation infrastructure, states and metropolitan areas are increasing their use of tolling, both on new roads and on additional lanes along existing roads. They are starting to charge tolls for access to carpool lanes, as a way to better use capacity and raise revenue, and as a way to provide congestion-free travel options. States and metropolitan areas are also experimenting with technologies that make it possible to charge for each mile of driving.
Compared with other revenue sources, such as sales taxes or income taxes, what makes tolls and charging per mile different is their much stronger potential to affect decision making about land use. Tolls that enable congestion-free travel increase the probability of impacts on land use.
ULI believes it is important to include land use—the impacts, concerns, and opportu-nities—in research, discussions, and debates about the future of tolls and other trans-portation revenue mechanisms, including taxes on motor fuels and charging per mile.
When the Road Price Is Right is part of a ULI Infrastructure Initiative project designed to raise awareness of land use in debates at the federal, state, and local levels about
how Americans pay for transportation. By paying attention now—through framing the issues for policy discussions, future research, and the development of best prac-tices—Americans can more fully realize opportunities to tie transportation choices to desired land use outcomes.
When the Road Price Is Right contains three parts. Part 1 describes changes in how Americans pay for transportation, the types of revenue sources under consideration, and why tolls and proposals that charge per mile have stronger potential to trigger a land use response than other revenue mechanisms. Part 2 presents the results of a series of ULI-led workshops and interviews with leading experts in transportation and land development who analyzed the land use impacts of charging tolls, collecting a tax on every mile driven, and instituting value pricing to provide free-flowing traffic on expressways. Part 3 covers conclusions for today’s decision makers and recommen-dations for planners, developers, and researchers.
Taxes on Motor Fuels: A Declining Revenue Source
For decades, federal and state taxes on motor fuels have funded the lion’s share of surface transportation infrastructure investments. Moreover, there was a rough relation-ship between the amount of revenue generated and transportation demand. Revenue increased the more people drove their cars and trucks and the more fuel their vehicles consumed. Because revenues from federal and state taxes on motor fuels are dedi-cated (for the most part) to spending on surface transportation, more and more driving —the trend throughout the second half of the 20th century—meant more and more revenue for roads, bridges, and mass transit.
American drivers, however, did not have to give the tax much thought. As an excise tax charged per gallon of fuel and collected from fuel suppliers, the tax was—and is— indirect and mostly hidden.
Starting in 2000 or so, the reliability of revenue from motor fuel taxes began to decline. Americans stopped increasing the amount they drove; vehicle-miles traveled per capita peaked in 2004 and even total vehicle-miles traveled flattened out by the end of the decade. The mid-decade run-up of fuel prices sent Americans in search of fuel-efficient vehicles and other transportation alternatives, decreasing even further both fuel consumption and vehicle-miles traveled for passengers and freight.
Figure 1: Vehicle Fuel eFFiciency and Motor Fuel taxes
When Fuel Efficiency Increases, the revenue Collected from Motor Fuel taxes Declines
Federal excise tax on gasoline 18.4 ¢ per gallon State excise taxes on gasoline* 21.0 ¢ per gallon
total 39.4 ¢ per gallon
Vehicle fuel efficiency (miles per gallon) tax rate per mile
10 mpg 3.9 ¢ per mile 20 mpg 2.0 ¢ per mile 35 mpg 1.1 ¢ per mile 50 mpg 0.8 ¢ per mile
Forecasters warn that these changes in American fuel consumption are not just blips in the long-term trend or echoes of the recession. Rather, they foretell a new future—one in which Americans drive more fuel-efficient vehicles fewer miles, and where taxes on motor fuels never recover their former power to generate stable—let alone increasing—revenues. Despite the declining burden that the tax rate on motor fuels imposes on taxpayers, little political support has materialized for increasing it to make up for falling con-sumption or to meet current and future infrastructure needs. The U.S. Congress last increased taxes on motor fuels in 1993, and only 15 states raised their tax rates on motor fuels between 1997 and 2011. The diminishing support for continuing to pay for surface transportation with revenues from taxes on motor fuels became apparent at the federal level in 2005, when Congress passed SAFETEA-LU (the Safe, Accountable, Flexible, Efficient Transportation Equity Act: A Legacy for Users), a major long-term surface transportation bill, knowing that federal taxes on motor fuels would not gener-ate enough revenue to cover the bill’s authorized spending. In 2008, Congress had to step in with general revenues for the first “bailout” of the Highway Trust Fund. In 2012, Congress gave up on passing another long-term surface transportation bill. SAFETEA-LU’s replacement, MAP-21 (the Moving Ahead for Progress in the 21st Century Act), is a two-year bill that caps spending at existing levels. Even with these limitations, Congress still had to top off the funding with general revenues.
Although per-gallon tax rates that do not account for inflation, reductions in driving, and increases in fuel efficiency mean that the tax burden posed by taxes on motor fuels has declined since 1993, U.S. households are still paying more for transportation overall. A recent study by the Center for Housing Policy and the Center for Neighborhood Tech-nology estimates that between 2000 and 2010 transportation expenses increased by 33 percent, but household income increased by only 25 percent. The continued trend of increasing transportation costs complicates government efforts to raise additional funds via taxes on motor fuels or other transportation-related revenue mechanisms.
Technology Breathes New Life into Tolling
At the same time that transportation policy makers scramble to supplement revenues from taxes on motor fuels, advances in communication and information technolo-gies allow for entirely new ways of thinking about the oldest of transportation revenue mechanisms—tolling.
The revolution in tolling is spreading. First came the electronic toll systems that made it possible to travel on toll roads without stopping at toll booths. Then came the high-occupancy/toll (HOT) lanes that allowed drivers—for a price—to take advantage of the free-flowing traffic in the carpool lanes that line many of the freeways in congested metropolitan areas. These two examples are just the tip of the iceberg when it comes to the different ways new communication and information technologies can be used to better manage transportation demand and raise additional revenue.
What makes these new technologies so powerful is the ability to vary the charge for driving based on the type of roadway and the time of day. Variable pricing allows for value pricing—charging the customer based on how much he or she values the service, instead of based on the cost to provide the service. Value pricing can be used to give the customer options such as paying more for faster travel. Value pricing can also be used to manage capacity, reducing demand for expensive projects that add new lanes.
Figure 2: express lanes and hoV lanes in the united states
Miles of HOt/Express lanes in the United States are rapidly expanding; under federal law, existing HOV lanes are now eligible to be converted to HOt lanes.
Under certain conditions, value pricing has the potential to generate revenue signifi-cantly higher than what is needed to build, operate, and manage the transportation facility. It is possible that revenue from value pricing could fund general transportation needs and a range of other benefits.
Connections between Land Use and How to Pay for Roads
Transportation and land use are inextricably linked. The old joke about real estate—“the first three rules of real estate are location, location, location”—is a reflection of the real-ity that the value of a parcel of land is largely determined by its abilreal-ity to connect with other desirable parcels of land. Exceptions to this rule are few and far between. Land value is affected by decisions the public sector makes about transportation investments. If the government decides to build a new high-speed road from the urban edge to outlying areas, for example, the land served by the roadway gains value be-cause it is closer—in terms of travel time—to desirable locations.
AK
TX
HI OK CO
NM AZ
CA
AR
KS MO
UT NV
OR WA
ID
MT
WY
ND
SD
NE IA
MN
WI
IL
MI MI
LA
MS AL
FL GA TN KY IN
OH
SC NC
VA WV
PA NY
ME VT
NH MA
CTRI
NJ DE MD
●
Existing HOT/Express Lanes 294 corridor-miles●
Under Construction HOT/Express Lanes 163 corridor-miles●
Existing HOV Lanes 722 corridor-milestoll rate for passenger cars with electronic pass
road (cents/mile) Indiana East–West Toll Road 3.0
Dallas North Tollway 4.0
Kansas Turnpike 4.0
New York State Thruway 4.5 Turner Turnpike, OK 4.5
Ohio Turnpike 4.5
Garden State Parkway, NJ 5.0 Illinois Tollway 6.0 Massachusetts Turnpike 6.0 Florida Turnpike 6.5
Maine Turnpike 7.0
Pennsylvania Turnpike 8.0 Blue Star Turnpike, NH 9.0 New Jersey Turnpike 11.5 Triangle Parkway, NC 15.0 State Highway 130, TX 15.0 Dulles Toll Road, VA 20.0* Intercounty Connector, MD 25.0* E-470 Express Toll Lanes, CO 26.0 Dulles Greenway, VA 34.0* Delaware Turnpike 36.0
Chicago Skyway 45.0
Figure 3: the range oF tolls For roads and Bridges
tolls Charged on Highways, Bridges, and tunnels in the United States Vary Greatly
toll rate for passenger
Bridge/tunnel cars with electronic pass
california
San Francisco Golden Gate Bridge $5.00*
Bay Area: Antioch Bridge, Benicia-Martinez Bridge, Carquinez Bridge $5.00* Dumbarton Bridge, Richmond-San Rafael Bridge, and San Mateo–Hayward Bridge $5.00
San Francisco–Oakland Bay Bridge $6.00
delaware–new Jersey
Delaware Memorial Bridge $4.00*
Florida
Sunshine Skyway $1.25
illinois–indiana
Wabash Memorial Bridge $0.50
louisiana
Lake Pontchartrain Bridge $3.00*
Massachuetts
Ted Williams Tunnel $3.50*
Maryland
Baltimore Harbor Tunnel, Francis Scott Key Bridge, Fort Mchenry Tunnel $3.00
Chesapeake Bay Bridge $4.00*
new Jersey–pennsylvania
Delaware River Joint Toll Bridge Commission $1.00 new york
Marine Parkway–Gil Hodges Memorial Bridge and Cross Bay Veterans Memorial Bridge $1.80 Bronx–Whitestone Bridge, Triborough (RFK) Bridge, Throgs Neck Bridge,
Queens–Midtown Tunnel, Brooklyn-Battery Tunnel $4.80
Henry Hudson Bridge $2.20
Verrazano-Narrows Bridge $9.60*
Lincoln Tunnel, Holland Tunnel, George Washington Bridge, Bayonne Bridge,
Goethals Bridge, Outerbridge Crossing $10.25*
Virginia
Chesapeake Bay Bridge-Tunnel $12.00**
Washington
State Route 520, Seattle $3.59 peak
* Toll charged for travel in one direction only. ** $5.00 return within 24 hours.
Source: ULI survey of bridge and toll authority websites, November 2012.
toll rate for passenger cars with electronic pass
road (cents/mile)
* Peak Rate.
But land value is also influencedby decisions the public sector makes about how to pay for transportation investments.
Imagine two scenarios for paying for a new high-speed road from a central city to outlying areas, in a simplified world made up of a metropolis with a growing population and economy. In the “free road” scenario, the government uses general revenues to fund construction of this new high-speed road and allows users to drive on it for free. In the “toll road” scenario, the government uses tolling to finance road construction and charges a toll to use this new high-speed road. It’s the same road, but the govern-ment uses two different approaches to pay for it.
Free Road and Land Use
In the short run, land served by the free road will be more desirable—more valuable— than land served by the toll road. But there is a limit to the desirability of land in the free road scenario, because the free road will experience congestion much sooner than the toll road. Once congestion sets in on the free road, the value of the land stag-nates or even declines, because at peak demand the land served by the free road is no longer as close—in terms of travel time—to desirable locations.
The road managers, authorized by the government to look after the road, have only a limited range of responses to congestion on the free road. They can add capacity by building new lanes, but to do this means convincing government decision makers that an investment in new lanes is a higher priority than other uses of general tax revenue. The road managers can try to reduce demand for space on the road by encouraging carpooling or taking mass transit. They can even give incentives to carpoolers and bus users by designating a special lane just for them. And there are some traffic manage-ment technologies that can offer marginal relief.
But if the congestion is severe enough, these measures are only bandages—espe-cially if the buses are still stuck in congestion—on the real problem, which is that the road managers seemed to have promised that this land would be, for example, 20 minutes from desirable locations and now it is 40 minutes from them. Even if new lanes are added, if the travel behavior and land development response is strong enough, congestion will eventually return.
In addition, the road managers have an incentive to protest additional land develop-ment near the highway. They will express worries about land developdevelop-ment’s “traffic impact.” People regularly stuck in the congestion will join the road managers in pro-testing additional land development. In the very long run, if the road gets congested enough, the land uses begin to move—creating new desirable locations—so that they can be closer to each other, in terms of travel time, if not distance.
Toll Road and Land Use
In the toll road scenario, land development will be slower initially. People will take into consideration the cost of the tolls when making decisions about whether to move out-ward. At first, the road managers have an incentive to keep tolls low to attract users. The government may even find it advantageous to offer subsidies to land develop-ment in order to induce use of its toll road.
Once congestion sets in, however, it is a whole new ball game. The road managers can now vary the tolls to manage traffic levels, charging more for peak times of the day
high relationship to driVing
loW relationship to driVing
Figure 4: reVenue MechanisMs and their
relationship to Motor Vehicle traVel
or for free-flowing lanes. To meet policy objectives, the road managers can set tolls to maximize revenue, speed, or the volume of vehicle flow. The road managers can even offer cross-subsidies, dropping toll rates during uncongested times. Because the toll road managers gain revenue from congestion, they will be slower to respond with new capacity investments. They are also less likely to protest additional land development. (Since additional land development leads to higher tolls, once road users catch on to how the system works, they will still probably protest land develop-ment.) For those who can afford the tolls, a reliable, fast road is waiting for them. One road, two different ways of paying for it, two very different land use futures.
From Free Roads to
Tolled Roads
The American tradition of paying for roads with the revenue from taxes on motor fuels is like the “free road” sce-nario. Despite a long history within the transportation policy community of referring to taxes on motor fuels as “user fees,” from the land use perspective, these taxes have functioned more like paying for transportation infrastructure from general revenue sources.
American taxes on motor fuels are, and have been historically, too low to be given much weight when land use decisions are made. Taxes on motor fuels, moreover, by their very nature are split between taxing fuel efficiency (or rather, inefficiency) and miles driven. As excise taxes collected from suppliers, they are also hidden. Few drivers understand how much in taxes they are paying per mile. Also, taxes on motor fuels are not affiliated with specific transportation investments. For example, even if you rarely drive on the Interstate Highway System or on other federal-aid highways, you still pay the federal tax every time you purchase a gallon of fuel.
In essence, government policy—at both the federal and state levels—has kept the tax burden on passenger vehicle trips so low and so hidden that these taxes are func-tionally irrelevant to decisions about driving. When travelers choose whether to drive and to which destinations, variables such as travel time, parking costs, and fuel costs are much more important than taxes on motor fuels. Of course, the “entry fee” to this government-sponsored transportation network is access to a motor vehicle.
Although policy in the United States has been to keep taxes on driving extremely low, there are many who argue that charging too little has its own negative conse-quences. These critics point to a long list of costs associated with driving: air pol-lution, vehicle injuries and fatalities, dependence on foreign sources of oil, and the overdevelopment of land that could be reserved for agriculture or natural systems. If revenues raised from taxes on motor fuels covered these external costs of driving, estimates indicate that the tax rate would need to increase to as much as $2.00—or more—per gallon. Most developed countries go even further and have chosen to tax driving as a way to raise general revenues that fund more than their transporta-tion systems. In Spain, France, Germany, and the United Kingdom, which assess both an excise tax and a value-added tax on motor fuels, taxes on gasoline range from $3.30 to $4.70 per gallon.
Figure 5: reVieW oF transportation reVenue MechanisMs
road user charge: A generic term that includes a range of mechanisms used to collect revenues from travelers according to their use of roadways. Although what is included in the category “road user charge” can vary, its broadest definition encompasses vehicle registration charges, vehicle weight charges, taxes on motor fuels, miles-traveled charges, and tolls. Road user charges may be taxes or fees.
tyPES OF rOaD USEr CHarGES
tax: A mechanism that governments use to raise revenue. Even if part or all of the revenue stream is dedicated to specific purposes, if the revenue source can be used for general purposes, the charge is still a tax.
Fee: A mechanism that governments use to raise revenue that can be used only for specific purposes and that is typically tied directly to the cost of providing the service for which the fee is charged. Many states have strict restrictions on the use of revenues generated via fees. These restrictions can have the effect of limiting the amount that can be charged via a fee.
excise tax on motor fuels: A tax collected from suppliers of gasoline, diesel, and other fuels that power motor vehicles. The tax is charged per unit sold (i.e., per gallon) and in its current form does not vary according to the price of fuel. The federal government and all 50 states and the District of Columbia levy excise taxes on motor fuels. Some states also charge sales taxes on motor fuels, paid directly by the consumer.
Vehicle-miles traveled (VMt) tax: A tax collected from owners of motor vehicles and calculated per mile driven. In accordance with the legal context, a government may be able to vary the VMT tax according to region, time of day, road type, or other criteria established by the government.
Mileage-based user fee: A fee collected from owners of motor vehicles and calculated per mile driven. It could also be called a VMT fee. In accordance with the legal context, a
government may be able to vary the per-mile fee according to region, time of day, road type, or other criteria established by the government. Because it is a fee, there would be restrictions on the use of the revenue based on the applicable legal context in the state.
tolled roadway: A segment of roadway where the owner or operator charges a toll—a fee or tax—for access (e.g., crossing a bridge) or per mile of travel. Tolls may be set according to cost pricing, value pricing, or some combination, or tolling levels may be set according to other objectives, usually decided in the political arena.
tyPES OF PrICInG FOr tOllS
cost pricing: A way of setting the price for transportation based on covering the costs of building, maintaining, and operating a facility or network. A flat charge to access a tolled roadway set at a level designed to pay back construction bonds over a number of years is an example of cost pricing. Cost pricing may also include indirect costs such as the cost of motor vehicle crashes or air pollution.
Value pricing: A way of setting the price for transportation based on what the traveler thinks it is worth and is willing to pay, rather than based on the cost to provide it. Value pricing can be used to set a price for free-flowing travel, but can also be used to set a price for other travel amenities such as truck-free (or car-free) lanes, express lanes that bypass local traffic, lanes for extreme speeds (above 75 mph), queue-jumping, and even pavement quality.
congestion pricing: A type of value pricing that sets the price for road travel to reduce congestion or to maintain free-flowing conditions. Congestion pricing is usually variable: the price changes as demand rises and falls over the course of the day. Congestion pricing may also be dynamic: the price may change in real time as sensors monitor traffic levels. The most common use of congestion pricing in the United States is to provide free-flowing lanes on congested segments of urban highways. See managed lane.
tyPES OF ManaGED lanES
Managed lane: A lane of a roadway is called “managed” if it is proactively operated to achieve an objective, usually free-flowing conditions. According to the U.S. Federal Highway Administration, there are three main ways to manage a lane:
• use pricing;
• limit eligible vehicles (allowing, for example, only carpool vehicles and electric hybrids); and
• limit access to interchanges or intersections (e.g., traditional express lanes that bypass local exits).
The most common use of managed lanes in the United States is on congested segments of urban highways.
high-occupancy vehicle (hoV) lane: A lane designated for the exclusive use of vehicles meet-ing minimum occupancy standards, usually two but sometimes three persons per vehicle.
high-occupancy/toll (hot) lane: A lane designated for high-occupancy vehicles that charges a toll to vehicles not meeting the minimum occupancy standard.
Federal transportation leaders in the United States are in the midst of rethinking a long history of anti–toll road policies. For decades, federal dollars could not be used to fund or otherwise support toll roads, and the federal government imposed penalties if state governments wanted to use tolling to reconstruct or expand roads built with federal aid. Only in recent years has federal policy begun to tentatively support tolling through small pilot programs allowing experiments with HOT lanes and through the Transportation Infrastruc-ture Finance and Innovation Act (TIFIA) loan and loan guarantee program.
While the threat of federal penalties still dissuades states from attempting to convert existing federal-aid highways to toll roads, the most recent federal transportation law, MAP-21, opens the door a little wider for expanded tolling.
MAP-21, signed into law in July 2012, enables states to toll new capacity on the Interstate Highway System and other federal-aid highways. (States have always retained the authority to build and maintain toll roads constructed without fed-eral funds.) The law also allows states to convert all existing high-occupancy vehicle (HOV) lanes to HOT lanes. Toll revenue must be used first for the facility itself. Only after the responsible public official “certifies” that the facility is being ad-equately maintained may the revenues be used for other transportation purposes. This certification must be done annually. Private sector partners, however, are allowed to earn a “reasonable return on investment.”
MAP-21’s endorsement of converting HOV lanes to HOT lanes builds on two pilot programs dating to the mid-2000s. The U.S. Department of Trans-portation (USDOT) Urban Partnership Program used discretionary grant funding and a competi-tive application process to fund congestion-relief projects that exemplified “the four Ts”: tolling, transit, telecommuting, and technology. Among the projects funded are the following:
• Miami’s I-95 express lanes (see case study, page 20);
• Minneapolis’s I-35 West dynamically priced HOT lanes, including six new park-and-ride facilities and express bus service; and
• Seattle’s State Route 520 variably priced toll bridge over Lake Washington, including bus service enhancements.
The USDOT’s Congestion Reduction Demonstration Program funded two additional projects converting HOV lanes to HOT lanes:
• Los Angeles’s I-10 and I-110 dynamically priced HOT lanes, including improvements for bus rapid transit routes; and
• Atlanta’s I-85 dynamically priced HOT lanes, includ-ing bus transit improvements.
MAP-21 also dramatically expanded the TIFIA loan and loan guarantee program. What had been a small, experimental program (just $122 million an-nually) rises to $750 million in fiscal year 2013 and then to $1 billion in 2014. Toll revenue can be used to secure TIFIA support, and the majority of “letters of interest” submitted to the USDOT to date request support for toll road projects.
U.S. FEDEral tranSPOrtatIOn POlICy anD tOllInG
COUR TESY OF A NDREW T UCKER
COUR
TESY
OF
A
NDREW
T
UCKER
Bus riders descend from 46th Street to the I-35 West HOt lanes for express bus service. the HOt lanes project, pictured above and left, was funded under the USDOt’s Urban Partnership Program.
Tolling, with and without value pricing, and taxes or fees charged per mile will influ-ence land use decisions much more directly than taxes on motor fuels. Compared with taxing motor fuels, tolling (and charges per mile can be thought of as a toll on all roads) falls much more heavily on decisions people make about locations: where to live, where to work, where to shop, where to go to school, where to get health services, where to get supplies for a business, and so on. In effect, tolls are a charge paid by users of a specific piece of ground—a length of road—at a specific time. Another way to think of tolling is as a charge for accessing destinations.
Compared with motor fuel taxes, tolling has different psychological as well as economic impacts on driving and therefore land use. Tolls are not hidden. Moving to a system of tolls or charges per mile has the potential to raise awareness of the cost of driving and reveal the true value of specific transportation services such as high-speed express-ways or free-flowing lanes. Theoretically, the economic impact combines with the psy-chological impact to induce an even stronger land use response.
Conclusion
Tolling and charging per mile—transportation revenue mechanisms expanding or un-der serious consiun-deration in the United States—have a much stronger link to land use than taxes on motor fuels and other revenue mechanisms such as sales taxes and in-come taxes. Now is the time to include land use and the effects on land use decision making in research, policy discussions, and political debates around how revenue is raised from transportation.
To raise awareness of these coming changes and to frame the issues for further re-search and development, the ULI Infrastructure Initiative constructed and conducted an in-depth thought experiment for leaders in transportation and land use from across the United States. Through workshops and interviews, study participants explored and analyzed the interactions between land use and congestion pricing, tolling, and VMT taxes. Participants also discussed the potential for these transportation and land use interactions to have impacts on lower-income groups. The results of the ULI Infra-structure Initiative thought experiment are discussed in Part 2.
COUR
TESY
OF
THE
S
AN
D
IEGO
A
SSOCIA
TION
OF
G
OVERNMENTS
(SANDAG)
the rancho Bernardo direct access ramps and transit station give toll payers, carpoolers, and bus riders access to congestion-free lanes on I-15 in San Diego.
Part 2:
Land Use and Tolls, VMT Taxes,
and Congestion Pricing
Concerned that there seemed to be little discussion going on in policy and imple-mentation circles about how the renewed emphasis on tolling and the spread of value pricing will interact with land use in the United States, the ULI Infrastructure Initia-tive undertook a research effort into the land use impacts of tolling, VMT taxes, and congestion pricing. ULI convened and interviewed a group of transportation and land use experts and asked them to consider how these revenue mechanisms might affect metropolitan development and land use decision making over the next 20 years. Study participants explored and refined five scenarios that illustrated the interactions be-tween transportation revenue mechanisms and land use. Two scenarios probed different ways of implementing value pricing on managed lanes. Three scenarios examined the land use impacts of increasing taxes on motor fuels, charging for every mile driven, and converting the Interstate Highway System to toll roads. The ULI Infrastructure Initiative analyzed the discussions and produced qualitative descriptions of potential impacts.
Figure 6: Quick suMMary oF the thought experiMent scenarios
tWO SCEnarIOS: ValUE PrICInG On ManaGED lanES
1. Bus toll lanes 2. optional toll lanes
tHrEE SCEnarIOS: InCrEaSED tax ratES anD tOllS
3. increased federal tax rates for motor fuels 4. Federal tax on all vehicle-miles traveled 5. toll the Interstate Highway System
Study participants converged on a set of conclusions about the scenarios and their land use impacts.
General:
• The impacts of the scenarios’ transportation revenue mechanisms on land use will be real, but modest, and will unfold over the long term. • The cost of driving will become more important in decisions about land
use and where to locate businesses, residences, and services. • The impacts on land use will vary greatly by metropolitan region and
will be influenced by the existing transportation network, including mass transit services, as well as by current land use patterns, local land use policies, and future regional economic trends.
• Value pricing on managed lanes, increased taxes on motor fuels, VMT taxes, and the spread of toll roads have the potential to interact with land use in ways that support growing market preferences for development in compact, mixed-use, walkable districts and neighborhoods.
• Absent careful coordination with land use policies and other transporta-tion services, however, the potential to support the growing market prefer-ence for compact, walkable development is unlikely to be fully realized. Value Pricing on Managed Lanes:
• Managed lanes incorporating value pricing offer potential benefits for land development.
• Crucial policy decisions about how value pricing is implemented—including policy decisions about toll levels, toll discounts for multi-occupant
vehicles, coordination with transit service, and use of any excess revenue—will determine how broadly U.S. communities benefit from value pricing and managed lanes.
Expanded Tax/Toll Scenarios:
• Scenarios that increase the cost of driving provide incentives for development in compact, mixed-use, walkable nodes.
• Taxes on vehicle-miles traveled will affect more land use decisions and interact more strongly with land use than equivalent taxes on motor fuels or the expanded use of tolling.
• Scenarios that increase the cost of driving without also taking into consideration how to expand the transportation and land use benefits broadly among income groups have the potential to have a disproportionate impact on lower-income groups, especially lower-income groups dependent on driving.
Introduction to the ULI Thought Experiment
There is little empirical research—hard data—on the land use impacts of tolling, man-aged lanes, and VMT taxes. Shifts in American driving behavior, moreover, raise ques-tions about whether it is appropriate to apply past research to present circumstances. Research on American driving behavior going back decades once led to the conclusion that driving is economically inelastic: Americans drove more and more, regardless of rates charged for tolls, taxes, and fees. But American driving behavior is changing. In a phenomenon the Economist has dubbed “peak car,” total driving in wealthy nations including the United States has plateaued and for certain age groups is declining. Early evidence also suggests that driving behavior may be becoming much more price sensitive than backward-looking data would suggest. It is time to reconsider the assumption that tolls, taxes, and fees on driving will have little impact on land use in the United States.
In addition, Americans have limited experience with implementing these revenue mechanisms, let alone analyzing how they interact with land use. Many regions in the United States are unfamiliar with toll roads. In those places with toll roads and bridges, toll prices have only recently started to rise to heights that might affect trip-making decisions. State departments of transportation have conducted only a handful of experiments with charging per mile. Most of these studies set out to test the technol-ogy, although they also may include some analysis of how people responded to being charged per mile. Value pricing to preserve free-flowing traffic is also very new. The expanded use of tolling and congestion pricing brings with it the ability to build new capacity and provide new amenities, but also new uncertainties for land development. The ULI Infrastructure
Initiative convened discussions of the revenue mechanisms and possible implementation scenarios, including increased tax rates, for analysis purposes only. The inclusion of revenue mechanisms in this study does not imply endorsement.
a SIMPlE MODEl
lanD USE
lanD USE
tranSPOrtatIOn
tranSPOrtatIOn
Figure 7: transportation and land use: tWo Models
a MOrE COMPlEx MODEl
LAnd USE
MarkEt PrEFErEnCES anD
DEMOGraPHIC trEnDS
COStS FOr DEVElOPMEnt,
FInanCE, anD
COnStrUCtIOn
PUBlIC SECtOr aCtIVItIES:
InFraStrUCtUrE InClUDInG
tranSPOrtatIOn
, taxES/
SUBSIDIES, anD rEGUlatIOnS
Confronted with the lack of hard data and the realization that even past empirical stud-ies may have limited utility going forward, the ULI Infrastructure Initiative convened a group of experts to examine the land use impacts of congestion pricing, tolling, and taxing VMT. ULI held invitation-only workshops in San Francisco and Washing-ton, D.C., and conducted interviews in June and July 2012, creating a conversation between transportation and land use experts. Transportation experts, including those with backgrounds in engineering, planning, economics, and policy and representing research institutes, state departments of transportation, and engineering firms, dis-cussed the coming transportation changes and challenges with developers, investors, land use planners, and experts in land use policy and real estate economics.
Focusing on changes to land use, the experts explored and analyzed three scenarios imagining the adoption of one of three transportation revenue mechanisms: increased taxes on motor fuels, tolling the Interstate Highway System, and taxes on vehicle-miles traveled. Study participants also discussed using value pricing to manage congestion on expressways and developed two separate scenarios that reflect different policy choices and their outcomes. Collectively, the experts indicated the types of potential impacts on land use and commented on the impacts’ likely magnitude. They also considered how the scenarios and their land use impacts would affect lower-income groups.
From these discussions, the ULI Infrastructure Initiative developed qualitative de-scriptions of the interactions between the revenue mechanisms and land develop-ment, which are outlined in the sections below. For purposes of clarity, the presen-tation simplifies land use decisions, focusing only on the interactions between the transportation mechanism itself and land use. In real-world situations, a multitude of factors affects each land use decision. In any given land use decision, factors other than transportation are likely to be equally important as or more important than the cost of transportation taxes, travel time to destinations, or the availability of transpor-tation alternatives (see Figure 7).
Mechanisms Will Have Real, but Modest, Impacts
A consensus arose among workshop participants and interviewees that the transpor-tation revenue mechanisms under consideration will interact with land use. Robust discussions about the direction of change for specific land uses (i.e., attract versus repel, encourage versus discourage, accelerate versus inhibit) also occurred. Study participants, however, expressed much more uncertainty and much less agreement about the magnitude of the impacts. Behavioral research to date is not complete enough to lead to confident predictions. The magnitude of the impacts, moreover, will depend on local factors, including the availability of transportation alternatives and substitute destinations. People will also respond differently—make different land use choices—depending on other variables, including income levels, stage of life, and type of business or employment.
Workshop participants and interviewees predicted that—as a general proposition— tolling, congestion pricing, and taxing VMT will have real, but modest, impacts on met-ropolitan land use. In other words, if the use of tolling, congestion pricing, and/or VMT taxes is expanded, 20 years from now U.S. metropolitan landscapes will look different. The changes, however, are more likely to be subtle, rather than dramatic. If dramatic changes do occur, they are the most likely to take place along specific corridors or within areas of concentrated development.
Figure 8: suMMary oF the FiVe scenarios and their iMpacts
land Use Impacts of transportation revenue Mechanisms: real, but ModesttWO SCEnarIOS: ValUE PrICInG On ManaGED lanES
1. Bus toll lanes
• The network of lanes is part of the rapid transit system.
• Highest priorities are keeping transit users moving and providing a reliable travel time to all paying users. • Excess revenue is used for transit
service and to improve infrastructure at destinations.
land use
Help meet demand for and foster development in compact, mixed-use, walkable nodes.
2. optional toll lanes
• Toll lanes bypass existing congested bottlenecks.
• Highest priority may be speed, revenue, or reliability and is decided on a case-by-case basis.
• Excess revenue is used for highways elsewhere in the region and state.
land use
Likely to support sprawl.
Land Use Impacts Are Long-Term Impacts
ULI asked study participants to consider impacts five years and 20 years after the implementation of each transportation revenue mechanism, because shifts in land use reveal themselves over the long term.
When faced with increases in the cost of driving, people adapt in the near term by making different choices in transportation and then in other areas of discretionary spending. For example, a two-car family may start driving the fuel-sipper more often than the gas-guzzler, or families may shift resources from the dining-out budget to cover the increased cost of commuting.
tHrEE SCEnarIOS: InCrEaSED tax ratES anD tOllS
revenue mechanism land use
Baseline: No expansion of revenue mechanisms
Existing conditions continue, providing no encouragement of market trends for development in compact, mixed-use, walkable nodes.
3. increased federal tax rates for motor fuels
Encourage current market trends for compact, walkable development.
4. Federal tax on all
vehicle-miles traveled Accelerate development in compact, walkable nodes
5. toll the interstate highway system Interactions with land use depend on local and metropolitan factors.
Land use impacts appear incrementally, as certain locations become more (or less) attractive. In a process that plays out over decades, opportunities begin to appear for expanding development in favored locations. New building types and site development innovations, better adapted to the new transportation pricing regime, eventually take hold and spread. But the obsolescence of less favored locations and outdated building types can be painful for their host communities. Study participants analyzed two types of long-term land use impacts:
Changes in trip making affect land use. For this kind of impact, tax/toll hikes or new value-priced amenities lead to adjustments in the transportation arena, some of which lead to people making different choices about destinations. These land use impacts are related to changes in trip-making patterns, which are most likely to affect patterns for patronizing shopping and service locations. These changes may happen quickly or slowly, and they have the potential to permanently alter land use patterns.
I-95 ExPrESS lanES
Miami’s first HOT lanes opened in December 2008. The Florida Department of Transportation (FDOT) took the lead on this joint highway/transit project that has significantly improved the travel experience for com-muters, business travelers, and transit users. FDOT took an “all hands on deck” approach to speed up vehicle movement along 7.3 miles of I-95 north of downtown Miami. On a stretch of highway where even the carpool lane regularly slowed to a crawl, FDOT narrowed travel lanes and used a bit of the shoulder to add a second HOV lane. In addition to an increase in the HOV occupancy minimum from two to three, the project added a toll option giving all passenger ve-hicles and light trucks the opportunity to travel in the HOV lanes. Dynamic pricing manages demand in the tolled lanes to keep traffic moving above 45 miles per hour, a target that the express lanes have been able to
maintain 95 percent of the time. They also introduced ramp metering to interchanges.
“The goal is to keep traffic in the
express lanes moving at a minimum
speed of 45 mph while maximizing
person throughput of the entire facility.”
—FDOT,
95 Express Annual Report
, February 2012
Improvements to transit service and park-and-ride fa-cilities were coordinated with the highway investments. Four new express bus routes, departing as frequently as every 15 minutes during peak commute times, con-nect communities in the corridor to downtown Miami. There is also weekend bus service. Bus ridership has increased 145 percent since the express lanes opened;
BrOWarD anD MIaMI-DaDE COUntIES, FlOrIDa
Variable pricing Free to hoVs coordinated with bus service heavy trucks (more than two axles) electronic toll collection
peak charge per mile (approximate for passenger vehicles)
Dynamic pricing according to demand
HOV-3+ Yes No Yes $0.41 southbound and $0.62 northbound average peak with $0.95 maximum
General increases in the cost of driving, for example, encourage behavior changes such as:
• Walking to neighborhood restaurants instead of driving to dine across town.
• Shopping online instead of making trips to the regional mall. • Substituting conference calls for in-person meetings.
• Consolidating retail trips—for example, making one trip instead of three to the grocery store in a week. This, in turn, reduces the opportunity to impulse-shop.
Amenities or increases in the cost of driving that are route-specific encourage, for example:
• Choosing to reroute a commute home to avoid a toll road, and as a consequence patronizing a different grocery store and gas station along the new route.
I-95 ExPrESS lanES
during peak periods, express bus riders account for 18 percent of express lane travelers. In FDOT surveys of transit users, 53 percent of new riders said the express lanes influenced their decision to take transit and 38 percent reported they formerly drove.
The speed and reliability of the express lanes have also attracted business users who travel the lanes through-out the day. Business travel represents 57 percent of managed-lane use, with these noncommuters coming from a diverse set of industries including health care, legal services, management, and construction. Phase II of the I-95 express lanes project, scheduled to open in 2014, will expand the HOT lanes nearly 14 miles north into Fort Lauderdale, Florida.
Funding for the highway and transit capital improve-ments ($132 million for Phase I; $106.1 million for Phase II) came from a combination of federal, state, and local sources. Toll revenues are designated to facilities opera-tions first, with 20 percent of revenue going to express bus operations. Revenues exceeded projections by 15 percent in the first full year of operations.
The success of the I-95 express lanes is building en-thusiasm for expanding the HOT lane network through-out the region. Construction of a reversible HOT lane with bus service is underway on I-595, and plans call for expanding the toll lanes, express bus service, and park-and-ride facilities to other expressways.
SOUTH
F
LORIDA
C
OMMUTER
S
ERVICES
SOUTH
F
LORIDA
C
OMMUTER
S
ERVICES
• Choosing to reroute a commute home to take advantage of a toll road, giving up the trip-chaining along “big-box row” and instead running errands closer to home during the evening and on weekends. • Taking advantage of the reliability provided by new value-priced
managed lanes to use a daycare close to home instead of close to work.
The cost of driving influences major decisions about locations. Here, land use changes begin to accumulate as people make major decisions involving locations such as buying a new house, expanding a business, or looking for a new job. The new transportation pricing mechanisms will be taken into consideration, and it can be expected that people will give more weight to the costs of accessing different loca-tions, the risks of sudden price changes, and the transportation alternatives available. Land developers and investors will explore whether including these same factors in their business models gives them a competitive advantage.
Metropolitan Development Trends
ULI focused the study of the land use impacts of transportation revenue mechanisms on metropolitan areas (with populations exceeding 50,000) and metropolitan develop-ment patterns for housing, office, retail, and industrial uses. Tolling, congestion pricing, and taxing VMT will also interact with rural land uses and affect patterns of intercity travel, including mode choice, in ways that have implications for airports, rail and bus stations, and intermodal freight facilities. The impacts on rural areas and implications for intercity travel, while not the focus of this study, deserve additional analysis. Land use experts participating in the study noted that analysis of the land use impacts of transportation revenue mechanisms builds on an understanding of existing land use pat-terns and future trends for land development. Tolling, taxing VMT, and congestion pricing are most likely to have the biggest impact on new development because developers and investors can respond directly to the amenities and price signals that the transportation revenue mechanisms provide. Therefore, understanding the trend for new development is key to understanding how transportation revenue mechanisms will affect land use.
Figure 9: trends For Four types oF Metropolitan deVelopMent
Metropolitan development type today’s generalized trend*New development in compact, mixed-use, walkable nodes
Growing investment attractiveness New development in sprawling,
single-use areas Stable or declining investment attractiveness Existing development in compact,
mixed-use, walkable nodes Growing or stable investment attractiveness Existing development in sprawling,
single-use areas
Stable or declining investment attractiveness
* These trends are very generalized and should not be taken to represent the future prospects of any specific development site or proposal.
Most land use experts consulted for this study agreed that land use preferences in the United States are shifting. They foresee the largest increases in growth for new devel-opment located in compact, mixed-use, walkable nodes or activity centers. The sprawl-ing, single-use districts for houssprawl-ing, office, and retail uses that dominated development over the past 50 years won’t disappear, of course. But going forward, more new de-velopment will be built in compact, mixed-use, walkable nodes than past trends would indicate, and less new development will be built in sprawling, single-use districts. ULI found four broad types of metropolitan development potentially affected by toll-ing, taxing VMT, and congestion pricing. Figure 9 summarizes the four and indicates today’s development trends.
Two Scenarios: Value Pricing on Managed Lanes
For the value-pricing scenarios, ULI asked study participants to analyze how a net-work of reliable, high-speed expressway lanes managed with the use of value pric-ing will interact with land use and affect metropolitan areas. For study purposes, it was assumed that the value-priced lanes were either converted from existing lanes (such as an HOV to HOT lane conversion) or added as tolled lanes to the existing “free” expressway network, so that free lanes and pay lanes run parallel to each other throughout the network.
Study participants discussed the various ways in which managed lanes can oper-ate, including the amenities that value pricing may offer to nearby land uses and how policy decisions about the operation of managed lanes interact with land use. Out of these discussions arose two very different alternative futures, which ULI packaged into the two scenarios presented below. The two managed-lane scenarios—in their approach to planning, operation, management, and use of revenues—are extremes illustrating opposite ends of a spectrum.
Value-Priced Lanes Offer Amenities for Development
Using pricing to create a network of free-flowing, reliable lanes offering expressway speeds 24 hours a day makes experiencing highway congestion a choice. Instead of congestion being something that just happens to a road user, drivers choose whether to sit in traffic or to pay to speed past it.
From a land use perspective, a network of value-priced expressway lanes offers two types of amenity values: speed/time-savings and reliability. Frequent users are more likely to be valuing the speed/time-savings and will be attracted to locations near man-aged lanes because, for example, manman-aged lanes
• allow their business to make more service calls in a day; and
• allow them to live further away from potential job locations and still make the commute in less than 30 minutes.
Occasional users are more likely to be valuing the reliability. The existence of the managed lanes provides peace of mind for those times when a trip really needs to go smoothly. For both those willing—and able—to pay for frequent use and those only willing—or able—to pay for occasional use, the network of managed lanes increases mobility.
All other factors being equal, locations with easy access to the value-priced lane network will have a competitive advantage. As people make decisions about home, work, and business locations, areas accessible to managed lanes will attract those
Source: CH2M HILL, based on Transportation Research Board, Highway Capacity Manual 2010, and National Cooperative
Highway Research Program 3-96.
Figure 10: the relationships aMong speed, FloW, and price
For value-priced lanes, meeting targets for speed, reliability, and revenues requires setting toll rates to achieve desired vehicle flows.
Flow Rate (passenger cars per hour per lane)
Low Risk of Congestion
Medium Risk of Congestion
High Risk of Congestion75 miles per hour free-flow speed
80 — 70 — 60 — 50 — 40 — 30 — 20 — 10 — 0 —
Speed (miles per hour)
$$$
$$
$
0 500 1,000 1,500 2,000 2,500
—
—
—
—
—
—
stop-and-go congestion
a
B
c
A. Buffer-Separated Managed Lane (single lane)
B. Barrier-Separated Managed Lane (1 to 2 lanes)
C. Toll Road (3 to 5 lanes)