*Corresponding author.
Present address: School of Chemistry, UNSW Sydney, Sydney, New South Wales 2052, Australia email: [email protected]
Cavity Ring-down UV spectroscopy
of the C
2Σ
+-X
2Π electronic transition of CH
Chris Medcraft
1*, Harold Linnartz
2, Wim Ubachs
11
Department of Physics and Astronomy, LaserLaB, Vrije Universiteit
Amsterdam,
De Boelelaan 1081, NL-1081 HV Amsterdam, The Netherlands
2
Sackler Laboratory for Astrophysics, Leiden Observatory, Leiden University,
PO Box 9513, NL-2300 RA Leiden, the Netherlands
AbstractRotationally resolved spectra of the C2Σ+-X2Π electronic system of the CH radical were
measured using cavity ring-down spectroscopy in supersonically expanding, planar hydrocarbon plasma. The experimental conditions allowed the study of highly excited rotational levels starting from vibrationally excited states. Here we present some 200+ new or more accurately recorded transitions in the 0-0, 1-1 and 2-2 vibronic bands in the
ultraviolet between 30900-32400 cm-1 (324-309 nm). The resulting data, compared to earlier
measurements, allows for the determination of more precise molecular constants for each vibrational state and therefore more precise equilibrium values. From this an equilibrium
bond length of 1.115798(17) Å for the C2Σ+ state is determined. A comprehensive list with
observed transitions for each band has been compiled from all available experimental studies and constraints are placed on the predissociation lifetimes.
1. Introduction
The carbon hydride (CH) radical has a long history in molecular spectroscopy. First detected in the laboratory in 1919 [1], it was subsequently among the first positively identified extra-terrestrial molecules [2]. CH can be found in many physical and astrophysical environments; it is for example the cause of blue colour of hydrocarbon flames, where it acts as an important reaction intermediate. In space, the CH radical is found in cometary tails [3], stellar atmospheres [4], protostellar accretion disks [5], diffuse [6] and dense [7] interstellar clouds, as well in extra-galactic sources [8]. These sources span environments exhibiting a large range of thermodynamic properties. This has resulted in many transitions of CH being detected first in astronomical sources before their laboratory detection was established. The Λ-doublet transitions in the ground state were first detected using radio astronomy in 1973
[7]. Rotational constants for the ν=4 and ν=5 levels of the A2Δ state were derived for the first
time using spectra from carbon enhanced metal poor stars [4]. These spectra also showed
transitions of higher rotational quanta than were recorded in the laboratory for the B2Σ+- X2Π
and C2Σ+- X2Π band. Notably the A2Δ-X2Π transition contributes to the Fraunhofer G-band
that is used to study stars in a wide range of stellar types. Currently the most precise
molecular parameters for the ground X2Π electronic state use transitions observed in solar
absorption spectra recorded using the ACE-FTS instrument [9]. The optical absorptions of
CH, and other diatomics like C2 and CN can be used to classify carbon rich stars [10]
providing crucial information on the chemistry and radiation transfer in stellar atmospheres
Accurate laboratory spectroscopic information over the widest range of rotational and vibrational quanta is needed over all wavelength ranges for further constraining astronomical models and aiding observations [12]. The Λ-doubling in the ground state has been studied at ever growing accuracy by Bogey et al [13], by Brazier and Brown, [14] by McCarthy et al. [15] and ultimately by Truppe et al. [16,17] who measured transitions with an accuracy of 3 Hz. This accuracy, when combined with astronomical observations, can put limits on a
possible variation of fundamental constants for which the ground X2Π state is particularly
sensitive [18]. The work by Gerö [19] reported rotationally resolved spectra of the optical and
UV bands from the ground state to the A2Δ, B2Σ- and C2Σ+ states. The A-X bands were
studied further at higher precision by Brazier and Brown [14] and by Ubachs et al. [20]. The 0-0 vibronic band of the C-X transition was first studied by Heimer [21], then by Herzberg and Johns [22] who included measurements on the 1-1 and 2-2 bands. More precise
measurements on the C2Σ+-X2Π 0-0 band were made by Ubachs et al. [23] and an extended
line list of this band was produced by Bembenek et al. [24]. More precise observations of the 1-1 band were reported by Li and co-workers [25].
These existing data and line lists (i.e. overview of all observed and/or calculated transition
frequencies) for the lower electronic states of CH (X2Π, A2Δ, B2Σ- and C2Σ+) were critically
analysed and summarised by Masseron and co-workers [4] who combined data from many laboratory and astronomical sources to produce sets of self-consistent line lists and molecular constants for astronomical observations. We use their work as the basis for our
assignments and fitting of a large number of new transitions in the UV C2Σ+-X2Π electronic
band system. The vibrational levels of the X2Π ground state have been studied up to the v=5
level; here we fix the rotational constants for the X2Π state to those presented in Masseron
et al. [4] who primarily used data from Colin and Bernath [9]. In addition to the experimental
studies there are several high-level ab initio studies on the valence and Rydberg states [26–
28]. Theoretical work on the potential energy curves of CH have predicted that the C2Σ+state
interacts strongly with the yet unobserved 22Σ+ state [26,27].
2. Experimental
UV spectra of CH were recorded using pulsed cavity ring-down (CRD) spectroscopy [29]. The frequency-doubled output of a tuneable dye laser (SIRAH Cobra), running on DCM, was
used to produce UV pulses (≈0.08 cm-1 bandwidth) which were coupled to an optical cavity
with high reflectivity mirrors (R≈99.9%). Each pulse of light was confined within the cavity and the exponential decay of the ring-down was measured with a photomultiplier tube and oscilloscope. For a cavity length of 52 cm typical ring-down times amounted to 1.7 μs. This relatively short ring-down time was determined by the presently available quality of high reflectivity mirrors in the UV range. The red output of the dye laser was used to
simultaneously record etalon and iodine (I2) transmission spectra for calibration purposes to
achieve an absolute accuracy of each data point of ca. 0.02 cm-1.
The molecular radicals were produced in a plasma slit jet source that has been described in detail elsewhere [30,31]. Briefly, a high-pressure (≈6 bar) mixture of acetylene (≈0.3%) diluted in argon is pulsed into a vacuum chamber by a solenoid valve (General Valve, Series
9) mounted in front of the slit with ca.1 ms opening duration. A 1000 m3/hr roots blower
system keeps pressures below 0.1 mbar during jet operation. A high negative voltage (≈ -1000V) is discharged between electrodes isolated by ceramic spacers with slit openings of 3 cm × 500 μm. The discharge occurs over 300− 500 μs to create a planar plasma which dissociates the acetylene and facilitates molecule formation through collisions in the expanding plasma. This source has been shown to be capable of producing long chain
rotational temperatures as low as 15-25 K. Here we used this source to study the much lighter CH fragment, for which a less effective cooling is expected. Labview routines were used to guarantee that cavity ring-down and plasma pulse coincide and for data acquisition. The plasma jet was used at 10 Hz and typically 15 ring-down events were averaged to generate one data point.
3. Results
Figure 1: Schematic illustrating the six rovibronic bands of the C2Σ+-X2Π band of CH for the chosen
energy levels, e/f refer to electronic symmetry, +/- refer to total parity.
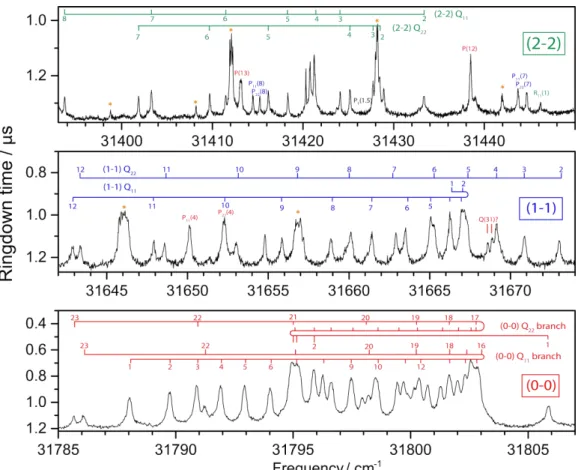
The C2Σ+-X2Π vibronic bands of CH are composed of six main rotational branches P11ee;
P22ff; Q11ef; Q22fe; R11ee and R22ff as shown in Fig 1. A further six satellite bands P12ee; Q12ef,
R12ee; P21ff; Q21fe, and R21ff are also allowed although much weaker. The three observed
vibronic bands are 0-0 (T00=31792 cm-1), 1-1 (T11=34403cm-1) and 2-2 (T22=36773cm-1). The
Q-branch region for each band is shown in Fig. 2, where the N quantum numbers of
assigned transitions are labelled above the spectra. The nearly equal observed intensities of the 0-0 and 1-1 transitions imply a vibrational temperature of at least 5000 K. Rotational temperatures also appear to be very high with observed transitions starting in the 0-0 band
Figure 2: Q-branch regions of the 0-0 band (bottom panel, assignments in red), 1-1 band (middle, blue) and 2-2 band (top, green). Lines from the 0-0 band are labelled in red in the middle and upper panels. Lines from the 1-1 are labelled in blue in the upper panel. The features indicated with stars are of unidentified origin.
3.1 Temperature distributions
The observed rotational intensity pattern shown in Fig. 2 cannot be reproduced with a
standard Boltzmann distribution. For example, the intensities of Q11 transitions from N=1 to
N=6 (31788-31794 cm-1) in the 0-0 band shown in the lower panel of Fig. 2 can be
approximated with Trot≈500 K. However, at this temperature transitions of N=9 have a
predicted intensity more than 10 times less than N=3 and for 500 K the observed band head
at 31803 cm-1 cannot be reproduced at all. To reproduce the observed intensities of the
transitions involving higher rotational states a much higher rotational temperature (ca.
5000 K) is required. At this temperature the transitions involving lower rotational states are predicted to have much lower intensities than observed. The non-Boltzmann conditions in the slit jet expansion can be explained by the large energy gap between rotational levels in CH and by the number of inelastic collisions with argon in the expansion not being sufficiently large to efficiently cool the plasma excited species. Cooper et al. [34] showed that
the rotational energy relaxation of CH (in the A2Δ state) by collisions with argon are driven
primarily via transitions of ΔΝ=+/-1 and that rates are highest at N=4 and drop by a factor of
≈100 at N=25 [34]. Thus, we presume that the CH radical is formed in a very highly
rotationally and vibrationally excited state inside the plasma. While some lower rotational states are cooled, the energy gap between the higher states is too large and the relaxation rate is too slow and thus significant population remains at high rotational states. Similarly, the vibrational cooling is inefficient due to the large energy difference between vibrational
levels (≈2800 cm-1) of the X2Π electronic state resulting in substantial populations in the ν=1
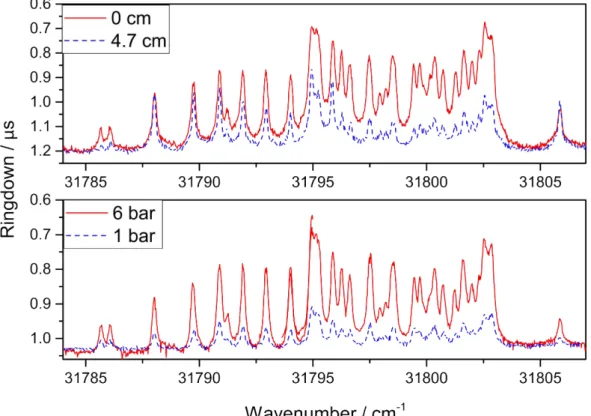
Changes made to experimental conditions of the plasma and expansion generally support this supposition. Reducing backing pressure of the acetylene argon mixture from 6 bar to 1 bar did not change the relative intensity of rotational lines significantly (Fig 2. lower panel). Likewise increasing the distance between the discharge source and the optical axis appears only to have a minor influence. When the valve is moved 4.7 cm away from the optical axis, thus allowing for continuing collisional cooling, a slight increase is observed in the lower rotational transitions and a small decrease is seen for transitions leaving from higher states (Fig 2. upper panel). For an argon-dominated supersonic expansion this corresponds to measuring the molecules after ≈84 μs of free expansion. One would normally expect these
variables to change the observed rotational spectrum, however the N=23 transitions are still
observable in both cases. This suggests the molecules are either ‘trapped’ in the rotational states that these transitions originate from or that they are replenished via cooling from higher states. This observation is also consistent with conclusions derived from a plasma
expansion study of the A2Σ+-X2Π electronic transition of the heavier CF [35]; also here higher
vibrational levels were found to be substantially populated, but rotational temperatures were low as CF can cool much easier, rotationally, given its much smaller rotational constant.
Figure 3: The Q-branch region of the 0-0 band of the C-X transition at different experimental conditions. Top panel compares a CRDS measurement close to the nozzle orifice (red) and
4.7cm down (blue). The bottom panel compares a high backing pressure of C2H2/Ar of 6 bar
(red) with a lower pressure of 1 bar (blue).
3.2 Spectral analysis
The population of quantum states in all three vibrational levels ν=0,1,2, and up to large rotational angular momenta in the slit jet expansion was employed here provided information
on a wide range of levels in the C2Σ+ excited state. For the spectral fitting procedure, first
each vibronic band was simulated in PGOPHER [36] using rotational constants for each
vibrational state of the X2Π and C2Σ+ levels as presented in Masseron et al. [4]. We kept the
differences to confirm our, and previous, line assignments. Using this simulation as a starting point, line positions from former studies were entered into the line list in PGOPHER with appropriate uncertainties (see below). For each vibronic band we extended the literature line list by adding our newly measured transitions or replaced line positions wherever our data has a greater estimated precision than that of previously measured transitions. In total 348 transitions from six studies were included in the fits, comprising as many as 216 new or improved line positions as derived from the work presented here. These line lists were then
used to perform a weighted least-squares fit in PGOPHER of the upper state (C2Σ+), while
keeping the lower state constants fixed to the numbers available from Masseron et al. [4]. This yields the excited state constants listed in Table 1.
3.3 0-0 band
For the 0-0 band there are three relevant sets of data from previous measurements. The
most extensive line list is from Heimer [21] which has lines up to N=28 that were measured
with an estimated precision of approximately 0.2 cm-1 [4,25], about 4 times less precise than
in the present work. These lines are included only in our fit when no data from other measurements is available. All lines from the high-resolution study by Ubachs et al. [23] are
included as they have the most precise line positions (≈0.004 cm-1), although only lower
rotational energy levels were measured. A more recent study by Bembenek et al. [24], performed in emission, reported line positions for 63 transitions. However due to a large background emission only 22 lines were included in their fit [24]. In total we measured 73
lines up to N=30 with an estimated precision of 0.05 cm-1. The fit presented in Table 1 also
includes 28 lines from Heimer [21], 35 from Ubachs et al. [23] and 22 from Bembenek et al. [24], all weighted according to their estimated uncertainties. The full line list is presented in Table 3, added as an Appendix. In order to fit all lines to within experimental uncertainties,
inclusion of the M centrifugal distortion constant was required. A recent study on the same
band of the CD radical (up to N=35) was able to fit the M centrifugal distortion constant to
8.22×10⁻¹⁶ cm-1 [37], i.e. two orders of magnitude lower than the value fitted here for CH.
This difference may be due to a perturbation of the rotational energy levels present in CH but not CD.
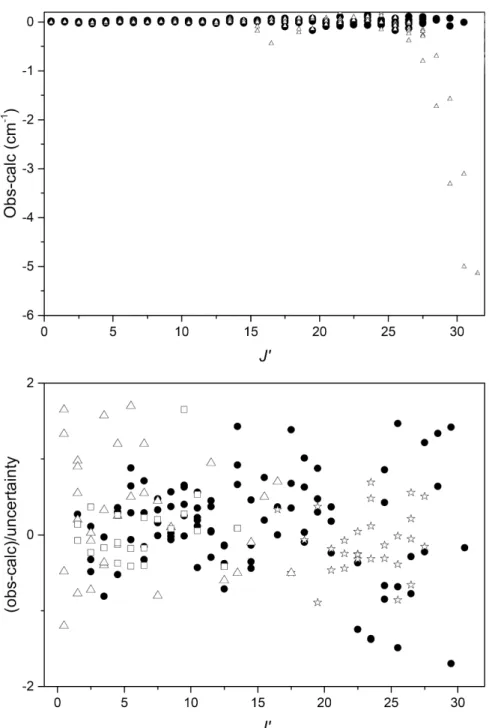
A comparison of residuals (observed minus calculated line positions) using constants from Masseron et al. [4] (open triangles) and this work (solid circles) is shown in Fig. 4. The newly
observed transitions at higher rotational levels show very high deviations (up to 5 cm-1) from
the calculated positions of Masseron et al. [4]. While this deviation can be fit by adding the extra centrifugal distortion constant, the large magnitude of the constant and the large deviations without it hint at a possible perturbation to this state. Theoretical studies on CH have indicated that there exists an anti-crossing between the potential energy curves of the C2Σ+ and the (2)Σ+ state [28] (also labelled as the D2Σ+ state [27]) which could push the
rotational levels down. No anti-crossing could be observed in the rotational levels involved in the detected transitions here and perturbation fits that included an interaction with the
(2)Σ+/D2Σ+ state did not converge. Nevertheless, it is still suspected that the higher rotational
levels of the C2Σ+ state may be perturbed and therefore the fit results presented in Table 1
Figure 4: Residual plots for the 0-0 vibronic band. Upper: comparison of residuals of all data presented here when using molecular constants determined here (solid circles) and the constants presented in Masseron et al. [4] (open triangles). Lower: weighted residuals from the fit presented for all lines in this work (solid circles), from Heimer [21] (open stars), Ubachs et al. [23] (open triangles) and from Bembenek et al. [24] (open squares).
3.4 1-1 band
For the 1-1 band there is only one previous study with relevant data for inclusion in the present fit [25]. This double resonance experiment used the A-X band as a probe for the
C2Σ+ ν=1 levels. The estimated precision of the recorded transitions is approximately 0.2 cm
-1, but as the double-resonance detection scheme employed is state selective, overlapping
transitions could be resolved. The extensive line list presented in previous work [4] could not be extended here, but a total of 83 transitions were measured with a higher precision
found in Table 4 (see Appendix). While the original fit presented by Li et al. [25] included the
L centrifugal rotational constant the fit presented by Masseron et al. [4] omits this constant
which results in the sign of the H constant changing. The higher precision of the lines in the
present work required fitting the L distortion constant to fit all observations to within
experimental uncertainty. Without it the rms error of the fit is twice as large as that presented
in Table 1. The fitted value of the D distortion constant in this work (1.7097(30)x10-3 cm-1) is
larger than the previous result (1.6336(21)x10-3 cm-1) [4].
3.5 2-2 band
The only previous laboratory measurements of the 2-2 band are from Herzberg and Johns
[22] who included lines up to N=8. In the present study we were able to measure 62 lines up
to N=16 while only two lines from the previous study were included in our fit. The line list for
the 2-2 band is presented in Table 5 (see Appendix). These new measurements increased the precision of the v=2 rotational constants by almost an order of magnitude compared to previously reported constants. The improved parameters are important in the determination of equilibrium parameters (section 3.5). Given the vast improvements in technology available to molecular spectroscopists, it is somewhat remarkable that it has taken some 50 years to improve upon the earlier laboratory measurements of this specific band. This is perhaps due to the difficulty in preparing large densities of molecules in such highly excited vibrational and rotational states, thus showing the utility of the source used in this work for spectroscopy on highly excited levels of small molecules. Figure 5 shows a small section of the spectrum with transitions from each of the vibronic bands displayed. This clearly shows once again the near equal intensity of each band. The intensity of the 2-2 band and a reasonably high Franck-Condon factor of 0.95 [38] prompted the search for the unobserved 3-3 band and although there are many unidentified features in the spectra none of these could be positively assigned to the 3-3 band.
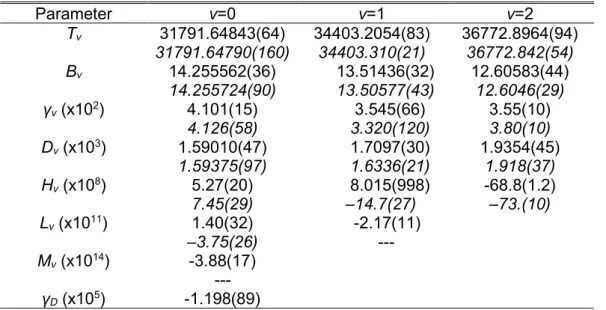
Over all three vibronic bands 216 transitions were measured either for the first time or with increased precision. These were combined with previous measurements to produce
improved molecular constants for the ν=0, 1 and 2 vibrational states of C2Σ+ which are
shown in Table 1 and compared to the constants from Masseron et al. [4]. It is clear that the constants compare very well, but that the larger data set presented here allows for further improved results.
Table 1: Rotational constants for the ν=0,1,2 vibrational levels of the C2Σ+ state of CH (in cm
-1).
Parameter ν=0 ν=1 ν=2
Tν 31791.64843(64)
31791.64790(160) 34403.2054(83) 34403.310(21) 36772.8964(94) 36772.842(54)
Bν 14.255562(36)
14.255724(90) 13.51436(32) 13.50577(43) 12.60583(44) 12.6046(29)
γν(x102) 4.101(15)
4.126(58) 3.320(120)3.545(66) 3.55(10) 3.80(10)
Dν (x103) 1.59010(47)
1.59375(97) 1.7097(30) 1.6336(21) 1.9354(45)1.918(37)
Hν (x108) 5.27(20)
7.45(29) –14.7(27)8.015(998) -68.8(1.2)–73.(10)
Lν(x1011) 1.40(32)
–3.75(26) -2.17(11)---
Mν (x1014) -3.88(17)
–1.66(62)
No. of transitions 158 129 62
σ 0.81 0.63 0.64
Nmax 30 23 16.5
Roman type numbers are constants determined in this work including new and more precise
line positions, italic numbers are from Masseron et al. [4], all values in cm-1, numbers in
parenthesis represent one standard deviation.
Figure 5: A zoom of the Q-branch region of the 2-2 band of the C2Σ+-X2Π transition of CH
showing the line profiles of transitions from all three vibronic bands with near equal intensity and line width in a single recording. Simulated line widths (dashed lines) are Lorentzians
with 0.2 cm-1 FWHM as simulated in PGOPHER.
3.5 Equilibrium constants
From the rotational constants of the C2Σ+ state (Table 1) and the previously determined
constants for the ground electronic state, equilibrium rotational constants can be calculated assuming:
𝐵𝜈 = 𝐵𝑒− 𝛼𝑒(𝑣 +
1
2) + 𝛾𝑒(𝑣 + 1 2)
2
where Be and Bν are the rotational constants for the equilibrium and the ν=0,1,2 vibrational
states, respectively. For a diatomic molecule the equilibrium rotational constant directly gives
the equilibrium bond length and the fundamental frequency (ωe), anharmonic constant (ωexe)
and vertical transition energy (Te) can be calculated. These are presented in Table 2 with a
comparison to those found in Masseron et. al. [4] and ab initio values from Kalemos et al.
[27]. The theoretical values are in good agreement with those determined here. The
equilibrium rotational constant (Be) and the vibration-rotational interaction constants (αe and
γe) are in reasonable agreement with Masseron et al. [4]. Note that the equilibrium constants
reported in Masseron et al. [4] were presented without uncertainties. The higher uncertainties in the rotational constants (Table 1) should propagate to proportionally higher
Table 2: Equilibrium constants for the C2Σ+ state of CH.
Constant This worka Masseronb Kalemosc
Be(cm-1) 14.5634(4) 14.56066 14.5477d
De (10-4cm-1) 15.701(20) 14.91
αe (cm-1) 0.5741(11) 0.56653 0.429
γe (cm-1) -0.0836(4) –0.08659
ωe (cm-1) 2853.423(27) 2853.1724 2837.3
ωexe (cm-1) 120.9330(95) 120.8564 87.76
re(Å) 1.115798(17) 1.12777 1.1164
Te (cm-1) 31809.536(14) 31809.6428 32125.33e
a: one standard deviation in parentheses; b: from Masseron et al. [4];
c: ab initio values from Kalemos et al. [27] (CASSCF+1+2);
d: calculated from value of re;
e: converted from eV.
3.6 Predissociation
In early spectroscopic studies Norrish et al. [39] had observed that the C-X band in CH is relatively weak in emission, while it is the strongest in absorption. The work of Herzberg and Johns [22] on CD and CH revealed that the emission from CD is up to 5 times stronger than that of CH. Hesser and Lutz [40 directly measured a difference in the non-radiative lifetimes
between these two isotopic species. Together these observations suggested that the C2Σ+
state is predissociated via coupling with another electronic state, causing a mass-dependent and rotational-state dependent predissociation rate. Theoretical calculations of predissociation rates by Van Dishoeck [26] showed that predissociation occurs primarily via
spin-orbit coupling to the B2Σ- state and produced a radiative lifetime of 85 ns. In
combination with measurements of the experimental lifetime of the C2Σ+, ν=0 level, yielding
3.7 ± 1.0 ns for upper spin-rotational components (F1) and 8.0 ± 1.5 ns for the lower
spin-rotational (F2) components [23], this implies a dissociation probability of 90% for the ν=0
level. The measurements of Li et al. on the ν=1 level constrained the line broadening due to
predissociation for N=23 to be less than 0.1 cm-1, thus the lifetime must be longer than
50 ps.
In the present study we observed linewidths of 0.20 ± 0.04 cm-1for well isolated lines with no
discernible change over higher rotational or vibrational states. This is illustrated in Fig. 5,
showing recordings of transitions probing all three vibrationally excited states C2Σ+, ν=0, 1
and 2 in a single measurement. The solid line in Fig. 5 is the experimental spectrum, whereas the dashed lines represent simulated line positions based on the constants shown
in Table 1 with a 0.2 cm-1 FWHM Lorentzian line profile. This lineshape is produced from
contributions by the laser bandwidth (0.08 cm-1 in the UV), Doppler broadening and the
natural lifetime associated with predissociation. In view of the fact that excited states of C2Σ+,
ν=0, known to exhibit a lifetime of about 5 ns, are also broadened to 0.2 cm-1, we conclude
that the 0.2 cm-1 width is entirely instrumental, and a result from laser bandwidth and
Doppler width. The Doppler broadening in the present slit-jet discharge expansion experiment was somewhat less than in the experiment of Li et al [25], where constraints
were given for lifetimes of C2Σ+, ν=1 levels.
Based on the measurements we can extend the information on lifetime broadening of the
C2Σ+ state. In C2Σ+, ν=0 rotational levels N=28-30 were probed for the first time. In view of
the low signal-to-noise ratio lifetime broadening can only be constrained to less than 0.1 cm
broadening to <0.05 cm-1 for transitions to N≤11, hence lifetimes exceeding 100 ps. For the
C2Σ+, ν=2 level we find quantitative information on predissociation for the first time: lifetimes
for N≤8 are estimated to exceed 100 ps, and for rotational levels up to N=16 to exceed 50
ps.
Conclusions
A pulsed high voltage discharge molecular source was used to create a planar, supersonically expanding plasma that proved to be a good source of rotationally and vibrationally highly excited CH radicals. The high rotational and vibrational temperatures are explained by the large energy gaps between states and the inefficient cooling of the argon expansion after plasma formation. This was spectroscopically useful as it allowed the high vibrational and rotational energy levels to be probed by cavity ring-down spectroscopy. This approach may be useful for other small and light molecules, characterized by large vibrational and rotational energy spacings. The recorded spectra were used to extend the
experimental line lists of the ν=0, 1 and 2 vibrational levels of the C2Σ+ electronic state and
derive rotational constants reproducing the fully extended set with transitions. The more precise constants for the ν=2 state resulting from the work presented here, assisted in further constraining the equilibrium molecular parameters and predissociation lifetimes. This work along with the recent work on CD [37], provides an excellent basis for molecular modelling and calculations. Although the C-X transition has a similar inherent strength as the
A-X transition (T00=23173 cm-1), the latter has been of more utility for astronomers due to the
accessibility and higher radiation flux in the visible spectral region [11]. The work on the C-X system may become beneficial when more sensitive UV telescopes, such as the World Space Observatory-Ultraviolet (WSO-UV) [41] come online or for measurements of sources that are brighter in the UV or where CH is more thermally excited. The bands reported here, also coincide with a wavelength domain in which diffuse interstellar band (DIBs) spectra along many different lines of sight have become available [42] and the search for excited CH transitions may be helpful in further constraining the processes involved in the formation of DIB carriers. In the meantime, the parameters may prove useful as input in radiation transfer models of stellar atmospheres [11,12].
Supplementary Material
Data for this work are presented in the form of PGOPHER files.
Acknowledgement
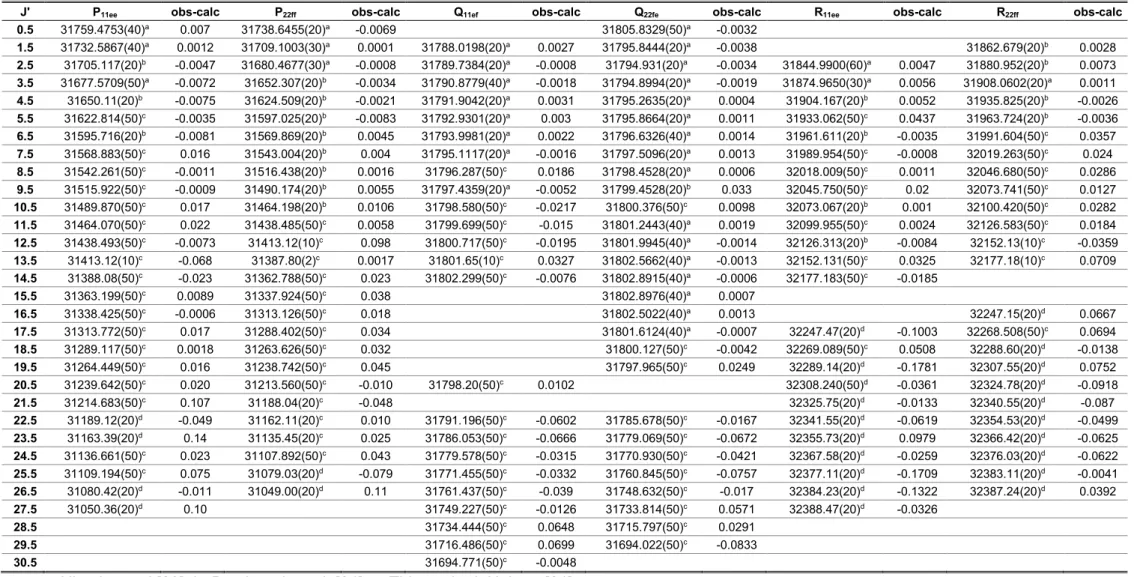
Table 3: Measured transition frequencies of the 0-0 vibronic band of the C2Σ+-X2Π transition of CH (in cm-1).
a: Ubachs et al.[23], b: Bembenek et al. [24], c: This work, d: Heimer [21]
Satellite lines included in the fit: R12ee(0.5): ν= 31805.9006(20), obs-calc=0.003, ref: Ubachs et al.[23]. Q12ef(0.5): ν=31777.2704(60), obs-calc=0.0089, ref: Ubachs et al. [23].
P12ee(2.5): ν=31652.702(20), obs-calc=-0.0015, ref: Bembenek et al. [24].
J' P11ee obs-calc P22ff obs-calc Q11ef obs-calc Q22fe obs-calc R11ee obs-calc R22ff obs-calc
0.5 31759.4753(40)a 0.007 31738.6455(20)a -0.0069 31805.8329(50)a -0.0032
1.5 31732.5867(40)a 0.0012 31709.1003(30)a 0.0001 31788.0198(20)a 0.0027 31795.8444(20)a -0.0038 31862.679(20)b 0.0028 2.5 31705.117(20)b -0.0047 31680.4677(30)a -0.0008 31789.7384(20)a -0.0008 31794.931(20)a -0.0034 31844.9900(60)a 0.0047 31880.952(20)b 0.0073 3.5 31677.5709(50)a -0.0072 31652.307(20)b -0.0034 31790.8779(40)a -0.0018 31794.8994(20)a -0.0019 31874.9650(30)a 0.0056 31908.0602(20)a 0.0011 4.5 31650.11(20)b -0.0075 31624.509(20)b -0.0021 31791.9042(20)a 0.0031 31795.2635(20)a 0.0004 31904.167(20)b 0.0052 31935.825(20)b -0.0026 5.5 31622.814(50)c -0.0035 31597.025(20)b -0.0083 31792.9301(20)a 0.003 31795.8664(20)a 0.0011 31933.062(50)c 0.0437 31963.724(20)b -0.0036 6.5 31595.716(20)b -0.0081 31569.869(20)b 0.0045 31793.9981(20)a 0.0022 31796.6326(40)a 0.0014 31961.611(20)b -0.0035 31991.604(50)c 0.0357 7.5 31568.883(50)c 0.016 31543.004(20)b 0.004 31795.1117(20)a -0.0016 31797.5096(20)a 0.0013 31989.954(50)c -0.0008 32019.263(50)c 0.024 8.5 31542.261(50)c -0.0011 31516.438(20)b 0.0016 31796.287(50)c 0.0186 31798.4528(20)a 0.0006 32018.009(50)c 0.0011 32046.680(50)c 0.0286 9.5 31515.922(50)c -0.0009 31490.174(20)b 0.0055 31797.4359(20)a -0.0052 31799.4528(20)b 0.033 32045.750(50)c 0.02 32073.741(50)c 0.0127 10.5 31489.870(50)c 0.017 31464.198(20)b 0.0106 31798.580(50)c -0.0217 31800.376(50)c 0.0098 32073.067(20)b 0.001 32100.420(50)c 0.0282 11.5 31464.070(50)c 0.022 31438.485(50)c 0.0058 31799.699(50)c -0.015 31801.2443(40)a 0.0019 32099.955(50)c 0.0024 32126.583(50)c 0.0184 12.5 31438.493(50)c -0.0073 31413.12(10)c 0.098 31800.717(50)c -0.0195 31801.9945(40)a -0.0014 32126.313(20)b -0.0084 32152.13(10)c -0.0359 13.5 31413.12(10)c -0.068 31387.80(2)c 0.0017 31801.65(10)c 0.0327 31802.5662(40)a -0.0013 32152.131(50)c 0.0325 32177.18(10)c 0.0709 14.5 31388.08(50)c -0.023 31362.788(50)c 0.023 31802.299(50)c -0.0076 31802.8915(40)a -0.0006 32177.183(50)c -0.0185
15.5 31363.199(50)c 0.0089 31337.924(50)c 0.038 31802.8976(40)a 0.0007
16.5 31338.425(50)c -0.0006 31313.126(50)c 0.018 31802.5022(40)a 0.0013 32247.15(20)d 0.0667
17.5 31313.772(50)c 0.017 31288.402(50)c 0.034 31801.6124(40)a -0.0007 32247.47(20)d -0.1003 32268.508(50)c 0.0694
18.5 31289.117(50)c 0.0018 31263.626(50)c 0.032 31800.127(50)c -0.0042 32269.089(50)c 0.0508 32288.60(20)d -0.0138
19.5 31264.449(50)c 0.016 31238.742(50)c 0.045 31797.965(50)c 0.0249 32289.14(20)d -0.1781 32307.55(20)d 0.0752
20.5 31239.642(50)c 0.020 31213.560(50)c -0.010 31798.20(50)c 0.0102 32308.240(50)d -0.0361 32324.78(20)d -0.0918
21.5 31214.683(50)c 0.107 31188.04(20)c -0.048 32325.75(20)d -0.0133 32340.55(20)d -0.087
22.5 31189.12(20)d -0.049 31162.11(20)c 0.010 31791.196(50)c -0.0602 31785.678(50)c -0.0167 32341.55(20)d -0.0619 32354.53(20)d -0.0499 23.5 31163.39(20)d 0.14 31135.45(20)c 0.025 31786.053(50)c -0.0666 31779.069(50)c -0.0672 32355.73(20)d 0.0979 32366.42(20)d -0.0625 24.5 31136.661(50)c 0.023 31107.892(50)c 0.043 31779.578(50)c -0.0315 31770.930(50)c -0.0421 32367.58(20)d -0.0259 32376.03(20)d -0.0622 25.5 31109.194(50)c 0.075 31079.03(20)d -0.079 31771.455(50)c -0.0332 31760.845(50)c -0.0757 32377.11(20)d -0.1709 32383.11(20)d -0.0041 26.5 31080.42(20)d -0.011 31049.00(20)d 0.11 31761.437(50)c -0.039 31748.632(50)c -0.017 32384.23(20)d -0.1322 32387.24(20)d 0.0392
27.5 31050.36(20)d 0.10 31749.227(50)c -0.0126 31733.814(50)c 0.0571 32388.47(20)d -0.0326
28.5 31734.444(50)c 0.0648 31715.797(50)c 0.0291
29.5 31716.486(50)c 0.0699 31694.022(50)c -0.0833
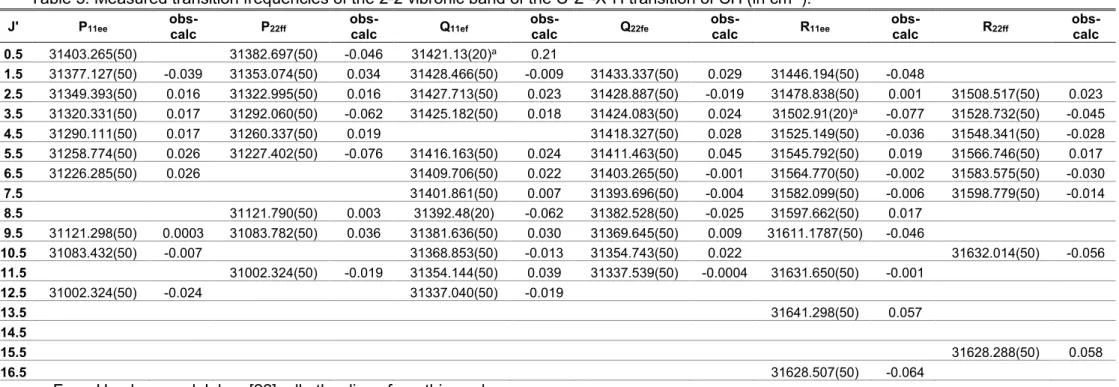
Table 4: Measured transition frequencies of the 1-1 vibronic band of the C2Σ+-X2Π transition of CH (in cm-1).
a: from this work b: From Li et al. [25]
J' P11ee obs-calc P22ff obs-calc Q11ef obs-calc Q22fe obs-calc R11ee obs-calc R22ff obs-calc
0.5 31639.266(50)a 0.011 31618.804(50)a 0.007
1.5 31612.84(20)b -0.116 31589.564(50)a 0.045 31673.021(50)a 0.007
2.5 31585.695(50)a 0.015 31560.743(50)a 0.044 31667.141(50)a 0.010 31670.865(50)α -0.009 31720.365(50)a 0.050 31753.664(50)a -0.002
3.5 31557.856(50)a -0.047 31531.926(50)a 0.026 31666.96(20)a -0.001 31669.144(50)a 0.003 31747.921(50)a 0.025 31778.033(50)a -0.029
4.5 31529.782(50)a 0.013 31502.920(50)a -0.076 31666.251(50)a 0.014 31667.303(50)a -0.033 31774.323(50)a 0.028 31802.57(20)b -0.061
5.5 31501.21(20)b -0.133 31473.930(50)a -0.008 31665.065(50)a -0.002 31665.275(50)a -0.016 31799.904(50)a -0.002 31826.838(50)a -0.015
6.5 31472.665(50)a 0.015 31444.677(50)a -0.013 31663.482(50)a 0.014 31662.913(50)a -0.001 31824.767(50)a -0.027 31850.502(50)a -0.020
7.5 31443.716(50)a 0.018 31415.229(50)a 0.004 31661.412(50)a -0.014 31660.105(50)a -0.021 31848.918(50)a -0.021 31873.4812(50)a -0.023
8.5 31414.478(50)a -0.003 31385.47(50)a -0.047 31658.884(50)a -0.020 31656.74(20)b -0.118 31872.310(50)a 0.022 31895.61(20)b -0.078
9.5 31384.99(50)a 0.009 31355.509(50)a -0.003 31655.857(50)a 0.003 31653.018(50)a -0.015 31894.770(50)a 0.003 31916.992(50)a 0.029
10.5 31355.17(50)a -0.005 31325.191(50)a 0.014 31652.08(20)b -0.134 31648.571(50)a 0.002 31916.301(50)a 0.011 31937.185(50)a -0.028
11.5 31325.052(50)a 0.047 31294.480(50)a 0.031 31647.913(50)a 0.004 31643.363(50)a -0.010 31936.62(20)b -0.134 31956.341(50)a 0.023
12.5 31294.478(50)a 0.047 31263.13(20)b -0.124 31642.890(50)a 0.037 31637.339(50)a 0.002 31956.074(50)a 0.026 31974.113(50)a -0.031
13.5 31263.13(20)b -0.248 31231.528(50)a 0.025 31636.952(50)a 0.008 31630.340(50)a 0.000 31974.114(50)a 0.071 31990.570(50)a 0.027
14.5 31231.708(50)a -0.050 31199.10(50)a 0.014 31630.086(50)a 0.025 31622.20(20)b -0.040 31990.570(50)a -0.026 32005.371(50)a 0.023
15.5 31199.465(50)a 0.003 31165.74(20)b -0.124 31622.05(20)b -0.016 31612.79(20)b -0.081 32005.532(50)a -0.011 32018.22(20)b -0.151
16.5 31166.18(20)b -0.178 31131.56(20)b -0.116 31612.64(20)b -0.154 31602.07(20)b 0.032 32018.58(20)b -0.117 32029.14(20)b -0.254
17.5 31132.11(20)b -0.169 31096.08(20)b -0.239 31601.97(20)b -0.080 31589.54(20)b 0.030 32029.50(20)b -0.343 32037.96(20)b -0.206
18.5 31096.85(20)b -0.175 31059.37(20)b -0.179 31589.564(50)a -0.044 31575.17(10)a 0.157 32038.52(20)b -0.210 32044.37(20)b -0.025
19.5 31060.26(20)b -0.093 31021.05(20)b -0.019 31575.208(50)a 0.016 31558.290(50)a 0.057 32045.04(20)b -0.029 32047.74(20)b 0.000
20.5 31021.86(20)b -0.107 30980.42(20)b -0.103 31558.528(50)a 0.043 32048.51(20)b -0.007 32047.83(20)b 0.031
21.5 30981.38(20)b -0.130 32048.74(20)b 0.065 32044.22(20)b 0.119
22.5 32045.19(20)b 0.121 32036.01(20)b -0.077
Table 5: Measured transition frequencies of the 2-2 vibronic band of the C2Σ+-X2Π transition of CH (in cm-1).
J' P11ee obs-calc P22ff obs-calc Q11ef obs-calc Q22fe obs-calc R11ee obs-calc R22ff obs-calc
0.5 31403.265(50) 31382.697(50) -0.046 31421.13(20)a 0.21
1.5 31377.127(50) -0.039 31353.074(50) 0.034 31428.466(50) -0.009 31433.337(50) 0.029 31446.194(50) -0.048
2.5 31349.393(50) 0.016 31322.995(50) 0.016 31427.713(50) 0.023 31428.887(50) -0.019 31478.838(50) 0.001 31508.517(50) 0.023
3.5 31320.331(50) 0.017 31292.060(50) -0.062 31425.182(50) 0.018 31424.083(50) 0.024 31502.91(20)a -0.077 31528.732(50) -0.045
4.5 31290.111(50) 0.017 31260.337(50) 0.019 31418.327(50) 0.028 31525.149(50) -0.036 31548.341(50) -0.028
5.5 31258.774(50) 0.026 31227.402(50) -0.076 31416.163(50) 0.024 31411.463(50) 0.045 31545.792(50) 0.019 31566.746(50) 0.017
6.5 31226.285(50) 0.026 31409.706(50) 0.022 31403.265(50) -0.001 31564.770(50) -0.002 31583.575(50) -0.030
7.5 31401.861(50) 0.007 31393.696(50) -0.004 31582.099(50) -0.006 31598.779(50) -0.014
8.5 31121.790(50) 0.003 31392.48(20) -0.062 31382.528(50) -0.025 31597.662(50) 0.017
9.5 31121.298(50) 0.0003 31083.782(50) 0.036 31381.636(50) 0.030 31369.645(50) 0.009 31611.1787(50) -0.046
10.5 31083.432(50) -0.007 31368.853(50) -0.013 31354.743(50) 0.022 31632.014(50) -0.056
11.5 31002.324(50) -0.019 31354.144(50) 0.039 31337.539(50) -0.0004 31631.650(50) -0.001
12.5 31002.324(50) -0.024 31337.040(50) -0.019
13.5 31641.298(50) 0.057
14.5
15.5 31628.288(50) 0.058
16.5 31628.507(50) -0.064
References
[1] T. Heurlinger, E. Hulthén, Z. Wiss. Photogr. Photophys. Photochem. 18 (1919)
241-248.
[2] A. McKellar, E. H. Richardson, Astrophys. J. 122 (1955) 196-192. doi:10.1086/146071
[3] J. Dufay, J., Astrophys. J. 91 (1940) 91-102. doi:10.1086/144149.
[4] T. Masseron, B. Plez, S. Van Eck, R. Colin, I. Daoutidis, M. Godefroid, P.-F. Coheur,
P. Bernath, A. Jorissen, N. Christlieb, Astron. Astrophys. 571 (2014) A47. doi:10.1051/0004-6361/201423956.
[5] S. Bottinelli, V. Wakelam, E. Caux, C. Vastel, Y. Aikawa, C. Ceccarelli, Mon. Not. R.
Astron. Soc. 441 (2014) 1964-1973. doi:10.1093/mnras/stu700.
[6] A.C. Danks, S.R. Federman, D.L. Lambert, Astron. Astrophys. 130 (1984) 62-66.
[7] O.E.H. Rydbeck, J. Elldér, W.M. Irvine, Nature. 246 (1973) 466-468.
doi:10.1038/246466a0.
[8] J.B. Whiteoak, F.F. Gardner, B. Höglund, Mon. Not. R. Astron. Soc. 190 (1980) 17-22.
doi:10.1093/mnras/190.1.17P.
[9] R. Colin, P.F. Bernath, J. Mol. Spectrosc. 263 (2010) 120.
doi:10.1016/j.jms.2010.06.013.
[10] A. Goswami, Mon. Not. R. Astron. Soc. 359 (2005) 531-544. doi:10.1111/j.1365-2966.2005.08917.
[11] U.G. Jorgensen, M. Larsson, A. Iwamae, B. Yu, Astron. Astrophys. 315 (1996) 204-211. http://adsabs.harvard.edu/full/1996A%26A...315..204J
[12] J. Tennyson, S.N. Yurchenko, Atoms, 6 (2018) 26. doi:10.3390/atoms6020026. [13] M. Bogey, C. Demuynck, J.L. Destombes, Chem. Phys. Lett. 100 (1983) 105-109.
doi:10.1016/0009-2614(83)87272-8.
[14] C.R. Brazier, J.M. Brown, Can. J. Phys. 62 (1984) 1563-1578. doi:10.1139/p84-201. [15] M. McCarthy, S. Mohamed, J.M. Brown, P. Thaddeus, Proc. Nat. Acad. Sci. USA. 103
(2006) 12263-12268. doi:10.1073/pnas.0601746103.
[16] S. Truppe, R.J. Hendricks, S.K. Tokunaga, E.A. Hinds, M.R. Tarbutt, J. Mol. Spectrosc. 300 (2014) 70-78. doi:10.1016/J.JMS.2014.03.008.
[17] S. Truppe, R.J. Hendricks, S.K. Tokunaga, H.J. Lewandowski, M.G. Kozlov, C. Henkel, E.A. Hinds, M.R. Tarbutt, Nat. Commun. 4 (2013) 2600.
doi:10.1038/ncomms3600.
[18] A.J. de Nijs, W. Ubachs, H.L. Bethlem, Phys. Rev. A. 86 (2012) 032501. doi:10.1103/PhysRevA.86.032501.
[19] L. Gerö, Zeitschrift für Phys. 118 (1941) 27-36. doi:10.1007/BF01339264. [20] W. Ubachs, W.M. van Herpen, J.J. ter Meulen, A. Dymanus, J. Chem. Phys. 84
(1986) 6575-6580. doi:10.1063/1.450710.
[21] T. Heimer, Zeitschrift für Phys. 78 (1932) 771-780. doi:10.1007/BF01342037. [22] G. Herzberg, J.W.C. Johns, Astrophys. J. 158 (1969) 399-418. doi:10.1086/150202. [23] W. Ubachs, G. Meyer, J.J. ter Meulen, A. Dymanus, J. Chem. Phys. 84 (1986)
3032-3041. doi:10.1063/1.450284.
[24] Z. Bembenek, R. Kȩpa, M. Rytel, J. Mol. Spectrosc. 183 (1997) 1-5. doi:10.1006/jmsp.1996.7246.
[25] X. Li, A. Kumar, C.-C. Hsiao, Y.-P. Lee, J. Phys. Chem. A. 103 (1999) 6162-6166. doi:10.1021/jp991027b.
[26] E.F. van Dishoeck, J. Chem. Phys. 86 (1987) 196-214. doi:10.1063/1.452610. [27] A. Kalemos, A. Mavridis, A. Metropoulos, J. Chem. Phys. 111 (1999) 9536-9548.
doi:10.1063/1.480285.
[28] G.J. Vázquez, J.M. Amero, H.P. Liebermann, R.J. Buenker, H. Lefebvre-Brion, J. Chem. Phys. 126 (2007) 164302. doi:10.1063/1.2721535.
[29] A. O’Keefe, D.A.G. Deacon, Rev. Sci. Instrum. 59 (1988) 2544-2551. doi:10.1063/1.1139895.
[30] T. Motylewski, H. Linnartz, Rev. Sci. Instrum. 70 (1999) 1305-1312. doi:10.1063/1.1149589.
doi:10.1080/00387010.2014.928493.
[32] X. Bacalla, E.J. Salumbides, H. Linnartz, W. Ubachs, D. Zhao, J. Phys. Chem. A. 120 (2016) 6402-6417. doi:10.1021/acs.jpca.6b06647.
[33] D. Zhao, N. Wehres, H. Linnartz, W. Ubachs, Chem. Phys. Lett. 501 (2011) 232–237. doi:10.1016/j.cplett.2010.11.048.
[34] J.L. Cooper, J.C. Whitehead, J. Chem. Soc., Faraday Trans. 89 (1993) 1287-1290. doi:10.1039/FT9938901287.
[35] G. Bazalgette Courrèges-Lacoste, J.P. Sprengers, W. Ubachs, S. Stolte, H. Linnartz, J. Mol. Spectrosc. 205 (2001) 341-343. doi:10.1006/jmsp.2000.8261.
[36] C.M. Western, J. Quant. Spectrosc. Radiat. Transf. 186 (2017) 221-242. doi:10.1016/J.JQSRT.2016.04.010.
[37] A. Para, M. Zachwieja, W. Szajna, R. Hakalla, J. Mol. Spectrosc. 354 (2018) 65-70. doi:10.1016/j.jms.2018.11.002.
[38] H.S. Liszt, W.H. Smith, J. Quant. Spectrosc. Radiat. Transf. 12 (1972) 947–958. doi:10.1016/0022-4073(72)90082-9.
[39] R.G.W. Norrish, G. Porter, B.A. Thrush, Proc. Roy. Soc. London A216 (1953) 165. doi:10.1098/rspa.1953.0014
[40] J.E. Hesser, B.L. Lutz, Phys. Rev. Lett. 20 (1968) 363–365. doi:10.1103/PhysRevLett.20.363.
[41] B. Shustov, A.I. Gómez de Castro, M. Sachkov, J.C. Vallejo, P. Marcos-Arenal, E. Kanev, I. Savanov, A. Shugarov, S. Sichevskii, Astrophys. Space Sci. 363 (2018) 62. doi:10.1007/s10509-018-3280-7.