Iran J Allergy Asthma Immunol August 2020; 19(4):416-425. Doi:10.18502/ijaai.v19i4.4116
Comparison of Expression Levels of miR-29b-3p and miR-326 in T Helper-1
and T Helper-17 Cells Isolated from Responsive and Non-responsive
Relapsing-remitting Multiple Sclerosis Patients Treated with Interferon-beta
Leila Karimi1, Nahid Eskandari1, Vahid Shaygannejad2, Nasrin Zare3, Alireza Andalib1,
Hossein Khanahmad4, and Omid Mirmosayyeb2
1 Department of Immunology, School of Medicine, Isfahan University of Medical Sciences, Isfahan, Iran 2 Isfahan Neurosciences Research Center, Alzahra Research Institute, Isfahan University
of Medical Sciences, Isfahan, Iran
3 Applied Physiology Research Center, Cardiovascular Research Institute, Isfahan University
of Medical Sciences, Isfahan, Iran
4 Department of Genetics and Molecular Biology, School of Medicine, Isfahan University
of Medical Sciences, Isfahan, Iran
Received: 4 February 2020; Received in revised form: 20 June 2020; Accepted: 1 July 2020
ABSTRACT
T helper type 1 (Th1) and Th17 Cells with distinct cytokine profiles including interferon-gamma (IFN-γ) and interleukin 17 (IL-17) have a pivotal role in neuroinflammation and myelin destruction in the central nervous system (CNS) in MS. MicroRNA-29b (MiR-29b) and miR-326 contribute to regulating Th1 and Th17 differentiation and altered expression of the miRNAs could be associated with response to treatment in multiple sclerosis (MS). Therefore, our study aimed to evaluate the percentage of Th1 and Th17 and determining the expression levels of miR-29b-3p and miR-326 in these lymphocyte subpopulations between responsive and non-responsive to interferon beta (IFN-β) therapy in relapsing-remitting multiple sclerosis (RRMS) patients.
The present study was performed on 40 RRMS patients following treatment with IFN-β. The percentage of Th1 cells and Th17 cells were determined by flow cytometry in responsive and non-responsive patients. The expression levels of miR-29b-3p and miR-326 were assessed in Th1 and Th17 cells by quantitative polymerase chain reaction (PCR). Enzyme-linked immunosorbent assay (ELISA) was applied to evaluate the plasma levels of IFN-γ and IL-17A.
No significant difference was observed in the percentage of Th1 and Th17 cells as well as the expression levels of miR-29b-3p and miR-326 (in Th1 and Th17, respectively) in treated patients. Also, we did not find any significant difference in IFN-γ and IL-17A plasma concentration between responsive or non-responsive to IFN-β therapy in patients with RRMS.
IFN-β may regulate other miRNAs in Th1 and Th17 cells than miR29b-3p and miR-326 in MS patients.
Keywords: Interferon-beta; MicroRNA; Relapsing-remitting multiple sclerosis
Corresponding Author: Nahid Eskandari, PhD;
Department of Immunology, School of Medicine, Isfahan University
of Medical Sciences, Postal Code: 81746-73461, Isfahan, Iran.
INTRODUCTION
Micro RNAs (miRNAs) are single-strand non-coding RNA 19-25 nucleotides in length. They regulate gene expression through 3ˊuntranslated region (UTR) of target mRNAs. The dysregulation of miRNAs expression can induce severe inflammatory responses in some diseases, including different cancers, autoimmune disorders, and neurological disorders.1
Multiple sclerosis (MS) is shown as the most common disease of the central nervous system (CNS) in young adults. MS is induced by autoimmune chronic inflammation and damage to nerves in the spinal cord and the brain.2,3 Relapsing-remitting MS (RRMS) is the most common type of MS, making up approximately 75-85 % of diagnoses.4 MS is characterized by distinct cytokine profiles including interferon-gamma (IFN-γ( and interleukin 17 )IL-17( and a high frequency of T helper type 1 (Th1) and Th17 cells.5
Previous studies have reported that miR-29b and miR-326 act as regulators of Th1 and Th17 differentiation, respectively. Indeed, miR-29b affects the expression of T-box 21 protein (T-bet) and IFN-γ. IFN-γ establishes a regulatory feedback loop and also increases miR-29b expression.6,7 MiR-326 is highly expressed in Th17 cells compared with other subtypes of CD4+ T cells in RRMS patients. Previous studies have reported a significant role for miR-326 in the induction of Th-17 differentiation (by inhibition of ETS-1) and the progression of autoimmune diseases. MiR-326 is known as a potential marker for the diagnosis of relapse and remission phases in RRMS patients,8,9 as well as altered expression of miR-326 in T cell-derived exosomes, may be used as a helpful clinical indicator to diagnose and treatment of MS.10
IFN-β as the first option of treatment of RRMS patients decreases relapse rates, improves clinical signs and symptoms, and slows down the speed of disease progression. But unfortunately, 30–50% of MS patients are non-responsive to IFN-β therapy and this treatment may be worse in neuromyelitis optica (NMO). Therefore, it is important to evaluate the progression of MS disease and the effectiveness of IFN-β therapy in MS patients.
Indeed, IFN-β as immune-modulating therapy involved in modulation of the balance among different populations of T cells11-13 and it seems that IFN-β is effective in RRMS disease driven by Th1, not by Th17. Also, it is suggested that different levels of cytokines
and chemokines among MS phenotypes are related to the heterogeneous response to IFN-β treatment.14
Thus, it is likely that the Th1/Th17 axis and miRNAs involved in the regulation of Th1 and Th17 differentiation such as miR-29 and miR-326 could be linked to a response to IFN-β therapy as well as may provide a perspective in the prediction of treatment outcome.
Therefore, the present study aimed to assess the percentage of Th1 and Th17 and to determine the expression levels of miR-326 and miR29b-3p in these lymphocyte subgroups between responsive and non-responsive patients with RRMS to interferon-beta therapy.
MATERIALS AND METHODS
Patients
Isolation of Peripheral Blood Mononuclear Cells (PBMCs)
Blood samples were collected in tubes containing ethylene diamine tetraacetic acid (EDTA). Then, Blood samples were diluted with phosphate-buffered saline (PBS, Sigma, Germany). PBMCs were isolated using Ficoll-Paque and then isolated PBMCs were washed twice with PBS. The supernatant was discarded, and the pellet was re-suspended in PBS. The cell viability was determined by trypan blue (Sigma, Germany). The cell suspension was divided into two equal parts, and each part was purified using magnetic-activated cell sorting (MACS).
Purification of Th1 and Th17 Cells by the MACS Method
Isolated PBMCs were purified using the EasySep™ Human Th1/TH17 Cell Isolation Kits (Stemcell TM Technologies, Canada). Purification of Th1 (CD4+CXCR3+) or Th17 cells (CD4+CXCR3-CCR6+) includes two-step, pre-enrichment by negative selection and separation of desired cells by positive selection. According to the statement of the EasySep™ Human Th1/TH17 Cell Isolation Kits, following stimulation with phorbol 12-myristate 13-acetate (PMA)-Ionomycin and intracellular staining, 45-80% and 5-20% of the isolated cells are IFN-γ+ and IL-17+ respectively. Thus, the purity of Th1 and Th17 cells were confirmed as 59% and 18% respectively by intracellular flow cytometry using Anti-human IFN-γ PE antibody and Anti-human IL17 PE antibody (eBioscience, USA).
RNA Extraction and cDNA Synthesis
The total RNA was extracted from Th1 cells and Th17 cells by the Pico Pure RNA Isolation Kit (Fermentas; Thermo Fisher Scientific Inc, USA) according to manufacturer's instructions. RNA quantity and integrity were assessed using NanoDrop spectrophotometer and agarose gel electrophoresis.
RNA (5 ng/μL) was applied for complementary DNA (cDNA) conversion using the miRCURY™ LNA™ miRNA RT Kit (Exiqon, Denmark). The cDNA was made according to the following protocol: 60 min at 42ᵒC followed by heat-inactivation of the reverse transcriptase for 5 min at 95ᵒC.
Real-time qPCR for Quantification of miRNAs The Real Q Plus Master Mix Green (Amplicon, Denmark) and pre-designed primers (LNA™ Primer mix, Exiqon, Denmark)were used for hsa-miR-29b-3P and hsa-miR-326 quantification by the Step One Software v2.3 (Applied Biosystems, USA). The following thermal cycle conditions were applied: activation/denaturation at 95ᵒC for 15 min followed by 45 cycles at 95°C for 15 s and 60°C for 1 min. Expression levels of target genes were normalized using SNORD48 as a reference gene.8,17,18 The threshold cycle (CT) was determined automatically by the Step One Software v2.3 software. The relative quantification (ΔCT) method was applied to calculate the fold change expression of microRNAs (Figure 2).
Flow Cytometry Assay
ELISA
Plasma samples were collected and stored at -80°C. The concentration of IFN-𝛾 and IL-17A was measured with PeproTech's Human IFN-γ/IL-17A ELISA development Kit (Pepro Tech, USA) according to the manufacturer’s instructions (analytical sensitivity: 2 pg/mL).
Statistical Analysis
We analyzed all data using SPSS software, Version 16 (SPSS Inc. Chicago, Ill, USA). Mann- Whitney U test was applied to compare quantitative expression levels and percentage of cell populations between responsive and non-responsive patients with RRMS. Also, an independent T-test was used to compare cytokine levels between two groups. Data are shown as mean±SD and a p<0.05 was considered significant.
RESULTS
Demographic Characteristics of the Patients with MS
The study included RRMS patients (n=40) who were treated with IFN-β for one year. Patients were classified into two groups including responsive patients and non-responsive patients based on MRS. The patient characteristics are shown in Table 1.
The Frequency of Th1 and Th17 Cells in Responsive and Non-responsive Patients
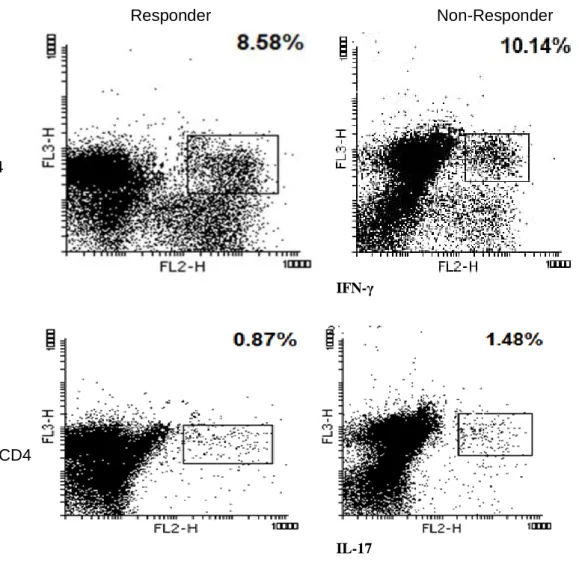
The percentage of Th1 (CD3+ CD4+ IFN-γ+) and Th17 (CD3+ CD4+ IL17+) cells and also the ratio of Th1/Th17 cells were determined by flow cytometry in responsive and non-responsive patients with RRMS. The percentage of these cells was determined by the Mann- Whitney U test. No significant difference was observed in the percentage of Th1 and Th17 cells between responsive and non-responsive patients with RRMS. Statistical parameters were summarized in Table 2.
The Expression Levels of miR-29b-3p and miR-326 in Th1 and Th17 Cells
Because miR-29b and miR-326 were involved in the regulation of Th1 and Th17 differentiation respectively, the expression levels of miR-29b-3p and miR-326 were evaluated in isolated Th1 and Th17 cells by quantitative PCR. There were any significant differences in the expression levels of miR-29b-3p (p=0.38) and miR-326 (p=0.19) between the responsive and non-responsive patients with RRMS. The expression ratio of the miR29b/miR326 was not higher in the responsive group.
Table1.Demographic and clinical characteristics of the study subjects
Characteristic Responsive Patients Non-Responsive patients
Number (n) 20 20
Age in years,
mean 35 42
Sex, n (%)
Female 83 78.57
Male 17 21.43
EDSS scorea
Baseline 0-6 0-6
After therapy 0-2 0-5
Relapse rateb 0-1 0-1
Activated plaques in the brain Baseline
After therapy
2 2-3
2 5-6 Cervical plaques
baseline After therapy
2-3 2-3
2-3 4-6 Lesion load
Baseline After therapy
2-3 2-4
Table 2. Statistical parameters of cell populations
Parameters (mean %±SD) Responsive Non-Responsive p
Lymphocytes 80.35±22.49 79.9±29.04 0.714
T cells (CD3+) 78.36±12.7 62.55±30.78 0.206
T helper cells (CD3+CD4+) 54.17±16.94 28.9±24.46 0.190
Th1 cells (CD3+CD4+IFNγ+) 8.67±7.44 8.55±8.47 0.905
Th17 cells (CD3+CD4+IL17+) 0.79±0.64 0.88±0.68 0.333
Th1/Th17 ratio 9.58±6.38 10.96±8.57 0.805
SD, Standard Deviation
IFN-γ
IL-17
Figure 1. Flow cytometry analysis of the CD3+ CD4 + IFN-γ and CD3+ CD4 + IL-17 expressing cells in responsive and non-responsive Relapsing-remitting multiple sclerosis (RRMS) patients treated with IFN-β. PBMCs activated by stimulation cocktail (PMA+ionomysin), then activated cells stained according to the method described in materials and methods and analyzed using flow cytometry assay. The first lymphocyte population was characterized by FSC/SSC dot plot. Then the lymphocytes were gated on CD3. Next the proportion of CD3+ cells expressing CD4 IFN-γ or CD4 IL-17 (a and b respectively) was evaluated in responsive and non-responsive Relapsing-remitting multiple sclerosis (RRMS) patients. RRMS; Relapsing-remitting multiple sclerosis, IFN-γ; Interferon-gamma, IL; Interleukin, CD; Cluster of differentiation, PBMCs; Peripheral blood mononuclear cells PMA; Phorbol 12-myristate 13-acetate, FSC; Forward scatter and SSC; side.
Non-Responder Responder
CD4
Figure 2. The comparison of expression levels of miR-29b-3p in Th1 and miR-326 in Th17 cells between responsive and non-responsive Relapsing-remitting multiple sclerosis (RRMS) patients treated with IFN-β. The expression levels of these miRNAs were evaluated in RRMS patients following IFN-β therapy for one year by quantitative RT-PCR and the −ΔCT method was applied to analyze the results (p> 0.05). Expression levels of target genes were normalized using SNORD48 as a reference gene. Bars indicate means ± Standard Error. RRMS; Relapsing-remitting multiple sclerosis, Mir: MicroRNA, Th; T helper type, IFN-β; Interferon-beta, RT-PCR; Realtime polymerase chain reaction, CT; Threshold cycle and N.S, non-significant.
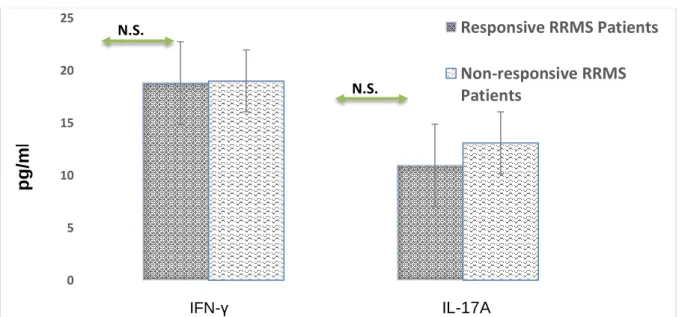
Figure 3. The plasma levels of IFN-γ and IL-17A in responsive and non-responsive Relapsing-remitting multiple sclerosis (RRMS) patients
The plasma levels of IFN-γ and IL-17A were measured by ELISA in responsive and non-responsive RRMS patients (p> 0.05). Data are displayed as means ± Standard Error. RRMS; IFN-γ; Interferon-gamma, IL; Interleukin, ELISA; Enzyme-linked
0 2 4 6 8 10 12 14
miR-29b-3p in Th1 miR-326 in Th17
R
e
la
ti
ve
e
xpr
e
ss
io
n
(-∆
Ct
)
Responsive RRMS Patients
Non-responsive RRMS Patients
N.S.
N.S.
0 5 10 15 20 25
Responsive RRMS Patients
Non-responsive RRMS
Patients
N.S.
N.S.
IFN-γ IL-17A
p
g
/m
immunosorbent assay Pg/ml; Picogram/milliliter and N.S, non-significant
Plasma Levels of IFN-γ and IL-17A
The plasma concentrations of IFN-γ and IL-17A were measured by ELISA. There were no significant differences in levels of IFN-γ and IL-17A between responsive and non-responsive patients (p=0.360 and
p=0.907) respectively.
As well, we did not observe any significant difference in the ratio of IFN-γ/IL-17 between responsive and non-responsive patients (p=0.959).
DISCUSSION
RRMS is a complex disease with an unpredictable clinical course and variable pathological patterns.12 Th1 and Th17 cells with distinct cytokine profiles, including IFN-γ and IL-17 respectively, have important roles in the pathology of MS.5 The therapeutic role of IFN-β as immune-modulating therapy is related to modulation of the balance among different populations of T cell.13 Based on the context of the specific pathology, type I Interferons (type I IFNs) have Inflammatory and anti-inflammatory functions and thus there is the heterogeneity of IFN-β response in MS patients.19
In the current study, the percentage of Th1 and Th17 cells and cytokine profile (IFN-𝛾 and IL-17A) were investigated and compared between responsive and non-responsive patients with RRMS. However, we observed no significant difference in the percentage of Th1 cells and Th17 cells between responsive and non-responsive patients with RRMS. Several studies have demonstrated that IFN-β worsens Th17-mediated inflammatory diseases such as RRMS, NMO, psoriasis, rheumatoid arthritis, systemic lupus erythematosus and ulcerative colitis.20-25 As well as, Axtell et al have shown that IFN-β could contribute to improving Th1 cells-induced EAE and worse Th17 cells-induced disease.14,21 Whilst some findings indicate that IFN-β prevents Th17 cell differentiation and triggers the apoptosis in Th17 cells.26,27 Our results may have become non-significant because our sample size was too small, which makes it impossible to classify the diseases to drive by Th1 or Th17 and so it's not conceivable to compare our results with another study.
Furthermore, we evaluated and compared the expression levels of miR29b-3p and miR-326 in Th1 and Th17 cells between responsive and non-responsive patients with RRMS. There was not any significant
difference in the expression levels of miR-29b-3p in Th1 cells and miR-326 in Th17 cells between the responsive and non-responsive patients with RRMS. Hecker et al reported decreased expression of miR-29b-5p in PBMCs from responsive patients with MS. Moreover, they observed the down-regulation of the mir-29 family one month after the start of IFN-β therapy.28 However, Fattahi et al reported that miR-29b-5p and miR-29b-3p were down-regulated in isolated PBMCs from non-responsive patients with RRMS compared to responsive patients with RRMS following IFN-β treatment for more than one year.29 It seems IFN-β affects miR29b-3p in other immune cells and not Th1 cells in RRMS patients.
There was no significant difference in miR-326 expression in Th17 cells between responsive and non-responsive patients with RRMS. Similarly, Fattahi et al observed no significant difference in miR-326 expression in PBMCs between responsive and non-responsive patients with RRMS.18 Waschbisch et al presented that miR-326 and miR-155 are involved in Th17 differentiation. As well as, they did not observe any significant change in the expression level of the miR-326 in MS patients treated with IFN-β versus untreated MS patients for at least three months.30 It's likely that IFN-β therapy does not restore the expression of deregulated miR-326 and may regulate other involved miRNAs in Th17 development other than miR-326.
of IFN-β including IFN-β1a and IFN-β1b in treated RRMS patients, but they only evaluated the effects of Cinnovex in the patients. Also, the follow-up period is not the same in the two studies.
Different genetic profiles of patients in assessed populations (Isfahan compared to Hamadan) may result in heterogeneous responses to IFN-β treatment in both studies.
Similar to our findings, some studies do not get any significant differences in IL-17 and IL-23 values in patients with RRMS.32 Whereas some findings show decreased levels of IL-17 and IL-23 in responsive patients with MS to IFN-β therapy.33 As well as, MS patients with levels of IL-17F higher than 200 pg/mL were correlated with poor response to treatment.34 Bushnell et al do not find any correlation between IL-17F serum values and response to IFN-β therapy.35 In this study similar to our study, IL-17 levels were lower than 50pg/mL another major difference between us and other studies is that we measured IL-17A plasma values instead of IL-17F. Therefore, IL-17F and IL-17A as single factors could not predict treatment outcome.36 Measurement of a combination of other cytokines in concert with MS pathogenesis and recognition of the synergistic interactions between potent mediators on immune regulation might be helpful to predict response to treatment in patients with RRMS. Besides, cohort studies could be an efficient way to identify immune-based biomarkers of response to treatment and a more correct conclusion; we suggest measurement of baseline levels of these cytokines in MS patients.
There was some limitation in the current study. We investigated IL-17A and IFN-γ levels in the plasma. Diagnostic analysis of cytokine levels in serum or plasma might be influenced by the period between blood collection and arrival in the laboratory. As well as, it is necessary to monitor cytokine at different time points. Also, the volume of blood samples obtained from patients was insufficient, thus it was not possible to perform a complete blood count (CBC) test and to evaluate the absolute number of cells. Furthermore, our sample size was too small. Since a small sample size decreases statistical power. It may be one of the reasons that many of our results have become non-significant.
In conclusion, we observed no significant differences in the percentage of Th1 and Th17 and expression levels of miR29b-3p and miR-326. Therefore, this result may be due to our sample size is small or a cohort study may be needed. Furthermore,
IFN-β may affect other miRNAs in Th1 and Th17 cells rather than miR29b-3p, and miR-326 in MS patients or IFN-β may affect miR29b-3p and miR-326 in other immune cells such as monocytes.
CONFLICT OF INTEREST
The authors declare that there is no conflict of interest concerning this study.
ACKNOWLEDGEMENTS
There is no financial support in this study. The code of ethics committee approval: (IR.MUI.REC.1394.727)
REFERENCES
1. Ma X, Zhou J, Zhong Y, Jiang L, Mu P, Li Y, et al. Expression, regulation and function of microRNAs in multiple sclerosis. Int J Med Sci. 2014;11(8):810-8. 2. Frohmann E RM, Raine CS. Multiple sclerosisthe plaque
and its pathogenesis. N Engl J Med. 2006;354:14. 3. Lassmann H, Bruck W, Lucchinetti CF. The
immunopathology of multiple sclerosis: an overview. Brain Pathol. 2007;17(2):210-8.
4. Confavreux C, Vukusic S. The clinical course of multiple sclerosis. Handb Clin Neurol. 2014;122:343-69.
5. Lovett-Racke AE, Yang Y, Racke MK. Th1 versus Th17: are T cell cytokines relevant in multiple sclerosis? Biochim Biophys Acta. 2011;1812(2):246-51.
6. Du C, Liu C, Kang J, Zhao G, Ye Z, Huang S, et al. MicroRNA miR-326 regulates TH-17 differentiation and is associated with the pathogenesis of multiple sclerosis. Nat Immunol. 2009;10(12):1252-9.
7. Smith KM, Guerau-de-Arellano M, Costinean S, Williams JL, Bottoni A, Mavrikis Cox G, et al. miR-29ab1 deficiency identifies a negative feedback loop controlling Th1 bias that is dysregulated in multiple sclerosis. J Immunol. 2012;189(4):1567-76.
8. Chen C, Zhou Y, Wang J, Yan Y, Peng L, Qiu W. Dysregulated MicroRNA Involvement in Multiple Sclerosis by Induction of T Helper 17 Cell Differentiation. FrontImmunol. (2018);9:1256.
9. Honardoost MA, Kiani-Esfahani A, Ghaedi K, Etemadifar M, Salehi M. miR-326 and miR-26a, two potential markers for diagnosis of relapse and remission phases in patient with relapsing-remitting multiple sclerosis. Gene. 2014;544(2):128-33.
Altered Expression of miR-326 in T Cell-derived Exosomes of Patients with Relapsing-remitting Multiple Sclerosis. Iran J Allergy Asthma Immunol. 2018;(1):108-113.
11. Axtell RC, Raman C, Steinman L. Interferon-beta exacerbates Th17-mediated inflammatory disease. Trends Immunol. 2011;32(6):272-7.
12. Axtell RC, Raman C, Steinman L. Type I interferons: beneficial in Th1 and detrimental in Th17 autoimmunity. Clin Rev Allergy Immunol. 2013;44(2):114-20.
13. Martin-Saavedra FM, Gonzalez-Garcia C, Bravo B, Ballester S. Beta interferon restricts the inflammatory potential of CD4+ cells through the boost of the Th2 phenotype, the inhibition of Th17 response and the prevalence of naturally occurring T regulatory cells. Mol Immunol. 2008;45(15):4008-19.
14. Arellano G, Acuna E, Reyes LI, Ottum PA, De Sarno P, Villarroel L, et al. Th1 and Th17 Cells and Associated Cytokines Discriminate among Clinically Isolated Syndrome and Multiple Sclerosis Phenotypes. Front Immunol. 2017;8:753.
15. Patel N, Rao VA, Heilman-Espinoza ER, Lai R, Quesada RA, Flint AC. Simple and reliable determination of the modified Rankin Scale in neurosurgical and neurological patients: The mRS-9Q.Neurosurgery.2012; 71 (5): 971–5. 16. Hyun, JW, Kim, SH, Jeong, IH,et al.Utility of the Rio score and modified Rio score in Korean patients with multiple sclerosis. PLoS ONE 2015; 10(5).
17. Otaegui, D., Baranzini, S. E., Armañanzas, R., Calvo, B., et al. Differential micro RNA expression in PBMC from multiple sclerosis patients.PloS one.2009; 4(7): 6309. 18. Fattahi M, Sotoodehnejadnematalahi F, Shaygannejad V,
Kazemi M. Comparison of The Expression of miR-326 between Interferon beta Responders and Non-Responders in Relapsing-Remitting Multiple Sclerosis. Cell. 2020;22(1):4.
19. Axtell RC, de Jong BA, Boniface K, van der Voort LF, Bhat R, De Sarno P, et al. T helper type 1 and 17 cells determine efficacy of interferon-beta in multiple sclerosis and experimental encephalomyelitis. Nat Med. 2010;16(4):406-12.
20. Galligan CL ea. Interferon-beta is a key regulator of pro inflammatory events in experimental autoimmune encephalomyelitis. Mult Scler. 2010;16(12):16.
21. Pender MP. Does Epstein-Barr virus infection in the brain drive the development of multiple sclerosis? Brain. 2009;132(12):3196-8.
22. Shimizu Y, Yokoyama K, Misu T, Takahashi T, Fujihara K, Kikuchi S, et al. Development of extensive brain
lesions following interferon beta therapy in relapsing neuromyelitis optica and longitudinally extensive myelitis. J Neurol. 2008;255(2):305-7.
23. van der Pouw Kraan TC, Wijbrandts CA, van Baarsen LG, Voskuyl AE, Rustenburg F, Baggen JM, et al. Rheumatoid arthritis subtypes identified by genomic profiling of peripheral blood cells: assignment of a type I interferon signature in a subpopulation of patients. Ann Rheum Dis. 2007;66(8):1008-14.
24. Wang AG, Lin YC, Wang SJ, Tsai CP, Yen MY. Early relapse in multiple sclerosis-associated optic neuritis following the use of interferon beta-1a in Chinese patients. Jpn J Ophthalmol. 2006;50(6):537-42.
25. Warabi Y, Matsumoto Y, Hayashi H. Interferon beta-1b exacerbates multiple sclerosis with severe optic nerve and spinal cord demyelination. J Neurol Sci. 2007;252(1):57-61.
26. Durelli L, Conti L, Clerico M, Boselli D, Contessa G, Ripellino P, et al. T-helper 17 cells expand in multiple sclerosis and are inhibited by interferon-beta. Ann Neurol. 2009;65(5):499-509.
27. Ramgolam VS, Sha Y, Jin J, Zhang X, Markovic-Plese S. IFN-beta inhibits human Th17 cell differentiation. J Immunol. 2009;183(8):5418-27.
28. Hecker M, Thamilarasan M, Koczan D, Schroder I, Flechtner K, Freiesleben S, et al. MicroRNA expression changes during interferon-beta treatment in the peripheral blood of multiple sclerosis patients. Int J Mol Sci. 2013;14(8):16087-110.
29. Fattahi M, Rezaei N, Nematalahi FS, Shaygannejad V, Fouladi S, Karimi L, et al. MicroRNA-29b variants and MxA expression change during interferon beta therapy in patients with relapsing-remitting multiple sclerosis. Mult Scler Relat Disord. 2019;35:241-5.
30. Waschbisch A, Atiya M, Linker RA, Potapov S, Schwab S, Derfuss T. Glatiramer acetate treatment normalizes deregulated microRNA expression in relapsing remitting multiple sclerosis. PLoS One. 2011;6(9):e24604. 31. Taheri M1,Ghafouri-Fard, Solgi, Sayad, Mazdeh, Omrani.
Determination of cytokine levels in multiple sclerosis patients and their relevance with patients' response to Cinnovex. Cytokine. 2017;96:138-143.
32. Alexander JS, Harris MK, Wells SR, Mills G, Chalamidas K, Ganta VC, et al. Alterations in serum MMP-8, MMP-9, IL-12p40 and IL-23 in multiple sclerosis patients treated with interferon-beta1b. Mult Scler. 2010;16(7):801-9.
treatment on cytokines in multiple sclerosis: significant modulation of IL-17 and IL-23. Cytokine. 2012;59(2):400-2.
34. Hartung HP, Steinman L, Goodin DS, Comi G, Cook S, Filippi M, et al. Interleukin 17F level and interferon beta response in patients with multiple sclerosis. JAMA Neurol. 2013;70(8):1017-21.
35. Bushnell SE ZZ, Stebbins CC, et al. Serum IL-17F does not predict poor response to IM IFNβ-1a in relapsing-remitting MS. Neurology. 2012;79(6):7.