R E S E A R C H
Open Access
Differences between men and women in
self-reported body mass index and its relation to drug
use
Pablo Vera-Villarroel
1*, José A Piqueras
2, Walter Kuhne
1, Pim Cuijpers
3and Annemieke van Straten
3Abstract
Background:Obesity is a public health problem of alarming proportions, including among the university population in Latin America. The purpose of this study was to determine the relation between the self-reported body mass index and the associated drug use and health-risk behaviors.
Methods:We performed a cross-sectional, descriptive study of 3,311 Chilean university students (17–24 years). The variables weight, height, frequency of physical activity, diet quality index, and drug use were evaluated by way of a self-report questionnaire.
Results:16.7% of students were overweight and 2.1% were obese. Higher rates of overweight and obesity were observed in the men compared to women. There was a significant but moderate association between
self-perceived obesity and being men and higher age, and just low with greater use of analgesics and tranquilizers with or without a prescription.
Conclusions:The punctual prevalence rates of self-reported obesity, in this sample, are consistent with other Latin American studies. The risk behaviors associated with perceived obesity in terms of gender, particularly the different pattern of drug use, highlight the importance of considering gender when designing strategies to promote health in a university setting.
Keywords:Overweight, Obesity, Drugs, Health-risk behaviors, University students
Background
The increase and high prevalence of obesity has led the World Health Organization to consider it a chronic disease of epidemic proportions [1]. This condition is a significant modifiable risk factor for most of the main causes of dis-ability and mortality, such as cardiovascular diseases, dia-betes mellitus and osteoarthritis, in both developed [2-4] and developing countries [5]. It has been related to in-creased symptoms of anxiety and depression in adolescents and college students [6-8], and to greater comorbidity with affective, anxiety, and substance disorders, as well as some personality disorders [9,10].
Although there are studies in adult and pediatric popula-tions, and international university populations [11-16],
much less evidence exists regarding Latin America [17]. In Chile, the National Health Survey 2003 (ENS) provided prevalence data for those between the17 and 24 years of age, which indicated that males were 14% overweight, 10% obese and 0.3% morbidly obese, and females were 19.6%, 7.1%, and 1.1%, respectively.
Despite the great number of recent studies on obesity and associated conditions in the Latin American popula-tion [5,17-28], fewer studies explore its relapopula-tion with other health-risk behaviors, including smoking, alcohol and other drug use [1,5].
Specifically, university population studies show a higher prevalence of legal and illegal drug use than in other popu-lations [29], with implications for public health problems, as well as the relationship between drug use and academic performance. Recent studies have shown a relationship be-tween drug use and sexual in dating violence in college and university students. This justifies the need for a more * Correspondence:pablo.vera@usach.cl
1
School of Psychology, Universidad de Santiago de Chile (USACH), Avenida Ecuador 3650, tercer Piso, Estación Central, Santiago de Chile, Chile Full list of author information is available at the end of the article
© 2014 Vera-Villarroel et al.; licensee BioMed Central Ltd. This is an open access article distributed under the terms of the Creative Commons Attribution License (http://creativecommons.org/licenses/by/2.0), which permits unrestricted use, distribution, and reproduction in any medium, provided the original work is properly cited.
specific analysis between various health problems in young people who may be linked to drug use and associated fac-tors [30].
Although very few studies have studied the connection between drug use and obesity or other associated indica-tors (for a recent review about the link between obesity, weight, and drug abuse see Nolan [31], those that have done so have reported a positive relation between alco-hol and tobacco use, poor diet, and body dissatisfaction, and overweight/obesity [23,32]. There are even fewer studies dealing with the issue of possible gender differ-ences. It is well known that there are differences be-tween men and women in the prevalence of mental disorders [23-35], physical diseases [28,36], and risk fac-tors for sexually transmitted diseases, including HIV [37-39]. However, there is much less information with respect to gender differences and weight-related risk fac-tors, and even less on associated factors such as lifestyle or drug use.
Recently, there is some evidence showing different ef-fects of drug use, and BMI in men and women, even dif-ferent effects depending on the type of drug. Some of these studies have examined the relation between the Body Mass Index (BMI) and substance-related disorders [10,40], indicating contradictory findings regarding the linking between overweight/obesity and a greater risk of drugs abuse and dependence throughout life in men or women. However, the specific available literature on these topics shows inconclusive evidence. Epidemio-logical studies seem to suggest that, especially in women, a moderate alcohol consumption can protect against obesity, whereas that a growing consumption of alcohol would increase the risk of obesity [41]. In relation to consumption of cannabis and BMI, literature is contra-dictory showing even that there is no relationship be-tween this consumption and weight in women [42]. A two years follow-up study showed no association be-tween drug use in adolescence and subsequent body weight [43]. Moreover, in men, who took drugs, it was found an association with a lower BMI, but not in women [44]. It has also been reported that overweight men have higher rates of alcohol dependence, whereas the opposite result is found in overweight women, with a lower incidence of alcohol dependence [40]. As can be seen, previous studies show differences in the associa-tions between drug use, and BMI and also that there are gender differences. Additionally, following Nolan [31], most of the reported studies are based on diagnostic cat-egories, and often do not consider the use of drugs and foods.
Given the relevance of the period for young people at university, where poor nutrition, poor psychical exercise habits and access to drugs may increase, studies targeting this population are needed to analyze the possible related
variables both in lifestyle and gender differences and to sug-gest new health policies. However, more evidence is needed from different cultures that permit have specific evidence about the relationship between BMI and drug.
As a result, on the basis of the accumulated evidence reviewed above, the purpose of the present study was to examine the relation between the self-reported BMI and the various risk-associated behaviors, including lack of physical exercise, low quality diet, and especially legal and illegal drug use in both men and women. Specifically, we analyzed the relationship between BMI and drug consumption.
Methods Participants
The data analyzed for this study were taken from the Quality of Life and Health Behaviors Survey, a cross-sectional descriptive study by means of a survey that in-cluded a randomly selected sample representative of the population of students at the University de Santiago de Chile. Respondents were enrolled on a variety of programs, including Administration and Economy, Science, Medical Sciences, Humanities, Engineering, Technology, Chemistry and Biology, Architecture and Bachelor program. They came from 166 of the 346 municipalities (comunas) in which Chile is divided, so that the socio-economic status of the sample can be considered broad and representative of universities from this country. The entire procedure and in-struments were reviewed and approved by the Ethics Com-mittee of the University of Santiago de Chile.
Study sample
The sample comprised 3,311 university students, 1,818 (54.9%) men and 1,493 (45.1%) women, whose mean age
was 19.91 years (SD = 1.74; range = 17–24). The
question-naires were administered during classroom visits. Consent in writing was requested. Therefore, each participant signed an informed written consent that indicated the objectives and responsible researchers of the study. Participation, therefore, was voluntary, anonymous and confidential. In-terviewers were psychologists and they were trained in the administration of the survey by the researchers prior to the administration of the survey 442 questionnaires were in-complete or incorrectly answered and were eliminated.
Measures
National Council on Narcotics Prevention (CONACE) for the National Study of Drugs Use in the General Chilean Population 2008 [45]:
- Consumption of legal and illegal drugs. The items were selected from the same questionnaire developed by the CONACE. It attempts to measure consumption of legal and illegal drugs by means of the following question: When was the last time you tried any of these drugs? Responders
can rated on a scale from 1 to 4 (“1 = Never”, “2 = More
than 1 year ago”, “3 = More than a month, but less than
one year” and“4 = During the past 30 days”. These
ques-tions are grouped into three factors: high-frequency use drugs (alcohol, tobacco and marijuana), medium-frequency use drugs (tranquilizers with or without a prescription and over-the-counter analgesics), and low-frequency use drugs
(illegal drugs –cocaine, heroin, ecstasy, etc., except
marijuana).
- Nutrition aspects and physical activity were assessed using five options from“Never = 1”to“Daily = 5”to evalu-ate the frequency of breakfast, lunch, eating fruit and vege-tables, and doing exercise. The Diet Quality Index consisted of the average score of the first three items. Phys-ical activity was based on the fourth item.
- The weight categories were calculated from self-reported height and weight and based on body mass index. We followed criteria of the World Health Organization (World Health Organization, WHO) [46] for BMI
categor-ies: underweight (BMI≤18.49 kg m-2), normal weight
(BMI = 18.50 to 24.90 kg m-2), overweight (BMI = 25.00 to
29.90 kg m-2) and obesity (BMI≥30.00 kg m-2).
Final questionnaire had 120 items. For a more detailed description of this instruments see the Measures section in Piqueras et al. [21].
Data analysis
The variables were analyzed using descriptive statistics and presented as means (M) and standard deviation (SD) in the
case of the continuous variables, and as percentages in the case of the nominal variables. The differences between
groups were established by means of the Student’s t-test,
ANOVAs for continuous variables and χ2 for categorical
variables. For the comparisons between the four categories of BMI (underweight, normal, overweight and obese), the data were first analyzed for each dependent variable (phys-ical activity, diet quality index, and overall, high-, medium-, and low-frequency drug use) by a Factorial Analysis of Variance (ANOVA), taking weight categories, age and sex as fixed factors. Given that we found some interaction effects of sex with weight categories and of sex, age and weight cat-egories for some tests, we conducted the ANOVAs separ-ately for men and women. In addition to this, Scheffé’s tests were used to determine post-hoc pair-wise comparisons. In order to establish the association between the BMI and sex, age, the diet quality index, physical exercise and drug use were analyzed by multiple regression analysis for the total sample and for men and women separately. As a previous step to the different regression analysis we analyzed the cor-relations between all predictor or independent variables, in order to ensure that these bivariate correlations were less than 0.70 and thus to rule out multicollinearity [47]. Fur-thermore, we computed analysis of multicollinearity which included obtaining Variance Inflation Factor (VIF) and toler-ance value (1-R2). For all variables VIF value was less than 10 and tolerances were all above 0.1. It was not considered then the exclusion of any variable for this reason. The re-sults were considered statistically significant with a
signifi-cance level of≤0.01 due to our sample was large and we
contrasted very many hypothesis tests. The software IBM SPSS 19.0 for Windows was used for the data analyses.
Results
Table 1 shows the general characteristics of the partici-pants with respect to the different variables considered, as well as the gender differences.
Table 1 Mean values and standard deviations (SD) of the anthropometric characteristics, diet quality, physical activity and drug use of university students
Range Total (N = 3311) Men (N = 1818) Women (N = 1493) t3309 pValue
Age (years) 17−24 19.91 (1.74) 19.82 (1.73) 20.03 (1.74) −3.489 0.001***
Weight (kg) 35−170 65.32 (11.72) 71.65 (10.38) 57.61 (8.06) 42.749 0.001***
Height (m) 1,40−1,97 1.69 (0.91) 1.75 (0.06) 1.61 (0.06) 61.930 0.001***
Body Mass Index (BMI) 14,19−63,28 22.86 (3.00) 23.46 (3.00) 22.14 (2.84) 12.931 0.001***
Physical activity (frequency) 1−5 2.87 (1.11) 3.14 (1.06) 2.53 (1.08) 16.267 0.001***
Diet Quality Index (frequency) 4−15 12.20 (2.12) 12.20 (2.12) 12.20 (2.12) −0.041 0.970
Overall drug use 1−4 1.60 (0.37) 1.61 (0.36) 1.59 (0.37) 1.568 0.120
High-frequency drug use 1−4 2.54 (0.88) 2.60 (0.88) 2.48 (0.88) 4.093 0.001***
Medium-frequency drug use 1−4 1.23 (0.47) 1.20 (0.43) 1.28 (0.52) −4.823 0.001***
Low-frequency drug use 1−4 1.04 (0.17) 1.05 (0.18) 1.03 (0.15) 3.158 0.002***
*p < 0.05, **p < 0.01, ***p < 0.005.
With regard to weight categories based on BMI (Table 2), a prevalence of 16.7% overweight and 2.1% obesity was found. The analysis by gender revealed that
men’s overweight and obesity rates were double those of
women (24.5% and 11.6%, respectively). Among the fe-male students, values of normal weight were more
fre-quently found, but there was also underweight
compared to the men (χ2 = 108.932, df = 3; p = 0.001).
The results for the total sample show significant differ-ences among the weight categories (obesity, overweight, normal weight and underweight) based on the BMI for age, physical activity, and overall, high-, medium-, and
low-frequency drug use (See Table 3). Post-hoc Scheffe’s
tests confirmed that this was due to the obese group had more age and overall use of drugs than the underweight group; more age, use of medium-frequency and low-frequency drugs than the normal group; and more use of medium-frequency drugs than the overweight group. For the overweight group, post-hoc comparison showed this group had more age, physical activity, overall drugs use and high-frequency drug use than the underweight and normal groups. Regarding the normal group, it displayed more psychical activity and use of high-frequency drugs than the underweight group (see Table 3).
In the sample of male participants, statistically signifi-cant differences were found among weight categories for age, physical activity, diet quality index and drug use, particularly medium- and low-frequency drug use.
Add-itionally, the Scheffé’s post-hoc comparisons indicated
that students in the overweight category were older than those who were at normal weight; that the students who were obese did less physical exercise than those who had normal weight, and had greater use of medium-frequency (such as analgesics and tranquilizers) and high-frequency drugs (illegal drugs, except marijuana) (see Table 4).
Among the female participants, statistically significant differences were found for age and drug use, namely high- and medium-frequency drug use. Specifically, the
Scheffé’s post-hoc comparisons found that there were
significant differences related to a greater age of the stu-dents with obesity compared to the normal and under-weight groups, and a greater age of the group with overweight compared to those with normal weight. Fur-thermore, the female students in the overweight category
scored significantly higher in high-frequency drug use compared to those in the underweight category, whereas, for medium-frequency drug use, females in the obesity category showed higher scores than those with normal weight (see Table 5).
The results of the multiple regression analysis showed
that sex, (d =−0.44), age (0.27), and use of
medium-frequency drugs (d = 0.07) correlated positively with BMI. The multiple regression model used on the sample of male students indicated that age and medium-frequency drug use were positively and directly related to BMI (d = 0.23 and d = 0.07, respectively). As for the multiple regression model applied to the sample of fe-male students, the only variable that showed significant correlation with BMI was age (d = 0.15) (See Table 6).
Discussion and conclusions
The levels of BMI of the studied sample were note-worthy from a public health point of view. 16.7% of the students reported being overweight, and 2.1% of being obese. These values are lower than the rates of reported obesity prevalence for the general adult population in Latin America, which is between 9.9% and 35.7% [18,19,48,49] and in Spain, where a higher prevalence of obesity (14.5-22.3%) and overweight (18.7-37.6%) has been reported [20,49]. These prevalence rates were equivalent to the rates of overweight (16.5%), but lower than those of obesity (9.25%) as reported by the last ENS of the Government of Chile in 2003 [20]. These data are consistent with other studies that indicate that over-weight and obesity are up to 2 times less frequent in people with a higher level of education [49]. These per-centages are very similar to the results found by studies of Spanish-speaking university populations (overweight: 10.9-21.8% and obesity: 1.3-18%) [11,17,23,50] or the study by Lowry et al. of American university populations (obesity and overweight: 27.4%) [12].
Our study also showed that the mean BMI was signifi-cantly higher in the male students than in the females in the general sample and that there was a higher obesity and overweight rate among the males (24.5% compared to 11.6% of the women). Our data indicates that the problem is more significant for male students than for females, unlike the ENS Chile 2003 [20], which provided similar figures for both genders between 17 and 24 years of age (24.3% and 27.8%, respectively). Nevertheless, this data is consistent with that from in other studies con-ducted on university populations in Chile [50] (over-weight in men 43.8% and women 32.4%; obesity in men 23.2% and women 21.5%), Spain [11] (25% of men with overweight or obesity compared to 13.9% of women), and the United States [12], where 41.3% of the men were obese or overweight compared to 29.9% of the women. Table 2 Percentage distribution of the weight categories
based on body mass index according to the WHO [46] of university students
Underweight Normal Overweight Obesity
Male 1.8 73.7 21.9 2.6
Female 5.1 83.3 10.3 1.3
Total 3.3 78.0 16.7 2.1
Table 3 Relation between weight categories and age, diet quality index, smoking habit, physical activity and current drug use based on BMI classification
Underweight U M (SD)
Normal N M (SD)
Overweight Ov M (SD)
Obesity Ob M (SD)
Total M (SD)
df F p Post hoc
U v N U v Ov U v Ob N v Ov N v Ob Ov v Ob
Age (years) 19.72 (1.71) 19.83 (1.71) 20.26 (1.80) 20.54 (1.97) 19.91 (1.74) 3, 3299 12.547 0.001*** * * *** *
Physical activity (frequency) 2.60 (1.14) 2.87 (1.13) 2.91 (1.05) 2.65 (0.94) 2.86 (1.11) 3, 3262 3.341 0.018* * ** *
Diet Quality Index (frequency) 12.36 (2.22) 12.24 (2.11) 12.05 (2.14) 12.04 (1.89) 12.21 (2.12) 3, 3264 1.392 0.243
Overall drug use 1.53 (0.40) 1.60 (0.36) 1.65 (0.36) 1.72 (0.51) 1.60 (0.37) 3, 3226 6.961 0.001*** * * *
High-frequency drug use 2.27 (0.92) 2.53 (0.88) 2.65 (0.88) 2.63 (0.94) 2.54 (0.88) 3, 3260 6.797 0.001*** * ** *
Medium-frequency drug use 1.27 (0.55) 1.22 (0.46) 1.24 (0.47) 1.45 (0.74) 1.23 (0.47) 3, 3267 5.293 0.001** ** *
Low-frequency drug use 1.03 (0.12) 1.04 (0.16) 1.05 (0.17) 1.09 (0.35) 1.04 (0.17) 3, 3242 3.028 0.028* *
Total sample.
Note: Significance levels for each ANOVA and Scheffé’s post-hoc comparison are depicted by: *p < 0.05, **p < 0.01, ***p < 0.005.
Vera-Villarro
el
et
al.
Substance
Abuse
Treatment,
Prevention
,and
Policy
2014,
9
:1
Page
5
o
f
1
1
http://ww
w.substance
abusepolicy.co
m/conten
Table 4 Relation between weight categories and age, diet quality index, smoking habit, physical activity and current drug use based on BMI classification
Underweight U M (SD)
Normal N M (SD)
Overweight Ov M (SD)
Obesity Ob M (SD)
Total M (SD)
df F p Post hoc
U v N U v Ov U v Ob N v Ov N v Ob Ov v Ob
Age (years) 19.30 (1.61) 19.71 (1.69) 20.15 (1.82) 20.29 (1.77) 19.82 (1.73) 3, 1812 8.727 0.001*** ***
Physical activity (frequency) 2.85 (1.09) 3.19 (1.07) 3.07 (1.02) 2.67 (0.95) 3.14 (1.06) 3, 1792 5.466 0.001** **
Diet Quality Index (frequency) 12.45 (2.03) 12.28 (2.11) 11.97 (2.15) 11.64 (1.96) 12.20 (2.12) 3, 1794 3.585 0.013*
Overall drug use 1.54 (0.46) 1.60 (0.35) 1.65 (0.37) 1.73 (0.53) 1.61 (0.36) 3, 1779 4.193 0.006**
High-frequency drug use 2.34 (1.09) 2.58 (0.86) 2.67 (0.89) 2.69 (0.94) 2.60 (0.88) 3, 1794 2.136 0.094
Medium-frequency drug use 1.22 (0.62) 1.18 (0.40) 1.23 (0.48) 1.38 (0.70) 1.19 (0.43) 3, 1801 4.662 0.003** **
Low-frequency drug use 1.05 (0.18) 1.04 (0.16) 1.05 (0.18) 1.12 (0.40) 1.05 (0.18) 3, 1788 2.895 0.034* *
Men.
Note: Significance levels for each ANOVA and Scheffé’s post-hoc comparison are depicted by: *p < 0.05, **p < 0.01, ***p < 0.005.
Vera-Villarro
el
et
al.
Substance
Abuse
Treatment,
Prevention
,and
Policy
2014,
9
:1
Page
6
o
f
1
1
http://ww
w.substance
abusepolicy.co
m/conten
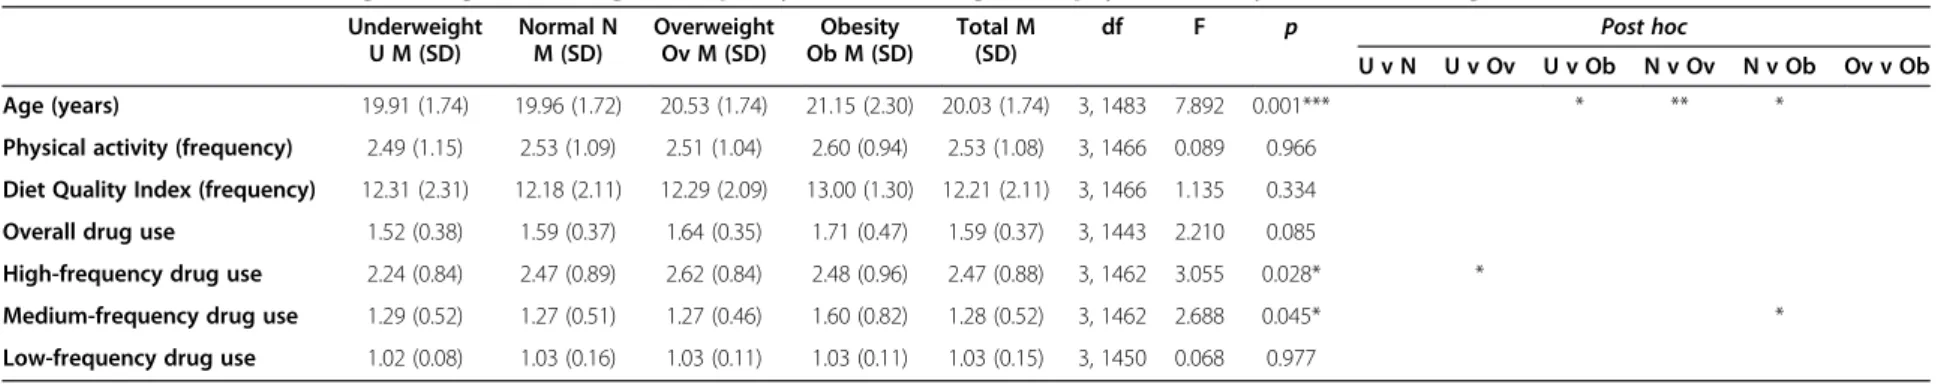
Table 5 Relation between weight categories and age, diet quality index, smoking habit, physical activity and current drug use based on BMI classification
Underweight U M (SD)
Normal N M (SD)
Overweight Ov M (SD)
Obesity Ob M (SD)
Total M (SD)
df F p Post hoc
U v N U v Ov U v Ob N v Ov N v Ob Ov v Ob
Age (years) 19.91 (1.74) 19.96 (1.72) 20.53 (1.74) 21.15 (2.30) 20.03 (1.74) 3, 1483 7.892 0.001*** * ** *
Physical activity (frequency) 2.49 (1.15) 2.53 (1.09) 2.51 (1.04) 2.60 (0.94) 2.53 (1.08) 3, 1466 0.089 0.966
Diet Quality Index (frequency) 12.31 (2.31) 12.18 (2.11) 12.29 (2.09) 13.00 (1.30) 12.21 (2.11) 3, 1466 1.135 0.334
Overall drug use 1.52 (0.38) 1.59 (0.37) 1.64 (0.35) 1.71 (0.47) 1.59 (0.37) 3, 1443 2.210 0.085
High-frequency drug use 2.24 (0.84) 2.47 (0.89) 2.62 (0.84) 2.48 (0.96) 2.47 (0.88) 3, 1462 3.055 0.028* *
Medium-frequency drug use 1.29 (0.52) 1.27 (0.51) 1.27 (0.46) 1.60 (0.82) 1.28 (0.52) 3, 1462 2.688 0.045* *
Low-frequency drug use 1.02 (0.08) 1.03 (0.16) 1.03 (0.11) 1.03 (0.11) 1.03 (0.15) 3, 1450 0.068 0.977
Women.
Note: Significance levels for each ANOVA and Scheffé’s post-hoc comparison are depicted by: *p < 0.05, **p < 0.01, ***p < 0.005.
Vera-Villarro
el
et
al.
Substance
Abuse
Treatment,
Prevention
,and
Policy
2014,
9
:1
Page
7
o
f
1
1
http://ww
w.substance
abusepolicy.co
m/conten
As far as the behavioral risk factors associated with overweight/obesity, our data indicates that male students with obesity or overweight were older, less physically ac-tive, had a worse diet (but non-significant) and admitted to more frequent drug use, particularly analgesics and tranquilizers with or without prescription, and also, al-though to a lesser extent, drugs like cocaine, heroin, or ecstasy.
On the other hand, in the group of female participants, it was also found that obesity and overweight were re-lated to a older age and a more abusive use of drugs de-fined as medium frequency (analgesics and tranquilizers with or without a prescription).
The positive correlation found between BMI and age is a connection that appears unequivocally in most in-vestigations conducted in this field [23,24]. In relation to physical activity, the male students had a higher mean of frequency of physical activity than the female students. Our data indicate that this variable was related to the BMI among the male participants, whereas this was not the case among the female participants. Although it seems logical to think that the obese or overweight par-ticipants are less active than those of normal weight, we found contradictory results in the scientific literature reviewed [51]. Some studies did not find this link either for male or female students despite showing that the men are the group that does more physical exercise in their free time [24], whereas others indicated that the re-lation between BMI and physical activity are relevant only among the men [21,52,53]. Independent of the dif-ferences found in the data in different studies, it seems that the link between obesity and a sedentary lifestyle has been established [1,12,19,21,22,52]. In any case, our
data add the idea that the student’s gender is a relevant
variable we must consider when designing strategies to promote physical activity and sports in order to confront and avoid the possible health risks derived from physical inactivity.
Although in the general sample there were no differ-ences between the men and women with respect to the diet quality index, our results indicate that diet quality is associated with overweight and obesity in the population studied, particularly among the men. These data are consistent with the literature, which has described the effects of diet quality on health, as well as the associ-ation between diet quality and overweight and obesity, indicating that overweight or obese participants score significantly lower on these indicators compared to those of normal weight [11]. There is no real consensus with regard to gender-based differences, but Arroyo et al. [11] found in both the general sample and the male subjects that the mean score for the quality index was signifi-cantly lower in those with overweight or obesity than those of normal weight. Other studies have also reported higher scores among the men compared to the women in the mean value of a Diet Quality Index [54] and in the inadequacy of dietary habits [17].
With respect to drug use in general, the use of medium-frequency drugs, such as tranquilizers with or without a prescription and over-the-counter analgesics, correlated positively with BMI. Regarding male partici-pants, that showed greater use and higher consumption of frequently used legal and illegal drugs (alcohol, to-bacco and marijuana) and less-frequently used illegal drugs (cocaine, heroin, ecstasy, etc.). In contrast, drug use with or without prescription such as analgesics and tranquilizers were more frequent among female partici-pants. These data are compatible with studies of the general and university populations [23,45,55].
Following Nolan [31], there is some evidence about the association between active drug uses with normal (or even low) body weight, although there are also some contradictions between studies with clinical and nonclin-ical populations, and when gender is considered. In this sense, one aspect that must be emphasized in our study is the link found between obesity and overweight and Table 6 Multiple regression analysis of the determining factors of the body mass index (BMI) of university students
Dependent variable Prognostic variable Totala Menb Womenc
β T3202 p β t p β T p
Body Mass Index (BMI) Constant 25.87 0.001* 17.61 0.001* 15.80 0.001***
Sex −0.23 −12.63 0.001*
Age (years) 0.13 7.76 0.001*** 0.15 6.43 0.001*** 0.11 4.29 0.001***
Physical activity (frequency) −0.02 −0.98 0.32 −0.03 −1.09 0.274 −0.01 −0.07 0.940
Diet Quality Index (frequency) −0.02 −0.99 0.32 −0.04 −1.81 0.070 0.02 0.59 0.553
High-frequency drug use 0.02 1.42 0.16 0.01 0.24 0.810 0.05 1.77 0.076
Medium-frequency drug use 0.04 2.07 0.03* 0.05 2.02 0.043* 0.03 1.08 0.280
Low-frequency drug use 0.01 0.83 0.41 0.02 0.95 0.341 −0.01 −0.08 0.932
a
r = 0.26; r2
= 0.07.b
r = 0.18; r2
= 0.03.c
r = 0.13; r2
0.02. *p < 0.05, **p < 0.01, ***p < 0.005.
drug use. We found that the overweight and obese male participants showed greater use of pharmaceutical sub-stances and less use of low-frequency drugs (such as cocaine, heroin, ecstasy, etc.), whereas the female partici-pants with overweight problems used tobacco, alcohol and marijuana more, which are high-use drugs. These results are somewhat consistent with what was reported by a previous study, which indicated that obesity in men was associated with alcohol consumption, while in women it was associated with smoking [15,16,40]. A ten-tative explanation for this findings is that we did not control the presence of substance use disorders or any other mental disorders among the participants, so It is possible that some of the subjects would meet criteria for some of them and it would explain the relationship between pharmaceutical drug use and the increasing of consumption of food and ultimately to weight gain. In this sense Nolan [31] found an association between the recovery from drug dependence and the increase of con-sumption of food and weight gains. Anyway, regardless of this explanation, this could indicate two interesting aspects of the risk behaviors of Chilean university stu-dents. First of all, the data could indicate a change in the consumption pattern of legal drugs and marijuana
among university women, matching the men’s rates of
drug use. This phenomenon has already been confirmed in Spanish samples [56]. Secondly, it reflects the relation between different unhealthy behaviors: higher Body Mass Index, poor dietary control, less exercise, and greater substance use. In this sense, some authors have indicated repeatedly that risk behaviors tend to go to-gether, compared to healthy behaviors; see Jessor [57].
It must be considered some limitations of the present study. First of all, it should be noted that there is no refer-ence on the validation of the questionnaire used. However, it is used for and was provided by the government agency responsible for the prevention of alcohol and other drugs. Second, it must be considered a limitation that participants’ anthropometric measurements were not taken directly. Nevertheless, various works on the university population have used self-reporting [12,26,58]. Although there is a ten-dency to overestimate height and underestimate weight, it
has been proven that an individual’s statement of their
weight and height is a valid and trustworthy estimation [58,59]. Furthermore, the fact that the measurements in the present study were self-reported and therefore the data such as the BMI were related to perception and not com-pletely objective shows advantages and information for pro-motion and prevention in health care. In fact, it is well known that the subjective variables involved may give us a
better report of the participants’ perception and image.
These variables related to beliefs, expectations, attitudes, health-related quality of life have shown a great relevance in relation to health behaviors [60-65] and can be more
useful for understanding the causes for and perpetuation of health behaviors. Third, regarding drug use, the assessment of these behaviors by self-report method recommends cau-tion in generalizacau-tion of findings. The ideal alternative is to evaluate these variables through more invasive methods such as drug testing, however this method is not viable for studies with large samples. Thus, we opted to get this infor-mation through self-reported inforinfor-mation mode showing a trend in a representative sample.
Secondly, the correlations found using the multiple re-gression analysis, despite being significant, must be con-sidered weak as they may be a result of the large sample size used; nevertheless, a tendency has been shown that should be borne in mind in future studies.
Samples of other age levels are required, the results of which can extend and contrast the information that has been presented here. It is also suggested that longitu-dinal studies be undertaken that consider these same variables so as to be more certain of the influence of these risk behaviors on obesity, and that differential evo-lutionary trajectories be analyzed on the basis of age and gender. Furthermore, there are other factors, such as so-cioeconomic factors, amount of education, previously existing medical conditions, etc. that should be address in future studies.
In conclusion, the data of the present study can provide us with a better depiction of the variables present at the base of this population’s lifestyle aimed at future prevention strategies more than only having objective measurements. Specifically, our findings highlight that prevention and intervention policies should consider differences between men and women to improve the effectiveness of campaigns of prevention and health education on consumption and use of drugs, as well as for the promotion of healthy life-styles. Not considering the gender differences may be one of the variables that could explain the failure of many pub-lic health campaigns. An intervention without bearing in mind individual variables, such as in this case the gender as well as the political and sociocultural differences, would help improve the effectiveness of interventions, as verified in other Latin American countries [66].
Finally, the data in this study support this thesis and underscore both the possibility that obesity and overweight and drug use may be more related than was initially thought as well as the need to extend the scope of prevent-ive interventions to college students [67-69].
Competing interests
The authors declare that they have no competing interests.
Authors’contributions
All authors contributed equally in the design of the study. PVV and JAP oversaw all aspects of its implementation, performed the statistical analysis and prepared the manuscript. WK and PVV acquired funding and permissions for the research, collected the data and assisted in drafting of the manuscript. PC and AVS gave statistical expertise, assisted in
interpretation of data analysis and revised the manuscript for intellectual content. All authors read and approved the final manuscript.
Acknowledgements
This research was carried out thanks to the funding from the Vicerrectoría de Gestión y Desarrollo Estudiantil de la Universidad de Santiago de Chile. The preparation of this article was partially supported by two grants awarded to the second author from the Carolina Foundation and the Valencian Community (BEST/2010/118) for research stays abroad at the School of Psychology of the University of Santiago de Chile and the Department of Clinical Psychology of the VU University Amsterdam, respectively.
Author details
1School of Psychology, Universidad de Santiago de Chile (USACH), Avenida Ecuador 3650, tercer Piso, Estación Central, Santiago de Chile, Chile. 2Department of Health Psychology, Universidad Miguel Hernández de Elche, Edif, Altamira, Avda. de la Universidad s/n, 03202, Elche, Alicante, Spain. 3Department of Clinical Psychology, VU University Amsterdam, Van der Boechorststraat 1, 1081 BT Amsterdam, The Nederlands.
Received: 31 January 2013 Accepted: 1 December 2013 Published: 2 January 2014
References
1. Gutiérrez-Fisac J, Angel Royo-Bondonada M, Rodríguez-Artalejo F: [Health-risks associated with Western diet and sedentariness: the obesity epide-mia].Gac Sanit2006,20:48–54.
2. Vioque J, Ramos JM, Navarrete-Munoz EM, De La Hera MG:Spanish scien-tific production in obesity research published in PubMed (1988–2007). Gac Sanit2010,24:225–232.
3. Pujolar AE:Social determinants vs. lifestyle in type 2 diabetes mellitus in Andalusia (Spain): difficulty in making ends meet or obesity?Gac Sanit 2009,23:427–432.
4. Zárate A, Crestto M, Maiz A, Ravest G, Pino M, Valdivia G, Moreno M, Villarroel L:[Influence of obesity on health care costs and absenteeism among employees of a mining company].Rev Méd Chile2009, 137:337–344.
5. Bautista LE, Casas JP, Herrera VM, Miranda JJ, Perel P, Pichardo R, González A, Sanchez JR, Ferreccio C, Aguilera X, Silva E, Oróstegui M, Gómez LF, Chirinos JA, Medina-Lezama J, Pérez CM, Suárez E, Ortiz AP, Rosero L, Schapochnik N, Ortiz Z, Ferrante D:Latin-american consortium of studies in obesity (LASO): The Latin American Consortium of Studies in Obesity (LASO).Obes Rev2009,10:364–370.
6. Beltrán MC, Freyre MA, Hernández-Guzmán L:[The beck depression inventory: its validity in adolescent population].Ter Psicol2012,30:5–13. 7. Antúnez Z, Vinet EV:Depression anxiety stress scales (DASS–21):
validation of the abbreviated version in Chilean University Students. Ter Psicol2012,30:49–55.
8. Araya R, Montero-Marin J, Barroilhet S, Fritsch R, Montgomery A:Detecting depression among adolescents in Santiago, Chile: sex differences. BMC Psychiatry2013,13:122.
9. Carrasco D, Gómez E, Staforelli A:[Obesity and adolescence: exploration of relational and emotional aspects].Ter Psicol2009,27:143–149. 10. Petry NM, Barry D, Pietrzak RH, Wagner JA:Overweight and obesity are
associated with psychiatric disorders: results from the national epidemiologic survey on alcohol and related conditions.Psychosom Med 2008,70:288–297.
11. Arroyo M, Rocandio AM, Ansotegui L, Pascual E, Salces I, Rebato E:[Diet quality, overweight and obesity in university students].Nutr Hosp2006, 21:673–679.
12. Lowry R, Galuska DA, Fulton JE, Wechsler H, Kann L, Collins JL:Physical activity, food choice, and weight management goals and practices among US college students.Am J Prev Med2000,18:18–27.
13. Blüml V, Kapusta N, Vyssoki B, Kogoj D, Walter H, Lesch OM:Relationship between substance use and body mass index in young males.Am J Addict2011,21:72–77.
14. Baek S-I, So W-Y:Association between weight status and recreational drug abuse in Korean adolescents.Cent Eur J Med2012,7:224–229. 15. Nolan LJ, Stoltz MR:Drug use is associated with elevated food
consumption in college students.Appetite2012,58:898–906.
16. Nolan LJ:Association between impulsiveness and pleasantness ratings for food and drugs.Appetite2012,59:e43.
17. Vargas-Zárate M, Becerra-Bulla F, Prieto-Suárez E:[Anthropometric evalu-ation of university students in Bogotá, Colombia].Rev Salud Publica (Bogota)2008,10:433–442.
18. Filozof C, Gonzalez C, Sereday M, Mazza C, Braguinsky J:Obesity prevalence and trends in Latin-American countries.Obes Rev2001,2:99–106. 19. Vio F, Albala C, Kain J:Nutrition transition in Chile revisited: mid-term
evaluation of obesity goals for the period 2000–2010.Public Health Nutr 2008,11:405–412.
20. MdSeINd E:Encuesta Nacional de Salud (ENS) 2003.Ministerio de Salud: Santiago de Chile; 2004.
21. Gomez LM, Hernandez-Prado B, Morales MC, Shamah-Levy T:Physical activ-ity and overweight/obesactiv-ity in adult mexican population: the mexican na-tional health and nutrition survey 2006.Salud Publica Mex2008, 51:621–629.
22. Morales-Ruan Mdel C, Hernandez-Prado B, Gomez-Acosta LM, Shamah-Levy T, Cuevas-Nasu L:Obesity, overweight, screen time and physical activity in Mexican adolescents.Salud Publica Mex2009,51:613–620.
23. Moreno E, Vázquez L, Gutiérrez G, Martínez M, Quevedo M, González R, Salas G:[A pilot study on obesity prevalence and health habits in Mexican college students].Int J Psychol Psychol Ther2004,4:623–638. 24. Arroyo P, Loria A, Fernandez V, Flegal KM, Kuri-Morales P, Olaiz G,
Tapia-Conyer R:Prevalence of pre-obesity and obesity in urban adult Mexicans in comparison with other large surveys.Obes Res2000,8:179–185. 25. Flores G, Ruiz F, García M:Relationship between some biological and
demographics factors with physical-sport practice in college students. A case study of Guadalajara University, Mexico.Rev Int Cienc Deporte2009, 5:59–80.
26. Ruiz-Arregui L, Castillo-Martinez L, Orea-Tejeda A, Mejia-Arango S, Miguel-Jaimes A:Prevalence of self-reported overweight-obesity and its associ-ation with socioeconomic and health factors among older Mexican adults.Salud Publica Mex2007,49:482–487.
27. Vera-Villaroel P, Bastias A, Mena L:[Toward the construction of a scale of beliefs ofobesity in children (ECOI)].Rev Mex Psicol2004,21:191–201. 28. Piqueras JA, Kuhne W, Vera-Villarroel P, van Straten A, Cuijpers P:Happiness
and health behaviours in Chilean college students: a cross-sectional sur-vey.BMC Public Health2011,11:443.
29. Rehm J, Taylor B, Room R:Global burden of disease from alcohol, illicit drugs and tobacco.Drug Alcohol Rev2006,25:503–513.
30. Twisk JW, Kemper HC, Van Mechelen W, Post GB:Clustering of risk factors for coronary heart disease. the longitudinal relationship with lifestyle. Ann Epidemiol2001,11:157–165.
31. Nolan LJ:Shared urges? The links between drugs of abuse, eating, and body weight.Curr Obes Rep2013,2:150–156.
32. Mediano-Stoltze F, Repetto PB, Molina Y:Body dissatisfaction, beliefs about weight control, and cigarette use among youth.Ter Psicol2013,31:155–163. 33. McLean CP, Asnaani A, Litz BT, Hofmann SG:Gender differences in anxiety
disorders: prevalence, course of illness, comorbidity and burden of illness.J Psychiatr Res2011,45:1027–1035.
34. Pimentel M, Cova F:[Depressive rumination and worry in the development of depressive and anxious symptoms in University students].Ter Psicol2011,29:43–52.
35. Micin S, Bagladi V:[Mental health in university students: incidence of psychopathology and suicidal behavior data in the student health service users].Ter Psicol2011,29:53–64.
36. Perz J, Ussher JM, Butow P, Wain G:Gender differences in cancer carer psychological distress: an analysis of moderators and mediators.Eur J Cancer Care (Engl)2011,20:610–619.
37. Castro A, Bermudez MP, Buela-Casal G, Madrid J:[Psychosocial variables re-lated to sexual debut in adolescents in Spain].Rev Latinoam Psicol2011, 43:83–94.
38. Teva I, Bermudez MP, Buela-Casal G:Sexual sensation seeking, social stress, and coping styles as predictors of HIV/STD risk behaviors in ado-lescents.Youth Soc2010,42:255–277.
39. Gonzalez MA, Martin L, Munoz S, Jacobson JO:Patterns, trends and sex differences in HIV/AIDS reported mortality in Latin American countries: 1996–2007.BMC Public Health2011,11:605.
41. Yeomans MR:Alcohol, appetite and energy balance: is alcohol intake a risk factor for obesity?Physiol Behav2010,100:82–89.
42. Warren M, Frost-Pineda K, Gold M:Body mass index and marijuana use. J Addict Dis2005,24:95–100.
43. Pasch KE, Velazquez CE, Cance JD, Moe SG, Lytle LA:Youth substance use and body composition: does risk in one area predict risk in the other? J Youth Adolesc2012,41:14–26.
44. Pickering RP, Goldstein RB, Hasin DS, Blanco C, Smith SM, Huang B, Pulay AJ, Ruan WJ, Saha TD, Stinson FS, Dawson DA, Chou SP, Grant BF:Temporal relationships between overweight and obesity and DSM-IV substance use, mood, and anxiety disorders: results from a prospective study, the national epidemiologic survey on alcohol and related conditions.J Clin Psychiatry2011,72:1494–1502.
45. Consejo Nacional para el Control de Estupefacientes (CONACE):Octavo Estudio Nacional de Drogas en Población General de Chile 2008.Santiago de Chile: CONACE; 2009.
46. World Health Organization:Obesity: Preventing and Managing the Global Epidemic. Report of A WHO Consultation on Obesity.Geneva: WHO; 1997. 47. Tabachnick BG, Fidell LS:Using multivariate statistics.3rd edition. New York:
Harper Collins College Publisher; 1996.
48. Cardone A, Borracci R, Milin E:[Long-term estimation of the prevalence of obesity in Argentina].Rev Argent Cardiol2009,78:28–29.
49. Aranceta J, Moreno B, Moya M, Anadon A:Prevention of overweight and obesity from a public health perspective.Nutr Rev2009,67:83–88. 50. Aránguiz H, García V, Rojas S:[Descriptive, comparative and correlational
study of nutritional and cardio-respiratory condition of chilean universi-tary students].Rev Chil Nutr2010,37:70–78.
51. Williams PT:Attenuating effect of vigorous physical activity on the risk for inherited obesity: a study of 47,691 runners.PLoS One2012,7:e31436. 52. Gómez M, Ruiz F, García M, Granero A, Piéron M:[Reasons mentioned by
university student who practice physical and sporting activities]. Rev Latinoan Psicol2009,41:519–532.
53. Calderon LL, Johnston PK, Lee JW, Haddad EH:Risk factors for obesity in Mexican-American girls: dietary factors, anthropometric factors, and physical activity.J Am Diet Assoc1996,96:1177–1179.
54. Satalic Z, Baric IC, Keser I, Maric B:Evaluation of diet quality with the mediterranean dietary quality index in university students.Int J Food Sci Nutr2004,55:589–597.
55. Romero M, Santander J, Hitschfeld M, Labbé M, Zamora V:[Smoking and alcohol drinking among medical students at the Pontificia Universidad Católica de Chile].Rev Méd Chile2009,17:361–368.
56. Alfonso J, Huedo-Medina T, Espada J:[Risk factors predictors of the pat-tern of substance use during the adolescence].Anal Psicol2009, 25:330–338.
57. Jessor R:Adolescent Development and Behavioral Health. InBehavioral Health: A Handbook of Health Enhancement and Disease Prevention.Edited by Matarazzo J. New York: John Wiley; 1984.
58. Galan I, Gandarillas A, Febrel C, Meseguer C:[Validation of self-reported weight and height in an adolescent population].Gac Sanit2001, 15:490–497.
59. Bes-Rastrollo M, Sabate J, Jaceldo-Siegl K, Fraser GE:Validation of self-reported anthropometrics in the Adventist Health Study 2.BMC Public Health2011,11:213.
60. Elfeddali I, Bolman C, Candel MJ, Wiers RW, De Vries H:The role of self-efficacy, recovery self-self-efficacy, and preparatory planning in predicting short-term smoking relapse.Br J Health Psychol2012,17:185–201. 61. Gillison F, Sebire S, Standage M:What motivates girls to take up exercise
during adolescence? Learning from those who succeed.Br J Health Psychol2001. doi:10.1111/j.2044-8287.2011.02053.x.
62. Huebner DM, Neilands TB, Rebchook GM, Kegeles SM:Sorting through chickens and eggs: a longitudinal examination of the associations between attitudes, norms, and sexual risk behavior.Health Psychol2011, 30:110–118.
63. Piqueras JA, Orgiles M, Espada JP, Carballo JL:[Health-related quality of life across weight categories in childhood].Gac Sanit2012,26:170–173. 64. Ramos V, Piqueras JA, Martinez-Gonzalez AE, Oblitas LA:[Emotion and
cog-nition: implications for treatment].Ter Psicol2009,27:227–237.
65. Liao Y, Harada K, Shibata A, Ishii K, Oka K, Nakamura Y, Inoue S, Shimomitsu T:Association of self-reported physical activity patterns and socio-demographic factors among normal-weight and overweight Japanese men.BMC Public Health2012,12:278.
66. López-López W, Pineda-Marín C, Mullet E:Education and prevention as principal components in attitudes toward drugs policies.Ter Psicol2012, 30:119–126.
67. Al-Hazzaa HM, Abahussain NA, Al-Sobayel HI, Qahwaji DM, Musaiger AO: Lifestyle factors associated with overweight and obesity among Saudi adolescents.BMC Public Health2012,12:254.
68. Shamah Levy T, Morales Ruán C, Amaya Castellanos C, Salazar Coronel A, Jiménez Aguilar A, Méndez Gómez Humarán I:Effectiveness of a diet and physical activity promotion strategy on the prevention of obesity in Mexican school children.BMC Public Health2012,12:152.
69. Kain J, Leyton B, Concha F, Salazar G, Lobos L, Vio F:[Effect of counselling school teachers on healthy lifestyle on the impact of a program to reduce childhood obesity].Rev Med Chil2010,138:181–187.
doi:10.1186/1747-597X-9-1
Cite this article as:Vera-Villarroelet al.:Differences between men and women in self-reported body mass index and its relation to drug use.
Substance Abuse Treatment, Prevention, and Policy20149:1.
Submit your next manuscript to BioMed Central and take full advantage of:
• Convenient online submission
• Thorough peer review
• No space constraints or color figure charges
• Immediate publication on acceptance
• Inclusion in PubMed, CAS, Scopus and Google Scholar
• Research which is freely available for redistribution
Submit your manuscript at www.biomedcentral.com/submit

![Table 2 Percentage distribution of the weight categories based on body mass index according to the WHO [46] of university students](https://thumb-us.123doks.com/thumbv2/123dok_us/8118218.2152902/4.892.83.435.1015.1099/table-percentage-distribution-weight-categories-according-university-students.webp)