TECHNICAL UNIVERSITY OF CLUJ-NAPOCA
ACTA TECHNICA NAPOCENSIS
Series: Applied Mathematics, Mechanics, and Engineering Vol. 60, Nr. III, September, 2017
BUSES FLEET MAINTENANCE OPTIMIZATION, USING COMPUTER
SIMULATION METHODS
George-Horea CRIȘAN, Nicolae FILIP
Abstract: This paper aims to identify the negative consequences of non-compliance revisions program of an
urban public transport fleet and also identifying ways to optimize maintenance activity, through a case study conducted using a database management system and a data simulation program. Theresearch has been carried out based on academic literature and carriers concrete maintenance problems and it has proposed finding directions for maintenance activity optimization, using computational programs. The paper identifiesthe effects of non-compliance revisions schedule on the incidence of defects occurrence, fuel consumptions, revisions time and costs, reparations time and costs. Thus, it can be created a maintenance program focused on reducing the number of accidental failures and lowering their consequences by applying an analytic algorithm using data archived in the database. The originality of the paper is that allows the identification and ranking of results generated by the poor maintenance of transport fleet analyzed in the case study, through developing a computer application that allows the simulation data from the carrier maintenance database. Key words: buses, maintenance, database, simulation program, optimization.
1. INTRODUCTION
The transport sector represents a primary field of economy, with direct implications in other areas of activity, so it is vital to moving attention to its quality attributes. With regard to urban public transport, the implementation of an efficient fleet maintenance system, based on reliability and which is in optimal conjunction with the exploitation of the transport vehicles, is an indicator of quality level for the offered services.
The evolving direction of the existing maintenance operations worldwide, is felt in the present also in Romania, due to improving the processing and manufacturing technologies, the road vehicles auxiliary systems constructive and functional complexity, high performance requirements by the vehicles functioning and the high quality and comfort standards too, facts which leads to a shift on a higher level than mere specific for care interventions and repair operations [1, 2].
Maintenance management nowadays is an important activity with influence both in the quality of services offered by carriers,
passengers and cargo transported road safety but also on the economic and competitiveness
level of the company [11]. In order to ensure
the development of a performance management system of transport vehicles maintenance made up of corrective and preventive activities, it uses computational means with specific programs to achieve this goal. Generally, these
programs are for establishment and
management of maintenance data bases and for achieving prevision simulation of maintenance processes, through the information offered by structured databases. A database management program used for this purpose is SQL (Structured Query Language), and an optimal maintenance processes simulator is MatLab (Matrix Laboratory). In this paper is presented a model for achieving a databases and maintenance processes simulation of an urban public transport fleet, by using specific computational programs.
by qualified staff. The best decision-making process, for optimization the maintenance techniques, is possible to apply by performing statistical analysis, specific of recorded events. The results of the analysis, to be as conclusive as is possible, it is necessary to draw up and to use a database that contains records of each vehicle history. This archive need to include a larger time frame and it should be detailed on categories that include:
• factors concerning the exploitation process:
trails and distances travelled by each vehicle, programming the drivers on vehicles;
• energy factors: fuel consumption, electricity
consumption, consumption of oil and other fluids;
• economic factors: exploitation and
maintenance costs of each vehicle used;
• maintenance process factors: compliance
with recall intervals, occurrence frequency and typology of vehicles defects, the diagnostic mode and resolution of corrective interventions, using qualified and efficient workers.
The database resulting by monitoring the fleet exploitation and maintenance activities represents an essential support for permanent updating the strategies used for increasing the
reliability of transport vehicles[4].
Thus, using the archive of activities carried out, it can be identified the main causes that have led to the vehicles degradation over time. These causes can be generated by applying an oppressive system of maintenance and use of
vehicles assemblies and sub-assemblies,
leading to forming premature wear or failing their components.
Therefore, identification the causes leading to premature wear or failure of the vehicles
mechanisms components, represents an
appropriate way of maintenance techniques optimization, addressed by carriers. Using statistical data relating to the wears and defects, it can be performed reliability analysis on the elements of vehicles subassemblies. In these analyses, reliability indicators are obtained, which represent decisional elements regarding the management strategies for optimizing maintenance techniques, with results in raising the reliability level of the subassemblies
components but also the general reliability level of vehicles [7].
Through achieving goals of continuous growth and maintaining the high level of vehicles reliability, by maintenance techniques, it increases the level of transport safety in conjunction with increasing the degree of satisfaction the high mobility requirements, it reduces the degree of environmental pollution, decrease fuel consumption, materials and spare parts and the entire transport process becomes more efficient [1, 2].
2.MAINTENANCE OPTIMIZING
OPPORTUNITIES THROUGH
COMPUTER SIMULATION
With regard to the transport vehicles, through the analysis of databases relating to maintenance activities, it can be carried out simulation models in order to improve the maintenance activities.
The objectives are to obtain optimal solutions aimed at: the time intervals at which it were carried out revisions/interventions, the volume and type of the material used, the time allocated for carrying out additional operations, complexity of the operations involved for reinstatement operations, the possibility of determining the optimal timing of intervention, the period of immobilization the vehicle, operations costs, forecast on when failures occur, identification the negative potential effects arising from not performing some operations, optimizing activities workflows carried out in the maintenance workshop.
On the one hand, with regard to the development and management of an urban
public transport maintenance database
collections, SQL Server Management Studio Express is a particularly facile language.
allows tabular viewing, data relational and structural reporting, viewing and development of links with similar databases from other compartments of the organization, facile export of some data fields with the purpose of using them by the numerical simulation software [4].
On the other hand, using a numerical simulation program, is it possible to identify and correlating the potential adverse effects with influences on the incidence of production defects, modification of fuel consumption and increasing the specific maintenance costs.
One of the most opportune computer maintenance simulation programs, is MatLab.
The MATLAB programming language has a
number of advantages with significant
contribution in maintenance optimization
results, including: easy importing and use of certain categories of data contained in the database formed by using the management data system and ease to use data sequences contained in their files, the possibility of using a wide range of specific functions language programming by finding optimal solutions, the possibility of developing complex algorithms to carry out simulations, increased accuracy of simulation results due to matrix calculation system that is structured, development of graphical user interfaces for command and control over the numerical simulation processes and display their results [9, 12].
From a technological standpoint, there is a very high compatibility and a relatively simple
communication between the databases
management and numerical simulation
programs, nowadays.
Data can be imported or exported easily using tools that enable data exchange between source and simulation software and vice versa [12].
These tools are used primarily to exchange data with the management systems of relational databases, which otherwise are most common when working in the field of vehicles maintenance.
To import the data into the simulator, it will call the identification and control functions for desired files, belonging to the archive database.
3. CASE STUDY OF THE MAINTENANCE
ACTIVITY FOR AN URBAN
TRANSPORT PASSENGER FLEET
With the aim to improve maintenance activities performed on a fleet of vehicles consisting of 24 urban buses, it is proposed to monitor and record the main technical and economic parameters specific for maintenance process. Thus, using the SQL databases system, it will be reported and structured data specific for technical revisions and repairs made on vehicles belonging to a transport company, at
the level of 2015 year [3]. The database
developed, will include information about the effective number of buses entered into maintenance workshop in relation to the theoretical number of buses scheduled for
service operations, kilometers travelled
intervals, the defects categories and actual number of interventions for repairs, fuel consumption, time and costs of specific technical revisions and repairs made to the vehicles fleet analyzed.
Existing data in the database will be classified by time intervals, relative to the quarters of a year. Sets of information from the database developed will be run in MatLab program, where maintenance simulations will be carried out. In this way, the simulations will be conducted so as to reflect the consequences of the application of deficient maintenance techniques, as a result of non-compliance with the theoretical conditions established.
The results of the simulations carried out will make it possible to establish an optimal in terms of setting the quarterly number of vehicles subject to maintenance process, so that the work carried out to produce positive effects on the organizational, economic and technical parameters, within the framework of a transport company [8, 10].
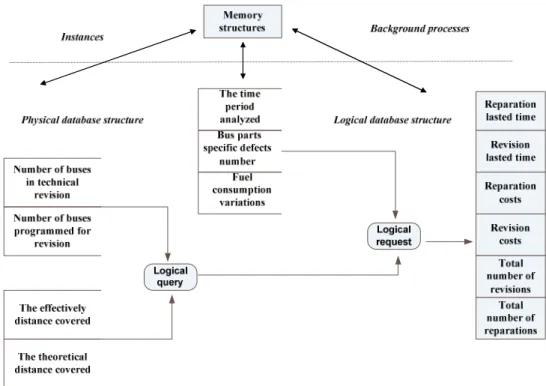
By using a specific programming language, it was structured data in tabular form in three categories that include information about failures producing incidence, time and cost of maintenance and repair operations and fuel
consumption. The data are related to the number of theoretical buses scheduled, shown in the first column and effective number, shown in the second column, with regard to the maintenance process [5, 10].
Fig. 1. Structural diagram for organization the database.
It has been carried out a quarterly classification, arranged on tabular lines, the data being arranged in ascending according to
the reference theoretical parameters. Figure 2 shows displaying the results generated by the query database [4].
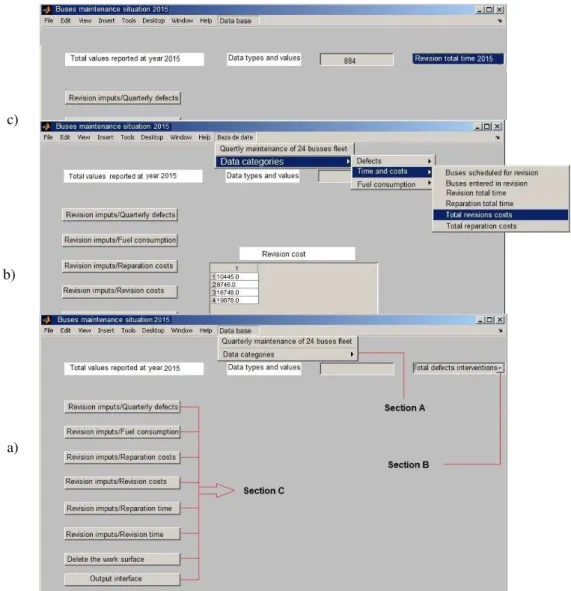
To enable use of existing data in the database, in order to carry out numerical simulations using MATLAB programming environment, it was made the graphical user interface shown in Figure 3 a). It is divided into three sections: "A", "B", "C". Section "A" includes sets of information arranged quarterly, extracted from the existing database, resulting from maintenance work carried out. Section "B" includes information about the total values of selected data, reported at the 2015 year. Section 'C' is the control panel for the simulation and graphical representation of data sets desired.
So, for viewing a data field desired, by pressing the "Database" button it will select a submenu and the information are retrieved and
displayed in the GUI (Graphical User Interface). In Figure 3 b) is shown an example for calling data relating to the total costs of technical revisions for the analyzed fleet. Data are presented on columns that represent the quarters of 2015 year.
With the purpose of viewing values for different types of data extracted from the database, for the entire period of time analyzed, by pressing and switching fields existing in the "popup button" on the right side of the graphic interface, in the specific box will be displayed requested values. In Figure 3 c) is presented an example of calling by using this button, displaying the corresponding total time allotted for technical revisions.
Fig. 3 a), b) c). Graphical user interface built for the simulation.
c)
b)
Graphic simulations of statistical data obtained in the course of maintenance work are performed by successively pressing the buttons to the left of the graphic interface, in which are also arranged the requested results [5, 6].
In figure 4 a) is shown the variation of the defects occurrence incidence, reported to the number of buses entered into technical revision, during quarters of the year for which the study was conducted. Figure 4 b) shows the distribution of fuel consumption for the vehicles fleet undergo maintenance process, reported to the number of vehicles which entered quarterly into technical revision.
Fig. 4. a) Failures incidence, b) Fuel consumption distribution, related to the number of vehicles entered
into technical revision, quarterly.
The curve which is describing the variation of product defects, depending on the number of buses entering quarterly in technical revision, is a polynomial function of grade 4, as expressed by equation (1) and which has a correlation
coefficient R2 = 0.997.
79 , 147 6818 , 8 3851 , 0 0062 , 0 )
( 4 3 2
− −
+ −
= x x x
x
F (1)
Average fuel consumption variation, related to the number of buses entered in technical revision, has been determined using the polynomial function of grade 3, presented in equation (2) and which has a correlation
coefficient R2 = 1.
( ) 0,25 3 1,75 2 4 31
+ − +
−
= x x x
x
F (2)
In equations (1) and (2), F(x) represents the
variation of defects number and fuel
consumption, depending on the number of
vehicles subject to technical revision and x is
the independent variable of the polynomial function.
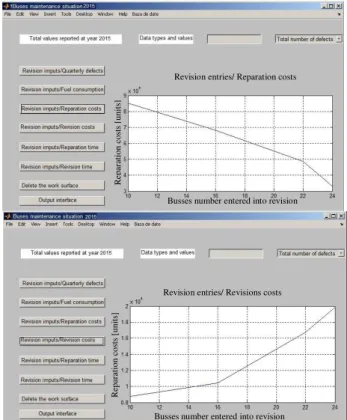
In Figure 5 a) and 5 b) are shown the reparation costs variations for the defects produced, respectively the interventions cost for revisions operations carried out, depending on the quarterly number of buses entered in the technical revision. The variation curve of reparation costs is linear, determined using equation (3) and which has a correlation
coefficient R2 = 0.967.
Fig. 5. a) Reparation costs, b) Technical revision costs, related to the number of vehicles entered into technical
revision, quarterly. 4893 , 9 6976 , 0 )
(x =− x+
F (3)
Revision entries/ Quarterly defect
Busses number entered into revision
Q u ar te rl y d ef ec ts n u m b er
Revision entries/ Fuel consumption
Busses number entered into revision
F u el c o n su m p ti o n [ l/ 1 0 0 k m ]
Revision entries/ Reparation costs
Busses number entered into revision
R ep ar at io n c o st s [u n it s]
Revision entries/ Revisions costs
Busses number entered into revision
The revision costs variation curve is exponential type, determined using the equation (4) and which has a coefficient of correlation
R2 = 0.981.
F(x) 0,705e0,1201x
= (4)
In equations (3) and (4), F(x) represents the
variation of reparation and revision costs, depending on the number of vehicles subject to
technical revision and x is the independent
variable of the equations.
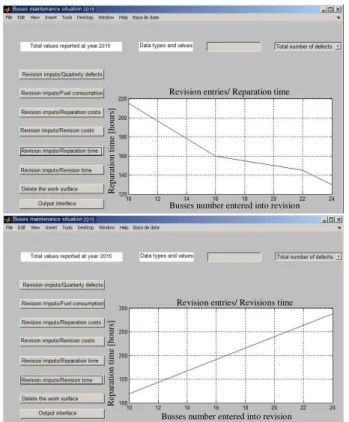
Figure 6 a) shows the variation of the time allocated for repair operations, countered in hours, depending on the quarterly number of buses entered in the technical revision. The curve describing the variation of repair operations time, is a polynomial function of degree 4, expressed by the equation (5) and
which has a coefficient of correlation R2 =
0.998.
9523 , 2 196 , 13 8832 , 2 1828 , 0 )
(x =− x4 + x3− x2 −
F (5)
Fig. 6. a) Reparation time variation,
b) Revision time variation, reported to the number of buses entered quarterly in technical
revision.
Figure 6 b) shows the variation of the time allocated to conduct technical revisions, countered in hours, reported to the number of buses entered quarterly in technical revision. The variation curve is a linear type, determined using equation (6) and which has a coefficient
of correlation R2 = 0.999.
F(x)=20,417x+98,75 (6)
In equations (5) and (6), F(x) represents the
variation of reparation and revision time, depending on the number of vehicles subject to
technical revision and x is the independent
variable of the equations.
4. INTERPRETATION OF THE
SIMULATION RESULTS
Running the application developed, relating to the maintenance of the public transport fleet, in the frame of database management and numerical simulation programs, has led to the following results: With regard to the vehicles defects incidence simulations, reported to the actual number of revisions made, it is found that with increasing of the revisions number performed and also closing to the theoretical values initially set, it decreases the number of failures generated. Thus, for the first interval analyzed, it can be observing that the introduction into technical revision of 43% from the scheduled buses fleet, it results 100% failures range.
For the second time interval analyzed, it appears that for introduction in technical revision of 80% of vehicles scheduled, it results a range of 83% defects. For the third period analyzed by introduction in technical revision of 96% of vehicles scheduled, it results a 74% failures percentage. For the last period of time analyzed, it is found that the introduction in technical revision of a 100% range of public transport vehicles, it results an incidence of failures of 57%.
By interpretation of the numerical
simulation results obtained, it can be concluded that a lower number of technical revisions, based on theoretical revisions needs and the
R
ep
ar
at
io
n
t
im
e
[h
o
u
rs
]
Revision entries/ Reparation time
Busses number entered into revision
Revision entries/ Revisions time
Busses number entered into revision
R
ep
ar
at
io
n
t
im
e
[h
o
u
rs
]
inobservance the specific time for this kind of interventions, contribute to the progressive defects number increasing, and also imposing the need of increase the reparations number.
Following the fuel consumption recorded by the bus fleet over analyzed intervals, it was performed a numerical simulation of its variation in relation with the buses number entered in technical revision. Thus, it was found that the introduction of the technical revision of less than 50% of the fleet scheduled, has the effect of increasing fuel consumption by 7% compared to the situation in which all transport vehicles are subject to technical revisions. It can be seen that along with the increasing the percentage of vehicles entered in technical revision and also with decreasing the number of recorded failures, it is registered a gradual decrease of vehicles fleet fuel consumption.
Further it has been carried out a simulation above the costs and the time allocated for reparation and specific preventive maintenance operations. For the first interval analyzed, as a result of the introduction of only 43% from the buses scheduled to revision, costs resulting from revision operations constitute 9%, while the remaining 91% percent are the costs generated by repairs, reported to the total cost of maintenance operations carried out. For the second period analyzed, at the introduction in technical revision of 80% of scheduled buses fleet, the revision costs are 13%, while 87% of the total costs represent the specific ones for reparations.
For the third time interval, in case of introduction in technical revision of a 96% percentage from the buses fleet, it is found that 26% are technical revision costs, and 74% represents reparation carried out costs, reported to the total costs. For the last interval analyzed, it is found that for introduction in technical revision of 100% vehicles scheduled, the technical revisions costs are 38% and those generated by repairs of 62% from the total cost. A very important aspect relating to the costs of maintenance operations carried out, is that the introduction in technical revision of a 100% range from the total buses fleet scheduled, the total costs of both maintenance operation categories, decrease with 56% in relation to the
situation when in technical revision are placed just 43 % from the buses fleet scheduled. Moreover, it is found that for the same ratio of the vehicles placed into maintenance, repair specific costs fall by 39%. Consequently, it can be concluded that the performance of preventive maintenance activities on an increased number of vehicles from buses fleet, leading to lower costs of failures and reparation operations, and also to a significant decrease of total maintenance costs.
Concerning the time allotted for
maintenance operations carried out, it is found that the introduction in technical revision of a 43% range of public transport fleet, the time allocated for this type of operations is decreasing with 42% compared to the total time needful for revisions of 100 % percentage of vehicles fleet.
5. CONCLUSIONS
With the purpose of optimizing the maintenance activities of an urban public transport fleet, using a database management system, it has been created an application which records and classifies data concerning the process of maintenance, over a year. Subsequently, using a programming language specific for numerical simulations, it has developed an application which operates various simulations of data recorded in the database.
A first conclusion extracted from the simulations conducted, is that a main cause of increasing the buses defects frequency, fuel consumptions and especially maintenance costs, consist of applying a non appropriate technical revisions program, over the vehicles from buses fleet analyzed.
increasing the fuel consumption, related to the entire buses fleet and increasing too the financial costs of maintenance activities and in the same time, diminishing the profit obtained by the carrier company.
In accord with the results obtained, it is
necessary to making decisions on
reorganization the preventive maintenance activities for the vehicles belonging to the public transport operator analyzed, which takes account the importance of compliance with the periodic technical revisions requirements, as well as the time intervals between inspections, the number of buses introduced in revisions and the type of operations carried out.
Therefore, it is urgently necessary to maximize the number of vehicles subject to technical revisions, through compliance with settled time intervals, condition that will lead to a direct proportional lowering of defects frequency, vehicles stand by time, the fuel consumption but mostly to the total costs of maintenance.
Acknowledge
Thanks are brought to the management team of public transport company from Turda City, because it facilitated access to buses fleet maintenance database and it made possible the development of a case study regarding on opportunities to optimize this activity.
6. REFERENCES
[1] Crișan, H.G., Filip, N., Influence of
malfunctions of the maintenance activities on the urban buses fuel consumption, Central European Journal of Engineering, Vol. 4. Issue 2, pp.178-185, 2014.
[2] Crișan, H.G., Filip, N., The reliability test of
elastic steering components from passengers urban buses, IN-TECH Proceedings, Dubrovnik, pp. 268-271, 2015.
[3] D.I., Documentație internă Societatea de
Transport Public S.A. Turda
“Unpublished Manuscript, Transport Company archive”, Turda-România, 2015.
[4] Harrington, J.L., Using SQL to Implement
a Relational Design, Relational Database
Design and Implementation, 4th edition,
p.p. 191-213, 2016.
[5] Hodkiewicz , M., Tien-Wei Ho , M.,
Cleaning historical maintenance work order data for reliability analysis, Journal of Quality in Maintenance Engineering, Vol. 22 Issue: 2, pp.146 – 163, 2016. [6] Koussaimi M.A., Bouami, D., Elfezazi,
S., Improvement maintenance
implementation based on downtime analysis approach, Journal of Quality in Maintenance Engineering, Vol. 22 Issue: 4,
pp.378 – 393, 2016.
[7] Laze, D., Achimaș, Gh., Zelea, I.,T.,
Maintenance of the brake sistems in the
commercial vehicles, Series: Applied Mathematics, Mechanics, and Engineering, Acta Technica Napocensis, Vol.58, Issue II, 2015.
[8] Márquez, A.C., Herguedas, A.S.,
Learning about failure root causes Through maintenance records analysis,
Journal of Quality in Maintenance
Engineering, Vol. 10 Issue: 4, p.p.254 – 262, 2004.
[9] M.W., Mathworks tutoriale de lucru în
Matlab, available at:
http://www.mathworks.com/
[10] Poornachandra, S., Wavelet - based
Denoising using subband dependent threshold for ECG signals, Digital Signal
Processing, Volume 18, Issue 1, p.p. 49-55,
2008.
[11] Vulcu, O.I., Arghir, M., Games diagnosis
of vehicle steering system, Series: Applied
Mathematics, Mechanics, Acta
Technica Napocensis, Vol.56, Issue IV, 2013.
[12] Zohrul Kabir, A.B.M., Evaluation of
OPTIMIZAREA MENTENANȚEI PARCULUI DE AUTOBUZE, UTILIZÂND METODE DE SIMULARE
COMPUTERIZATĂ
Rezumat: În cadrul acestei lucrări se propune identificarea consecințelor negative a nerespeectării programelor de mentenanță a unui parc auto de transport persoane și totodată identificarea unor metode de optimizare a activității de
mentenanță, prin intermediul unui studiu de caz dezvoltat utilizând un sistem de gestiune a bazelor de date și un
program de simulare computerizată. Cercetarea efectuată a avut la bază studiul literaturii de specialitate și în paralel
a problemelor concrete cu care se confruntă transportatorii de persoane, din perspectiva mentenanței parcului de autobuze.
Pornind de la cerințele rezultate în urma identificării principalelor neajunsuri în mentenanța autobuzelor, au fost
stabilite câteva direcții de optimizare a activității de mentenanță, prin prisma utilizării programelor computerizate.
Astfel, în prezenta lucrare au fost surprinse efectele nerespectării programului de revizii tehnice periodice, asupra incidenței producerii defectelor ansamblelor și subansamblelor din componența mijloacelor de transport persoane
analizate, asupra consumului de combustibil a parcului auto, a costurilor și timpilor de efectuare a reviziilor tehnice și
a reparațiilor.
Rezultatele obținute în urma efectuării acestor analize, stau la baza dezvoltării unui program de mentenanță axat pe reducerea numărului de căderi accidentale ale componentelor autobuzelor și totodată de reducere a consecințelor
defectelor produse, prin aplicarea unui algoritm de calcul ce utilizează date din baza de date privind activitatea de
mentenanță. Specificul temei de cercetare abordate, permite identificarea și clasificarea rezultatelor obținute ca
urmare a aplicării unui sistem defectuos de mentenanță a parcului de autobuze urbane analizat în cadrul studiului de caz, prin intermediul dezvoltării unei aplicații computerizate care permite simularea datelor existente în arhiva
compartimentului de mentenanță a companiei de transport și gestionarea acestora prin intermediul unui sistem de
gestiune a bazelor de date, care realizează totodată comunicarea și transferul datelor către programul de simulare
computerizată.
Horea-George CRIȘAN, PhD., assistant professor at Technical University of Cluj-Napoca,
Faculty of Mechanics, Department of Automotive Engineeering and Transports, Muncii street 103-105,Cluj-Napoca, România, Mphone +40740988728, e-mail [email protected].
Nicolae FILIP, PhD., professor atTechnical University of Cluj-Napoca, Faculty of Mechanics,