The impact of pay-for-percentile incentive on low-achieving students in
rural China
Fang Chang
a, Huan Wang
a, Yaqiong Qu
a, Qiang Zheng
a, Prashant Loyalka
b, Sean Sylvia
c,
Yaojiang Shi
a,⁎, Sarah-Eve Dill
d, Scott Rozelle
daCenter for Experimental Economics in Education, Laboratory of Modern Teaching Technology of Ministry of Education, Shaanxi Normal University, West Chang'an Road
No. 620, Chang'an District, Xi'an 710119, China
bStanford University, Stanford, CA, United States
cThe Univerisity of North Carolina at Chapel hill, NC, United States
dRural Education Action Program, Freeman Spogli Institute for International Studies, Stanford University, Stanford, CA, United States
A R T I C L E I N F O
Keywords:
Pay-for-percentile incentive Student achievement Low-achieving students RCTs
JEL codes: I24 O15 J33
A B S T R A C T
In some accountability regimes, teachers pay more attention to higher achieving students at the expense of lower achieving students. The overall goal of this study is to examine, in this type of accountability regime, the impacts of a pay-for-percentile type scheme in which incentives exist for all students but which are larger for improving the achievement of lower achieving students. Analyzing data from a large-scale randomized experiment in rural China, we find that incentives improve average achievement by 0.10 SDs and the achievement of low-achieving students by 0.15 SDs. We find parallel changes in teacher behavior and curricular coverage. Taken together, the results demonstrate that incentive schemes can effectively address teacher neglect of low-achieving students.
1. Introduction
Teacher effort is key for improving student achievement (Klem and
Connell, 2004;Brophy and Thomas, 1984). Yet under the current
tea-cher evaluation system in rural China, teatea-chers tend to overlook low-achieving students while paying relatively more attention to high-achieving students (Bo et al., 2010;Li, 2014). According to one survey conducted in rural China, only 21.6% of low-achieving students re-ported receiving help from their teachers, compared to 83.4 percent of high-achieving students (Wang and Yu, 2011). Such teacher neglect can stifle classroom engagement and affect the learning of disaffected stu-dents (Furrer C et al., 2014). Additionally, in the longer term, students with lower levels of academic achievement have lower levels of edu-cational attainment and a higher risk of mental health problems
(Yi et al., 2012;Wang et al., 2015;Chang et al., 2016). In other words,
low-achieving students are neglected, with long-lasting negative effects. Why do teachers in rural China neglect low-achieving students in particular? One reason may be that the educational system in China is extremely competitive and exam-oriented. At the junior high school level, high school entrance exam scores and the rate of matriculation into academic high school are metrics that are often used for evaluating
teaching effectiveness (Li, 2008). In such a system, focusing on mid-and high-performing students offers teachers the prospect of greater rewards with less effort than would be needed to raise the scores of low-performing students. While matriculation from primary school to junior high school today is not dependent on test scores, there is a widespread culture among primary and secondary schools that rewards teachers for identifying high performing students and focusing on test scores (CPG,
2006;Jiang, 2011). As a result, even in elementary schools, teachers
usually pay more attention to the top and middle performing students; in contrast, relatively low-performing students are ignored (Jiang and
Xu, 2016;Bo and Wu, 2010;Li, 2014).
Recent curriculum reforms have called on educators to shift their focus away from exam-driven education and towards more quality-driven education (MOE,2010). In 2009, China's Ministry of Education implemented the Teacher Performance Pay policy (MOE, 2008). This policy mandates that 30 percent of the salaries of teachers be perfor-mance pay, which means that 30 percent of a teacher's salary is sup-posed to be directly dependent on the academic performance of that teacher's students. The stated goals of the policy are to incentivize teachers to work harder to improve student outcomes and to care for every student, especially poorly performing students (MOE, 2008).
⁎Corresponding author.
E-mail address:[email protected](Y. Shi). https://doi.org/10.1016/j.econedurev.2020.101954
Received27January2019;Receivedinrevisedform15November2019;Accepted7January2020 Available online 17 March 2020
However, despite the intention of this policy, little has changed regarding teacher performance in rural China (Fu and Fan, 2013;
Ren and Luo, 2015). In the recent literature, even among schools that
claimed to have implemented performance-related pay schemes, tea-chers tend to receive equal amounts of extra pay regardless of perfor-mance (Mi and Dai, 2011;Ren and Luo, 2015;Loyalka, Sylvia, Liu, Chu
& Shi, 2019). This means that although the pay-for-performance policy
has been nominally implemented, few schools are actually paying for performance. Recent studies also have shown that teachers in the cur-rent education system are still highly concerned about exam scores and matriculation of their students to higher levels of schooling (Chen and
Feng, 2013;Chen and Wu, 2016;Ning, 2015), which reinforces the
neglect of underperforming students (Yuhua, 2018).
One reason that this policy has been less effective than intended may be that it does not include a specific performance assessment scheme to determine performance pay or to incentivize teachers to exert greater ef-fort towards students, especially low-performing students (Fan and
Fu, 2011;Mi and Dai, 2011;Ren and Luo, 2015). In China's decentralized
education system, each school (or each set of schools in a school district or county) determines on its own how to comply with the new policy. Re-search from the United States suggests that when local school districts and educators are tasked with designing performance pay schemes, they tend to imprement relatively weak, egalitarian reward structures that do not incentivize behavior change (Springer & Taylor, 2016;Marsh, Springer,
McCaffrey, Yuan & Epstein, 2011). It is certainly possible that schools
districts in China would do the same. It is also possible that districts may completely ignore the new incentive component. Considering that many schools have implemented the policy in name only, it is likely that many schools that say they are implementing the policy have not incorporated any rigorous performance assessment into the pay structure. The result of such a system would tend to reinforce the status quo, where low-achieving students are not given the help they need (Mi and Dai, 2011; Jiang et al., 2016;Ma, 2011).
What kind of targeted pay-for-performance scheme may successfully incentivize teachers to allocate effort to all student outcomes, including the outcomes of low-achieving students? According to (Neal, 2011), how student outcomes are used to measure teacher performance and mapped onto teacher rewards will affect the effort that teachers apply toward improving student outcomes within the classroom. For example, schemes involving fixed performance targets may fail to motivate teachers who believe that targets are too easy or too difficult to achieve (Neal and
Schanzenbach, 2010; Springer et al., 2010). In contrast, competitive
performance schemes in which teachers are evaluated relative to the performance of teachers with similar types of students and qualifications may more effectively motivate teachers to improve student learning outcomes (Neal, 2011;Barlevy and Neal, 2012). The design of perfor-mance assessments within an incentive scheme may also impact where teachers direct their effort – that is, which students teachers choose to focus on (Neal, 2011;Neal and Schanzenbach, 2010).
Recent empirical literature has tested Neal's theory in developing country contexts like that of rural China.Loyalka et al. (2019)compare the impacts of three different randomly-assigned teacher incentive schemes (levels, gains, and pay-for-percentile incentives), against a pure control group, on the achievement outcomes of students in rural China.1They find that of the three incentive schemes studied, only the
pay-for-percentile incentive has a significant impact on student achievement. In addition, pay-for-percentile incentives lead to similar size gains for all students across the baseline achievement distribution, including students who are traditionally neglected.Mbiti, Romero and
Schipper (2018)compare pay-for-percentile teacher incentives, an
in-centive scheme with several “levels” thresholds, and a pure control group in grades one to three in Tanzania. They find that both incentive schemes improve average student achievement, but do not result in statistically different results.Gilligan, Karachiwalla, Kasirye, Lucas and
Neal (2018)similarly find that pay-for-percentile incentives, in
com-bination with textbooks and grade-appropriate tests, improve the average math performance of primary school students in Uganda re-lative to a pure control group.
Despite the insights gained from this literature, important questions remain. First and foremost, given that lower achieving students receive disproportionately less attention than higher achieving ones, and that lower achieving student have difficulty catching up to their higher performing peers, can teacher incentives be designed to promote larger learning gains among lower achieving students? Additionally, how well do performance pay incentives (like pay-for-percentile) interact with existing incentives around teacher promotion? Prior international re-search suggests that new teachers and teachers with lower base salaries are more likely to support incentive pay schemes. Studies in the United States have found that teachers with less than three years of experience express substantially more support for incentive pay than teachers with more than 20 years of experience (Ballou and Podgursky, 1993;
Goldhaber et al., 2011;Jacob and Springer, 2008; Muralidharan and
Sundararaman, 2011). Furthermore, a study in India found that
tea-chers with higher base pay are significantly less likely to support the idea of pay for performance than those with lower base pay
(Muralidharan and Sundararaman, 2011). In China, teacher promotions
(which result in permanent base salary increases) are tied to both teaching experience and student performance (Rivkin, Hanushek &
Kain, 2005;Karachiwalla and Park, 2017). It is therefore possible that
teachers with different levels of experience or base salary may respond differently to performance pay incentives.
The overall goal of this study is to examine the impacts of pay-for-percentile incentives on the academic performance of students in rural China, focusing on the outcomes of low-achieving students. First, we analyze the impact of a modified pay-for-percentile teacher incentive scheme that provides even more money for achievement gains among the bottom third of students in the baseline achievement distribution) on overall student achievement. Second, we examine differences in the impact of the incentive scheme on students who scored in the top, middle and bottom terciles of the achievement distribution at baseline. Third, we analyze the mechanisms through which the modified pay-for percentile incentive scheme affects student achievement. Finally, we examine the heterogeneous effects of the scheme for teachers with different levels of experience and monthly base salary.
To meet these objectives, we conduct a full-scale randomized con-trolled trial (RCT) of pay-for-percentile incentives in a subset of the rural elementary schools that participated inLoyalka et al. (2019)’s study. Grade 5 math teachers in 103 schools were assigned to either the control group, which awarded performance pay based on the school's preexisting evaluation system, or the treatment group, which used the pay-for-percentile method to evaluate and reward teacher perfor-mance.2We examine the impacts of the modified pay-for-percentile incentive on treatment students as compared to the control group. Additionally, we compare the secondary outcomes (student attitudes towards math and teaching practices of teachers) between the control and treatment groups to understand the mechanisms through which the pay-for-percentile incentives impact student achievement. Finally, we 1The first scheme (the “levels” incentive) evaluates teachers based on the
class average of student scores on a standardized exam at the end of the school year. The second scheme (the “gains” incentive) evaluates teachers based on the class average gain in student achievement from the start to the end of the school year. The third scheme, (the “pay-for-percentile” incentive), which is based on the incentive design ofBarlevy and Neal (2012), evaluates teachers based on the fraction of contests that students of a given teacher win when compared to students who are taught by other teachers and yet began the school year at similar achievement level. All three schemes use a competitive rank-order tournament to determine the reward each teacher receives.
2. Methods
To analyze the impact of a modified pay-for-percentile teacher in-centive scheme on student outcomes, we implemented a clustered randomized controlled trial (RCT) among 3,789 grade five students in 103 public primary schools located in rural northwest China. This trial lasted for the duration of the 2014-2015 academic year. The schools included in this study are the same as the pay-for-percentile treatment schools (hereafter “treatment schools”) and control schools included in
Loyalka et al. (2019)’s study. However, it should be noted that, while
the treatment and control schools are the same, our sample is comprised of a new cohort of students and teachers. This means that, although the treatment school teachers had not participated in the previous treat-ment, they were aware of the pay-for-percentile program that was of-fering (and paying out) incentive payments. In other words, there is reason to believe that the new cohort of teachers may have had higher levels of trust in the program and the rewards that were offered by the research team. In the following subsections, we describe in detail our sampling process, treatment and control group assignment, interven-tion design, balance and attriinterven-tion, data collecinterven-tion, and the analytical methods used in this paper.
2.1. Sampling frame and group assignment
A three-step strategy was used to select the sample. In the first step, at the start of theLoyalka et al. (2019)study, one rural prefecture in Province A and one rural prefecture in Province B were selected for the study. The average per capita income of rural residents is $1,278 (RMB 8,687) in the sample prefecture in Province A and $645 (RMB 4,386) in the sample prefecture in Province B (NBS,2014). Since both of these are lower than the $1,316 (RMB 8,896) national average per capita income of rural areas across China (NBS, 2014), the sample provinces/pre-fectures can therefore be viewed as characteristic of low-income rural areas across China. From within the two sample prefectures, 16 na-tionally-designated poverty counties were selected for inclusion in the study.
In the second step, all elementary schools in the sample counties for which official records could be obtained were identified, totaling 435 schools. Schools that were located in county or prefecture seats of government were excluded, since most students in such schools are urban residents. Schools with less than 90 students were also excluded, since there was a likelihood that such schools would be shut down as part of China's ongoing school merger program (Chen et al., 2014). After applying these exclusion criteria, there were 216 elementary schools left in the sample. InLoyalka et al. (2019)’s study, the 216 schools were randomized into three groups, including 52 control schools, 54 “levels” incentive schools, 56 “gains” incentive schools, and 54 “pay-for-percentile” incentive schools. In our study, we excluded schools that were included in the levels and gains incentive groups and
include only the pay-for-percentile treatment and pure control schools. This left us with a final total of 103 schools, including 52 schools in the treatment group and 51 schools in the control group. Typical of rural China (Zhihui and Yuyou, 2016), the primary schools in the sample were public schools, comprised of grades 1-6, and had an average of close to 200 students.
In the third step of our sampling protocol, at the baseline of the present study, we selected sample students and teachers. We selected all grade 5 classes within each school for inclusion in our sample. All math teachers of the students in the sample classes were also included. In
bothLoyalka et al (2019)and our present study, all teachers in the same
school were assigned to the same treatment or control group. In total, our sample included 3,789 fifth-grade students and 113 teachers in 103 schools, including 1,825 fifth-grade students and 57 teachers from the 52 treatment schools and 1,964 fifth-grade students and 56 teachers from the 51 control schools (Table 1). In Loyalka et al. (2019), at baseline (one year before the baseline of this study), the two sets of schools were balanced in terms of 16 control variables.
2.2. Data collection
We conducted a baseline and endline survey of all students, teachers and principals in our 103 sample schools. The baseline survey was conducted in September 2014, after which we began our intervention. The endline survey was conducted in September 2015, after the con-clusion of the intervention. Although the content of the surveys was slightly different at baseline and endline, students, teachers and prin-cipals in both the treatment and control groups took the same survey during a given survey wave.
The baseline and endline surveys consisted of three blocks. In the first block, we collected data on student academic achievement. At both baseline and endline, students were given 30 min standardized mathematics tests that were constructed by trained psychometricians. The baseline math test had test items that were appropriate for the start of fifth grade whereas the endline math test had test items that were appropriate for the start of sixth grade. Test items for both the baseline and endline tests were selected from the standardized mathematics curricula for primary school students in the two sample provinces, and the content validity of these test items was checked by experts from the local school systems. To prevent cheating, members of the research team proctored the exams. Test scores were normalized into z-scores by subtracting the mean and dividing by the standard deviation (SD) of the control group's test score distribution.
In the second block, we collected data on student secondary out-comes, including student attitudes towards math and teacher teaching practices. In both the baseline and endline survey, students were asked detailed questions covering their attitudes about math (math self-con-cept, math anxiety, and math intrinsic and instrumental motivation scales) as well as the classroom practices of their teachers (teaching behavior, teacher care, classroom management ability, teacher com-munication, and the amount of time students spent on math studies Table 1
Distribution of sample schools and students. Number of
Schools Number ofTeachers Number ofStudents Percentage ofStudents (%)
(1) (2) (3) (4)
Full Sample 103 113 3789 100
By Province
Province A 48 49 1611 42.5
Province B 55 64 2178 57.5
By Treatment
Control 51 56 1964 51.8
Treatment 52 57 1825 48.2
Data source: Author's survey. conduct a heterogenous analysis of the interactions between
pay-for-percentile incentives and teacher characteristics (experience and monthly base salary) to understand how different t ypes o f teachers respond to the incentive.
2.4. Treatment: pay-for-percentile incentives
We introduced treated teachers to a modified pay-for-percentile incentive program. Pay-for-percentile, introduced by Barlevy and
Neal (2012), is designed to incentivize teachers not only to maximize
effort and student learning but also to allocate effort to improving the outcomes of all students at all points of the achievement distribution (including low-performing students). In attempt to further increase teacher effort on low-achieving students, the standard pay-for-percen-tile scheme was modified so that teachers would be given 60% more money for improvements in the achievement of students in the bottom third of the baseline achievement distribution.
Specifically, the incentives were determined in four steps. First, we placed all students in comparison groups according to their score on the baseline math test. Next, students were ranked in each comparison group by their percentile score (equal to the fraction of students in their comparison group whom that student outperformed) on the endline math test. Third, each teacher was ranked using a percentile perfor-mance index determined by the average percentile rank of all students in that teacher's class.6Based on their average percentile rank, teachers were allocated rewards according to the following (linear in percentile rank) formula:
= ×
Bonus R (99 Avg PercentileRank_ ) b
whereRis the reward for teachers ranking in the top percentile andbis the incremental reward for each percentile rank. Teachers ranking in the top percentile received 5000 RMB ($736), approximately equiva-lent to a month and a half of a teacher's basic salary, and the incre-mental reward per percentile rank was 50 RMB.
Fourth and finally, each teacher was ranked a second time using a percentile performance index determined by the average percentile rank of all students in the bottom third of the baseline achievement distribution. Teachers were allocated rewards according to the same (linear in percentile rank) formula. This time, however, teachers ranking in the top percentile received an additional 3000 RMB ($442) and the incremental reward per percentile rank was 30 RMB.
Although we believe that the treatment teachers were aware and confident that performance rewards would be paid under the incentive scheme (having seen the previous cohort of teachers receive payment), the research team needed to ensure that teachers understood how performance was assessed and rewards calculated using the pay-for-percentile design. To do so, teachers assigned to the treatment group were invited to the local prefectural seat of government following the baseline survey, where they attended an orientation program about the pay-for-percentile incentive program. Members of our research team, as well as members of the local prefecture bureaus of education, in-troduced treatment teachers to the program and helped teachers un-derstand the program's objectives. Treatment teachers were presented with performance pay contracts stipulating the details of the incentive scheme. Before signing the contract with our research group, teachers were provided with materials explaining the details of the contract and how rewards would be calculated. Our group also gave treatment tea-chers a two-hour training session covering the same material. To avoid any misunderstandings of the incentive structure and contract terms that might impact the results of the teacher incentives, we gave teachers a short quiz to check for and correct any misconceptions. For all treatment teachers who failed the quiz, we explained the correct an-swers in detail and reconducted the quiz to ensure their understanding. We then repeated this process until we were confident that all teachers fully understood the incentive.
3Student's household assets: whether the household owned certain common household items. Most responses to household asset ownership variables in our data set were dichotomous, so we used polychoric principal components ana-lysis (PCA—Kolenikov and Angeles, 2009) to construct a standard index for household wealth among our sample students, which we refer to as the family asset index. We did so because recent studies suggest using household asset indicators and PCA to construct continuous measures for household wealth is more reliable than self-reported income (for a review, see Kolenikov and Angeles, 2009).
4Schools in remote locations often have trouble recruiting teachers and will hire contract teachers from the local community. Contract teachers are usually less qualified, and they are often paid much less than regular teachers (Tsang M, 2003).
5Our response rate among teachers, both in the baseline and endline, was 100%. Our response rate among students, in the baseline, was 100%. However, there were some missing data for specific baseline variables, leading us to ex-lude 38 students with missing variable values. Finally, at endline, the response rate among the non-attrited students was also 100%; however, similar to the baseline survey, we excluded 8 students at endline due to missing data for specific variables.
6This performance measure is essentially the fraction of contests that the teacher's students won when compared with the students of other teachers in the same comparison group (Barlevy and Neal, 2012).
each week). Questions assessing these secondary outcomes were translated and adapted from the 2012 Program for International Student Assessment (PISA) survey, a worldwide study conducted by the Organization of Economic Cooperation and Development (OECD) in-tended to evaluate educational systems in countries around the world (Appendix TableA3– OECD,2013). In addition, we measured curri-cular coverage across various levels of difficulty. To measure curricurri-cular coverage, we gave students three examples each of “easy” math mate-rial (from the last semester of grade 4), three examples of “medium” math material (from the first semester of grade 5), and three examples of “hard” math material (from the second semester of grade 5). For each type of material (easy, medium and hard), students were asked to look at the three examples and report whether their teacher had exposed them to this material.
In the third block, we collected data on student, family, teacher and school characteristics. Students were asked to report their individual and family characteristics, including gender, age, boarding status (whether or not a student lives at school), father's education level, mother's education level and family asset value.3 Wealso collected information on the characteristics of the math teachers in our sample classes by interviewing teachers individually about their teaching ex-perience and monthly base salary. In addition, we interviewed the principal of each school to find the total number of students and tea-chers, as well as the number of contract teachers in each sample school.4
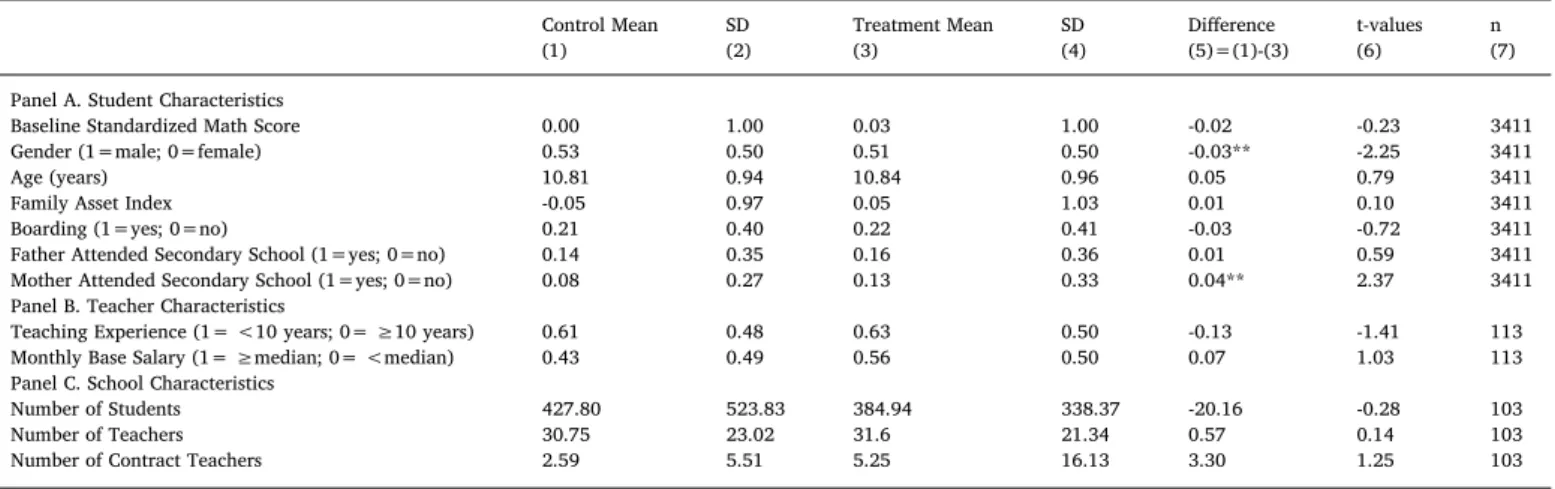
2.3. Testsforbalanceandattritionbias
After the baseline survey, we tested the control and treatment groups for balance. The characteristics of all students, teachers, and schools in our sample are described in Table2. Columns 1 and 3 show the mean of the control and treatment groups. Column 5 shows the difference between the two groups. When we examine the balance of the control and treatment groups, we find that ten of 12 variables are balanced. Two variables (student gender and mother's education level) are unbalanced (both at 5% significance), however, the differences are small in magnitude. In our statistical analysis, we control for these variables.
2.5. Statistical methods
In this paper we use an ordinary least-squares (OLS) regression to analyze the impact of the pay-for-percentile incentive treatment on student achievement and its transmission mechanisms. We perform this regression on the full sample, as well for terciles based on student academic performance at baseline, in order to compare outcomes of students in the bottom, middle and top of each class. The OLS regres-sion model is as follows:
= + + + + +
Score endline_ ij 1Tij 2Score baseline_ ij X Zij‘ 1 1c 1ij (1)
whereScore endline_ ijis the endline standardized math score for student iin schoolj, andTijis the treatment variable (equal to 1 if the student is in the treatment group and equal to 0 if the student is in the control group), which makesβ1the parameter of interest.Score baseline_ ijis the
baseline standardized math score for studentiin schoolj;Xij‘is a vector
of control variablesZ1is the coefficient of the control variables;Φ1cis a set of county (strata) fixed effects; and ɛ1ijis the residual term. In all specifications, Xij‘j includes the two waves of baseline achievement scores as well as the two unbalanced variables (student gender and mother's education level). We also estimate treatment effects with an expanded set of controls, including student age, student gender, parent educational attainment (mother and father), household asset index, class size, teacher experience, and teacher base salary.
To examine the transmission mechanisms underlying changes in math scores, we also estimate the effects of the treatment on secondary outcomes. To do this, we use the following OLS model:
= + + + + +
Yij 1Tij 2Score baseline_ ij X Zij‘ 2 2c 2ij (2)
whereYijdenotes a series of secondary outcomes, including student attitudes towards math and teacher teaching practices;Φ2cis a set of county (strata) fixed effects; and ɛ1ijis the residual term.
In the analysis, we also estimate the heterogeneous effects of tea-cher characteristics on student achievement scores. To do this, we run regressions examining interactions between the pay-for-percentile in-centive and the teacher characteristics measured at baseline. Our het-erogeneous effects model is:
= + + + + + +
Scoreendlineij 1Tij 2Score baseline_ ij 3T Xij* ij‘ X Zij‘ 3 3c 3ij (3) where T Xij* ij‘ is the interaction between the treatment and teacher
characteristics (teaching experience and monthly base salary), andγ3 indicates the heterogeneous treatment effect. Φ3c is a set of county (strata) fixed effect, and ɛ3ijis the residual term.
3. Results
3.1. Average Impacts of Modified Pay-for-Percentile Incentives on Achievement
Table 3reports estimates for the impact of the modified
pay-for-per-centile incentive treatment on student achievement. As specified in our statistical methods above, we report estimates usingEq. (1)and two dif-ferent sets of controls: a limited set of controls (controlling for baseline standardized math exam scores and strata fixed effects) and an expanded set of controls (student gender, age, parental educational attainment, a household asset index, teacher experience, and teacher base salary). We find that the treatment increased student achievement by 0.14 SD using the limited set of controls (significant at the 5% level—Table 3, Row 1, Column 1) and by 0.10 SD using the expanded set of controls (significant at the 10% level—Table 3, Row 1, Column 3).
To understand the differential effects of the modified pay-for-percen-tile incentive scheme on students at different points along the achievement distribution, we divide students into terciles (low, middle and high-per-forming) based on baseline math score (Table 4). When we examine dis-tributional effects across baseline achievement for the full sample, we find that the pay-for-percentile incentive had the largest effect on students at the bottom of the distribution (low-performing students). Math scores for these students increased by 0.15 SDs (Table 4, Rows 1, Column 1), sta-tistically significant at the 5% level. The pay-for-percentile incentive also had modest positive effects (positive point estimates) on students in the middle and top of the distribution: scores for middle- and high-performing students increased by 0.03 SDs and 0.10 SDs, respectively. Although, these effects are not statistically significant even at the 10% level, the positive coefficient values indicate that the positive and significant effects on the lowest performing students do not come at the expense of middle- or high-performing students.7
3.2. Impacts of modified pay-for-percentile incentives on secondary outcomes
Table 5presents the results of our analysis examining the effects of
Control Mean SD Treatment Mean SD Difference t-values n
(1) (2) (3) (4) (5)=(1)-(3) (6) (7)
Panel A. Student Characteristics
Baseline Standardized Math Score 0.00 1.00 0.03 1.00 -0.02 -0.23 3411
Gender (1=male; 0=female) 0.53 0.50 0.51 0.50 -0.03** -2.25 3411
Age (years) 10.81 0.94 10.84 0.96 0.05 0.79 3411
Family Asset Index -0.05 0.97 0.05 1.03 0.01 0.10 3411
Boarding (1=yes; 0=no) 0.21 0.40 0.22 0.41 -0.03 -0.72 3411
Father Attended Secondary School (1=yes; 0=no) 0.14 0.35 0.16 0.36 0.01 0.59 3411
Mother Attended Secondary School (1=yes; 0=no) 0.08 0.27 0.13 0.33 0.04** 2.37 3411
Panel B. Teacher Characteristics
Teaching Experience (1= <10 years; 0= ≥10 years) 0.61 0.48 0.63 0.50 -0.13 -1.41 113
Monthly Base Salary (1= ≥median; 0= <median) 0.43 0.49 0.56 0.50 0.07 1.03 113
Panel C. School Characteristics
Number of Students 427.80 523.83 384.94 338.37 -20.16 -0.28 103
Number of Teachers 30.75 23.02 31.6 21.34 0.57 0.14 103
Number of Contract Teachers 2.59 5.51 5.25 16.13 3.30 1.25 103
Data source: author's baseline survey.
NOTE: Column 1 and column 3 show the mean in the control and treatment group, while columns 2 and 4 show standard deviations for the control and treatment groups, respectively. Column 5 shows the difference between control mean and treatment mean. *, **, and *** indicate significance at 10%, 5% and 1%, respectively.
7We also use nonparametric analysis to examine student achievement growth over the course of the academic year based on student baseline achievement. The results are largely consistent with that ofTables 3and4:overall, students in the treatment group have greater improvement in academic achievement compared with students in the control group, with the greatest impacts ap-pearing for treatment students with the lowest baseline academic performance. Table 2
the modified pay-for-percentile incentive scheme on teacher teaching practices and student attitudes towards math. We find significant im-pacts on teaching practices. Specifically, treatment students reported that teachers covered both more easy-level curriculum content (sig-nificant at the 1% level) and hard-level curriculum content (sig(sig-nificant at the 5% level) compared to students in the control group (Table 5, Row 1, Columns 5-7). Changes in the amounts of medium-level material covered were not significantly different.
Furthermore, we find that, compared with control teachers, teachers in the treatment group invested more time and energy in improving student outcomes. Treatment students reported higher levels of teacher
Dependent Variable Endline Standardized Math Score
(1) (2) (3)
Pay-for-Percentile Incentive 0.14** 0.09* 0.10*
(0.06) (0.05) (0.06)
Baseline Standardized Math Score 0.63*** 0.60*** 0.59***
(0.02) (0.02) (0.02)
Age (years) -0.10***
(0.02)
Gender (1=male; 0=female) -0.00
(0.03)
Boarding (1=yes; 0=no) -0.02
(0.04) Father Attended Secondary School
(1=yes; 0=no) 0.08*
(0.04) Mother Attended Secondary School
(1=yes; 0=no) 0.02
(0.04)
Family Asset Index -0.01
(0.02) Teacher Monthly Base Salary (1=higher
than the median; 0=lower than the median)
-0.12
(0.08) Teacher Teaching Experience (1=lower
than 10 years; 0=higher than 10 years)
-0.08
(0.09)
Strata (county) Fixed Effect No Yes Yes
Constant 0.03 0.20*** 1.43***
(0.04) (0.04) (0.25)
Observations 3,411 3,411 3,411
R-squared 0.405 0.427 0.437
Notes: Robust standard errors clustered at the school level are reported in parentheses. All tests account for clustering at the school level. *, ** and *** indicates significance at 10%, 5% and 1%.
Table 4
Distributional Effects of pay-for-percentile incentives by baseline math scores. Dependent Variable Pay for Percentile Incentive Effect on:
Bottom 1/3 Middle 1/3 Top 1/3
(1) (2) (3)
Pay-for-Percentile Incentive 0.15** (0.07) 0.03 (0.07) 0.10 (0.06) Baseline Standardized Math
Score 0.47***(0.04) 0.53***(0.09) 0.75*** (0.07)
Student Characteristics Yes Yes Yes
Family Characteristics Yes Yes Yes
Teacher Characteristics Yes Yes Yes
Strata (county) Fixed Effect Yes Yes Yes
Constant 1.44***
(0.42) 1.50***(0.30) 1.19*** (0.33)
Observations 1,282 1,130 999
R-squared 0.21 0.11 0.21
Notes: Robust standard errors clustered at the school level are reported in parentheses.All tests account for clustering at the school level. *, ** and *** indicates significance at 10%, 5% and 1%.
Table 5 Impacts of pay-for-percentile incentives on secondary outcomes. Dependent Variable Math Self Concept Math Anxiety Math Intrinsic Motivation Math Instrumental Motivation Taught Easy Curriculum Taught Medium Curriculum Taught Hard Curriculum Teaching Behavior Teacher Cares Teacher Can Manage Teacher Communication Student Time on Math (1) (2) (3) (4) (5) (6) (7) (9) (10) (11) (12) (8) Pay-for-Percentile Incentive 0.04 0.05 0.08 0.01 0.05*** 0.01 0.05** 0.06* 0.12** 0.07 0.08* -0.02 (0.04) (0.04) (0.05) (0.04) (0.02) (0.02) (0.02) (0.03) (0.05) (0.05) (0.05) (0.05) Baseline Standardized Math Score 0.09*** 0.14*** 0.07*** 0.09*** 0.05*** 0.01 0.01** 0.01 0.02 0.08*** -0.07*** -0.00 (0.01) (0.01) (0.02) (0.02) (0.01) (0.01) (0.01) (0.01) (0.02) (0.02) (0.01) (0.01) Student Characteristics Yes Yes Yes Yes Yes Yes Yes Yes Yes Yes Yes Yes Family Characteristics Yes Yes Yes Yes Yes Yes Yes Yes Yes Yes Yes Yes Teacher Characteristics Yes Yes Yes Yes Yes Yes Yes Yes Yes Yes Yes Yes Strata (county) Fixed Effects Yes Yes Yes Yes Yes Yes Yes Yes Yes Yes Yes Yes Constant 0.22 0.54*** 0.17 0.34* 0.93*** 0.73*** 0.62*** -0.15 0.26 0.48*** -0.40** 0.26 (0.19) (0.17) (0.22) (0.20) (0.07) (0.06) (0.07) (0.16) (0.22) (0.18) (0.19) (0.16) Observations 3411 3411 3411 3411 3411 3411 3411 3411 3411 3411 3411 3411 R-squared 0.05 0.09 0.06 0.04 0.08 0.13 0.05 0.05 0.08 0.06 0.10 0.07 Notes: Robust standard errors clustered at the school level are reported in parentheses. All tests account for clustering at the school level. *, ** and *** indicates significance at 10%, 5% and 1%. Table 3
4. Discussion and conclusion
The purpose of an educational system is to teach all children
(Fullan, 2012), and teachers play a key role in ensuring that all students
are learning (Hannum and Park, 2002;McLaughlin and Talbert, 2006). However, under China's current educational system, rural teachers tend to give preferential attention to high-achieving students at the expense of low-achieving students (Bo et al., 2010). Although the Teacher Performance Pay policy implemented in 2009 aims to motivate teachers to improve the outcomes of all students, including low-performing students (MOE, 2008), research in rural China has continued to docu-ment that teachers tend to neglect low-performing students and give greater attention to higher-performing students (Li, 2014;Wang and
Yu, 2011; Jiang et al., 2016).
One reason for the continued neglect of underperforming students is that there is no clear system for evaluating the performance of teachers to determine performance pay (Ren and Luo, 2015;Fan and Fu, 2011;
Mi and Dai, 2011). Theoretical and empirical studies of teacher
in-centives have suggested that the pay-for-percentile incentive design can effectively motivate teachers to improve the outcomes of students across the achievement distribution (Neal, 2011; Barlevy and
Neal, 2012; Loyalka et al., 2019; Gilligan et al., 2018; Mbiti et al.,
2018). Yet can a modified pay-for-percentile incentive design improve the academic outcomes of underperforming students specifically?
According to our results, in fact, we do find that a modified pay-for-percentile scheme (in which incentives exist for all students but are larger for improving the achievement of lower achieving students) significantly increases the achievement of those students. Low-per-forming students in our treatment group saw significantly greater im-provement from baseline to endline (0.15 SD) in contrast to middle- and high-performing treatment students. Our findings also show that im-provements in the outcomes of low-performing students did not come at the expense of middle- or high-performing students: the point estimates for students in the middle and top terciles of the baseline achievement distribution were also positive (0.03 and 0.1 SD, respectively) albeit statistically insignificant.
Why might pay-for-percentile incentives be effective at increasing the scores of students who are at the bottom of the academic achieve-ment distribution compared to students in the control schools? One plausible reason is that the modified pay-for-percentile scheme suc-cessfully incentivized teachers to pay more attention to students who scored in the bottom tercile of their class. In control schools, teachers were given performance pay as stipulated by the Teacher Performance Pay policy, but there is no clear method or performance assessment. This left schools to rely on their own methods of performance assess-ment, which may have reinforced the status quo of using exam scores as a metric of teacher performance and incentivized teachers to focus on high-performing students and neglect low-performing ones
(Jiang, 2011; Jiang et al., 2016). Teacher incentivized under the
modified pay-for-percentile design, however, not only received rewards for improvements in the performance of all students along the baseline achievement distribution, but also received additional rewards for im-provements in the performance of low-achieving students specifically. If treated teachers believed that focusing on the outcomes of low-achieving students would bring them greater benefits under the in-centive scheme, it is not surprising that we see greater improvement among low-achieving students.
It is noteworthy that the effects of the pay-for-percentile incentive on the lowest-performing students did not come at the expense of mid-performing and high-mid-performing students. This shows that the modified pay-for-percentile program did not encourage teachers to strategically allocate effort to the low-performing students given the larger pay off. Instead, the evidence demonstrates that the modified pay-for-percentile program increased teacher effort and efficiency for all students.
Our analysis of secondary outcomes further supports this reasoning. Our results show that the incentive scheme worked largely by in-centivizing teachers to spend more time covering easy and hard curri-cula. This finding is similar to the results ofLoyalka et al (2019), who found that improvements in student outcomes were correlated to in-creased curricular coverage. However, pay-for-percentile incentivized Table 6
Heterogeneous effects of pay-for-percentile incentives by baseline teacher characteristics.
Dependent Variable Endline Standardized Math Score
(1) (2)
Pay-for-Percentile Incentive 0.03 0.15
(0.08) (0.09)
Baseline Standardized Math Score 0.59*** 0.59***
(0.02) (0.02)
Teacher Teaching Experience (1=less than 10
years; 0=greater than 10 years) -0.14 -0.07
(0.10) (0.09)
Teacher Monthly Base Salary (1=higher than the
median; 0=lower than the median) -0.13 -0.06
(0.08) (0.10)
Treatment*Teacher Teaching Experience 0.12 (0.10)
Treatment*Teacher Monthly Base Salary -0.11
(0.11)
Student Characteristics Yes Yes
Family Characteristics Yes Yes
Teacher Characteristics Yes Yes
Strata (county) Fixed Effect Yes Yes
Constant 1.47*** 1.39***
(0.25) (0.26)
Observations 3411 3411
R-squared 0.44 0.44
Notes: Shows estimated coefficients and standard errors obtained by estimating regressions analogous to Model 1, but adding the baseline variable of interest and interactions with incentive treatment dummies. Each regression controls for baseline standardized math exam scores, strata (county) fixed effects as well as student gender, age, parent educational attainment, a household asset index, tea-cher experience and teatea-cher base salary. All standard errors account for clustering at the school level. *, **, and *** indicate significance at 10%, 5% and 1%. care compared to control students, (Table5, Row 1, Column 10), and treatment students were also more likely to say that their teachers communicated with them (Table5, Row 1, Column 12). Additionally, students in the treatment group reported lower teacher absence rates and more math homework (Table5, Row 1, Column 9).
In contrast, we find little evidence that the treatment affected stu-dent attitudes towards math. Effects on indices representing math self-concept, math anxiety, intrinsic and instrumental motivation in math, and student time spent on math are all statistically insignificant
(Table 5, Columns 1, 2, 3, 4, 8). Overall, our data indicate that the
treatment worked largely through changes in curricular coverage and changes in the behaviors and attitudes of teachers. We can therefore infer that the incentive led teachers to give more attention and con-sideration to students, especially low-performing students.
3.3. Heterogeneouseffectsbyteachercharacteristics
which may lead to more consistent improvements in student achieve-ment.
We do acknowledge one limitation of this study. Because our data on secondary outcomes was only collected at endline, we are unable to establish a causal relationship between the incentive, the secondary outcomes, and student academic achievement. This means that al-though our results identify the causal effect of the teacher incentive on student academic achievement, we cannot identify with certainty the mechanism through which this occurs. Future research should make use of longtitundinal dynamic panel data to verify the causal chain through which the incentive impacts student achievement.
Given our findings, we recommend that Chinese policymakers im-plement a broad pilot study of pay-for-percentile incentives in schools across rural China to determine whether and how to incorporate a pay-for-percentile program into existing policy. That the pay-pay-for-percentile incentive scheme (with and without modifications to help teachers pay more attention to low-achieving students) has shown positive impacts on student academic achievement in repetitive use indicates that this incentive design may be effectively scaled up to improve the academic outcomes of China's rural students and treat issues of teacher neglect. Future research should examine the effectiveness of pay-for-percentile in rural schools in different regions of China to assess the effectiveness and scalability of this incentive scheme and its potential to be im-plemented as a part of the Teacher Performance Pay policy.
Acknowledgements
The authors acknowledge the financial assistance of the 111 project (Grant no. B16031), the National Natural Science Foundation of China (Grant no. 71933003), and the Fundamental Research Funds for the Central University (Grant no. 17SZYB02), Graduate innovation fund (Grant no. 2017CSY056).
Tables A1,A2,A3.
Table A1 Sample attrition.
Number of students at Baseline Number of students at Endline Attrition Attrition Rate
"Pay-for-Percentile" Group 1825 1640 185 10.14%
Control Group 1964 1771 193 9.83%
All Sample 3789 3411 378 9.98%
Data source: author's survey.
Table A2
Attrition test at endline.
Full sample (1)
Pay-for-Percentile Incentive 0.010
(0.015)
Strata (county) Fixed Effect Yes
Constant 0.054***
(0.018)
Observations 3,789
R-squared 0.018
Notes: Robust standard errors clustered at the school level are reported in parentheses. The dependent variable in this regression is a dummy variable indicating a student was absent from the endline survey. The regression controls for strata(county) fixed effects. Standard errors account for clustering at the school level. *, **, and *** indicate significance at 10%, 5%, and 1%. teachers in Loyalka etal. (2019)’s study covered more medium and
hard material, compared to easy and hard material reported by students in our study. It is possible that teachers in our study covered more easy curriculum content to improve the academic performance of low-per-forming students specifically. That teachers in the treatment group of this study spent more time teaching easy curriculum content is also the most likely reason for why we find that students at the bottom of the baseline achievement distribution improved more than students in the middle and top of the distribution.
Additionally, treatment teachers invested more energy and time in the outcomes of students compared to control teachers. Compared to students in the control group, treatment students reported that their teachers showed greater care for students and increased communication with students, and that their teachers also had fewer absences and gave more homework. These findings d iffer fr om th ose of ot her studies
(Loyalkaetal.,2019; Glewwe,Ilias&Kremer,2010; Muralidharanand
Sundararaman,2011), who found that increased incentives for teachers
had little impact on classroom practices. Furthermore, we find that the modified pay-for-percentile incentive structure incentivized all teachers regardless of experience or base salary.
Our findings verify that in practice, the pay-for-percentile incentive scheme can be modified to close achievement gaps in primary school. That both our study and the Loyalkaetal.(2019)study returned po-sitive results indicates that pay-for-percentile is a robust treatment to improve student outcomes, and may be successfully replicated in other parts of China. Our results also demonstrate that the pay-for-percentile incentive scheme can effectively a ddress i ssues o f t eacher n eglect of underperforming students in rural China and motivate teachers to change both their curricular coverage and their classroom practices in order to improve student outcomes. Additionally, unlike other existing incentives (such as the promotion system in China–Wen-jinget al.,
2010; Chuetal.,2015; KarachiwallaandPark,2017), this incentive
design motivates teachers regardless of their experience and salary,
References
Ballou, D., & Podgursky, M (1993). Teachers' attitudes toward merit pay: Examining conventional wisdom.ILR Review, 47(1), 50–61.
Barlevy, G, & Neal, D. (2012). Pay for percentile.The American Economic Review, 102(5), 1805–1831.
Bo, Y, & Wu, L. (2010). Study on students with learning difficulties in inclusive education.
New Curriculum Research (Basic Education),(01), 81–82 (in Chinese). Brophy, Jere, and Thomas L. Good. Teacher Behavior and Student Achievement.
Occasional Paper No. 73. (1984).
Central People's Government of the People's Republic of China (June 30, 2006). Compulsory Education Law of the People's Republic of China.Http://www.gov.cn/ ziliao/flfg/2006-06/30/content_323302.htm.
Chang, F, Min, W, Shi, Y, et al. (2016). Educational Expectations and Dropout Behavior among Junior High Students in Rural China.China & World Economy, 24(3), 67–85. Chen, X., Yi, H., Zhang, L., Mo, D., Chu, J., & Rozelle, S. (2014). Do poor students benefit
from China's merger program? Transfer path and educational performance.Asia
Pacific Journal of Education, 34(1), 15–35 2014.
Chen, Z, & Feng, W. (2013). Analysis of the Present Situation of Examination-oriented Education.Journal of Yangtze University (Social Science), 36(03), 147–149 (in Chinese).
Chen, Z, & Wu, X. (2016). Reasons for insufficient motivation of rural primary school teachers in teaching and research.Journal of Teaching and Management,(11), 12–14 (in Chinese).
Chu, J., Loyalka, P., Chu, J., Qu, Q. H., Shi, Y. J., & Li, G. (2015). The impact of teacher credentials on student achievement in China.China Economic Review, 36, 14–24. Fan, X, & Fu, W. (2011). Teachers' pay for performance reform in compulsory education:
background, results, problems and countermeasures: based on a survey of 32 counties (cities) in four provinces in central China.Journal of Central China Normal University (Humanities and Social Sciences), 50(06), 128–137 (in Chinese).
Fullan, M (2012).Change forces: Probing the depths of educational reform.Routledge. Fu, W, & Fan, X. (2013). Reform of teachers' pay for performance system and balanced
development of compulsory education: a survey based on forty counties (cities) in eight provinces.Contemporary Educational Science,(10), 7–11 (in Chinese). Furrer C, J, Skinner E, A, & Pitzer J, R (2014). The influence of teacher and peer
Variables Survey Questions
Student attitudes toward math
Math self-concept 1. I am just not good at mathematics
2. I get good marks in mathematics 3. I learn mathematics quickly
4. I have always believed that mathematics is one of my best subjects 5. In my mathematics class, I understand even the most difficult work
Math anxiety 1. I often worry that it will be difficult for me in mathematics classes
2. I get very tense when I have to do mathematics homework 3. I get very nervous doing mathematics problems 4. I feel helpless when doing a mathematics problem 5. I worry that I will get poor marks in mathematics
Math intrinsic motivation 1. I enjoy reading about mathematics
2. I look forward to my mathematics lessons 3. I do mathematics because I enjoy it
4. I am interested in the things I learn in mathematics
Math instrumental motivation 1. Making an effort in mathematics is worth it because it will help me in the work that I want to do later on 2. Learning mathematics is worthwhile for me because it will improve my career
3. Mathematics is an important subject for me because I need it for what I want to study later on 4. I will learn many things in mathematics that will help me get a job
Teacher teaching practices
Teaching behavior 1. My teacher sets clear goals for our learning
2. My teacher asks me or my classmates to present our thinking or reasoning at some length.
3. My teacher gives different work to classmates who have difficulties learning and/or to those who can advance faster. 4. My teacher assigns projects that require at least one week to complete.
5. My teacher tells me about how well I am doing in my mathematics class. 6. My teacher asks questions to check whether we have understood what was taught. 7. My teacher has us work in small groups to come up with joint solutions to a problem or task. 8. At the beginning of a lesson, my teacher presents a short summary of the previous lesson. 9. My teacher asks us to help plan classroom activities or topics.
10. My teacher gives me feedback on my strengths and weaknesses in mathematics. 11. My teacher tells us what is expected of us when we get a test, quiz or assignment. 12. My teacher tells us what we have to learn.
13. My teacher tells me what I need to do to become better in mathematics. 14. My teacher gives me (extra) math exercises
Teacher care 1. My teacher shows an interest in every student's learning.
2. My teacher gives extra help when students need it. 3. My teacher helps students with their learning.
4. My teacher continues teaching until the students understand. 5. My teacher gives students an opportunity to express opinions.
Classroom management 1. My teacher gets students to listen to him or her.
2. My teacher keeps the class orderly. 3. My teacher starts lessons on time.
4. My teacher has to wait a long time for students to quiet down
Teacher communication 1. My teacher talks with me about my progress
2. My teacher talks with parents about my progress 3. My teacher sends letters home about my progress 4. My teacher told me it is important to test well in math
Student time on math 1. How many times did your math teacher assign homework?
2. How many times did you hand in your math homework?
3. How much time did you take to finish your math homework per day? 4. How many times did your math teacher tutor you individually last week? 5. How many times did you miss math class last week?
Table A3
relationships on students’ classroom engagement and everyday motivational resi-lience.National Society for the Study of Education, 113(1), 101–123.
Gilligan, O., Karachiwalla, N., Kasirye, I., Lucas, A., Neal, D. (2018). “Educator Incentives and Educational Triage in Rural Primary Schools.” Working Paper.
Glewwe, P, Ilias, N, & Kremer, M (2010). Teacher incentives.American Economic Journal: Applied Economics, 2(3), 205–227.
Goldhaber, D., DeArmond, M., & DeBurgomaster, S (2011). Teacher attitudes about compensation reform: Implications for reform implementation.ILR Review, 64(3), 441–463.
Hannum, E, & Park, A. (2002). Educating China's Rural Children for the 21st Century.
Harvard China Review.
Jacob, B., & Springer, M. G.Teacher Attitudes toward Pay for Performance: Evidence from Hillsborough County, Florida. Working Paper 2008-08. National Center on Performance Incentives, 2008.
Jiang, X, & Xu, W. (2016). Considering the drawbacks and countermeasures of primary examination-oriented education.Research,(11), 140 (in Chinese).
Jiang, X. (2011). Existing problems and countermeasures in the implementation process of pay for performance policy.Educational Theory and Practice, 31(26), 24–26 (in Chinese).
Karachiwalla, N., & Park, A. (2017). Promotion incentives in the public sector: Evidence from Chinese schools.Journal of Public Economics, 146, 109–128.
Klem, Adena M., & Connell, James P. (2004). Relationships matter: Linking teacher support to student engagement and achievement.Journal of School Health, 74(7), 262–273.
Kolenikov, S, & Angeles, G. (2009). Socioeconomic status measurement with discrete proxy variables: Is principal component analysis a reliable answer?Review of Income and Wealth, 55(1), 128–165.
Li, L. (2014). Reasons and countermeasures for the formation of "backward students" in primary schools: A Case Study Of Fanghua Elementary School in Fanghua Town, Luliang County and Zhaokua Elementary School in Zhaokua Town.Journal of Qujing Normal University, 33(S1), 34–36 (in Chinese).
Li, W. (2008). How can teaching rewards only look at the teaching results.China Education Daily(007) 11-25(in Chinese).
Loyalka, P., Sylvia, S., Liu, C., Chu, J., & Shi, Y. (2019). Pay by design: Teacher perfor-mance pay design and the distribution of student achievement.Journal of Labor Economics, 37(3), 621–662.
Ma, D. (2011). The causes and countermeasures of students with learning difficulties.
Science & Technology Information,(33), 198 (in Chinese).
Mbiti, I., Romero, M., Schipper, Y., Left behind by optimal design: The challenge of de-signing effective teacher performance pay programs, Working Paper, 2018. McLaughlin, M. W., & Talbert, J. E. (2006).Building school-based teacher learning
com-munities: Professional strategies to improve student achievement.Teachers College Press45.
Mi, J, & Dai, J. (2011). The current problem of primar y and secondary school teachers' performance evaluation system.Educational Science Research,(08), 37–40 (in Chinese).
Ministry of Education of People's Republic of China. (2008).Guidelines to Teacher
Performance Evaluation in Compulsory Schools.http://www.moe.edu.cn/srcsite/A04/
s7051/200812/t20081231_180682.html.
Ministry of Education of People's Republic of China (July 29, 2010). Outline of the National Medium and Long-Term Education Reform and Development Plan (2010-2020).http://old.moe.gov.cn/publicfiles/business/htmlfiles/moe/info_list/201407/ xxgk_171904.html.
Marsh, J. A., Springer, M. G., McCaffrey, D. F., Yuan, K., & Epstein, S. (2011).A big apple for educators: New York City's experiment with schoolwide performance bonuses: Final evaluation report.Rand Corporation.
Muralidharan, K, & Sundararaman, V (2011). Teacher performance pay: Experimental evidence from India.Journal of Political Economy, 119(1), 39–77.
Neal, Derek (2011).The design of performance pay in education. Handbook of the economics of education,4, Elsevier495–550.
Neal, D, & Schanzenbach, DW (2010). Left behind by design: Proficiency counts and test-based accountability.The Review of Economics and Statistics, 92(2), 263–283. National Bureau of Statistics. (2014).China statistical yearbook.China Statistics Press. Ning, B. (2015). Analysis of incentive effect on the implementation of teachers' pay for
performance policy in compulsory education: A case study of P district teachers in Shanghai.Educational Development Research, 35(22), 16–20 (in Chinese). OECD. (2013). PISA 2012 Results: Ready to Learn: Students’ Engagement, Drive and
Self-Beliefs (Volume III), PISA.OECD Publishing.https://doi.org/10.1787/ 9789264201170-en.
Ren, X, & Luo, L (2015). Study on pay for performance incentives of teachers in com-pulsory education based on equity theory.Modern Primary & Secondary Education, 31(03), 1–4 (in Chinese).
Rivkin, Steven G., Hanushek, Eric A., & Kain, John F. (2005). Teachers, schools, and academic achievement.Econometrica, 73(2), 417–458.
...Springer, M. G., Hamilton, L., McCaffrey, D. F., Ballou, D., Le, V. N., Pepper, M., & Stecher, B. M. (2010). Teacher pay for performance: Experimental evidence from the project on incentives in teaching.National Center on Performance Incentives. Springer, M. G., & Taylor, L. L. (2016). Designing incentives for public school teachers:
Evidence from a Texas incentive pay program.Journal of Education Finance, 41(3), 344–381.
Tsang M, C. (2003). School choice in the People's Republic of China.Choosing choice: School choice in international perspective,164–195.
Wang, H, Yang, C, He, F, et al. (2015). Mental health and dropout behavior: a cross-sectional study of junior high students in northwest rural China.International Journal of Educational Development, 41, 1–12.
Wang, R, & Yu, Z. (2011). Study on the causes and countermeasures of english learning difficulties in Rural Junior Middle School: A Case Study of 105 High School in Yaodu District, Linfen City, Shanxi Province.Basic Education, 8(02), 115–119 (in Chinese). Yuhua, Wang (2018). The causes and transformation strategies of learning difficulties.
Gansu Education,(21), 45.
Zhihui, Wu, & Yuyou, Qin (2016). Rural Education Development in China: An Annual Report.Beijing Normal University Publishing Group.
Yi, H, Zhang, L, Luo, R, et al. (2012). Dropping out: Why are students leaving junior high in China's poor rural areas?International Journal of Educational Development, 32(4), 555–563.