Self-managed
super funds insights
November 2009
CPA Australia Ltd (‘CPA Australia’) is one of the world’s largest accounting bodies with more than 122,000 members of the financial, accounting and business profession in 100 countries. For information about CPA Australia, visit our website cpaaustralia.com.au
First published 2009 CPA Australia Ltd ACN 008 392 452 385 Bourke Street Melbourne Vic 3000 Australia ISBN 978-1-876874-29-2 Legal notice
Copyright CPA Australia Ltd (ABN 64 008 392 452) (“CPA Australia”), 2009. All rights reserved.
Save and except for third party content, all content in these materials is owned by or licensed to CPA Australia. All trade marks, service marks and trade names are proprietory to CPA Australia. For permission to reproduce any material, a request in writing is to be made to the Legal Business Unit, CPA Australia Ltd, 385 Bourke Street, Melbourne, Victoria 3000. CPA Australia has used reasonable care and skill in compiling the content of this material. However, CPA Australia and the editors make no warranty as to the accuracy or completeness of any information in these materials. No part of these materials are intended to be advice, whether legal or professional. Further, as laws change frequently, you are advised to undertake your own research or to seek professional advice to keep abreast of any reforms and developments in the law.
Table of contents 1
Executive summary 2
Key findings 3
About this research 4
Research findings 5
1. Self-managed superannuation funds and consumers 5
1.1 Incidence of self-managed super fund holders in sample 5 1.2 Reasons for having or not having a self-managed super fund 6 1.3 Influencers on the decision to have or not have a
self-managed super fund 7
1.4 Satisfaction with self-managed super funds 9 1.5 Alternatives to self-managed super funds that were considered 9 1.6 Trustees’ understanding of their obligations 10
1.7 Investment strategy 12
1.8 Impact of the global financial crisis on self-managed super funds 13 1.9 Average costs of a self-managed super fund 14
2. Advisers and service providers 15
2.1 Incidence of clients with a self-managed super fund 15 2.2 Estimated number and type of clients with a self-managed super fund 15 2.3 Estimated mean value of clients’ self-managed super funds 16 2.4 Reasons for recommending to establish or not to establish
a self-managed super fund 17
2.5 Alternatives to self-managed super funds 19
2.6 Specific services provided 20
2.7 Breakdown of self-managed super funds by investment type 22 2.8 Impact of the global financial crisis on self-managed super funds 24
3. Outcomes and opportunities 26
3.1 Self-managed super funds now dominate the retirement savings space 26 3.2 Numbers of advisers moving into self-managed super funds
continue to grow 26
3.3 How accountants and CPAs are viewed as sources of advice 27
3.4 Opportunities for advisers 29
Executive summary
Continuing growth in the number of self-managed
superannuation funds (SMSFs) illustrates the important role that they play for retirement saving and estate planning. The number of SMSFs continues to steadily increase. According to the Australia Taxation Office there were just over 410,000 SMSFs at the end of June 2009 with approximately $332 billion in assets, making SMSFs the largest segment of the superannuation market by asset value. This in itself demonstrates that Australians have certainly embraced SMSFs as a useful tool to save for their retirement.
Traditionally accountants have been the dominant source of structuring advice on SMSFs and have proved to be strong proponents of their advantages. However increasing numbers of financial planners have been moving into the SMSF advice market.
SMSF trustees are ultimately responsible for the operation of their superannuation fund and therefore have a greater responsibility than those who are in other forms of
superannuation funds. The penalties for not complying with these obligations can result in significant penalties such as fines, loss of tax concessions or being barred from acting as a trustee of an SMSF.
CPA Australia believe SMSFs are a legitimate and valuable retirement savings vehicle for many Australians but they are not for everyone. The majority of trustees are genuinely saving for their retirement and trying their best to comply with often complex rules and regulations. However, there are perceptions exist that:
SMSFs are being recommended inappropriately •
SMSFs are not as closely regulated as large funds and •
are being used inappropriately for purposes other than saving for retirement
many SMSF trustees do not have the necessary •
knowledge or experience to run their funds effectively and comply with the law.
As a result, CPA Australia commissioned research to see if there was any substance to these perceptions.
CPA Australia previously conducted a research project into SMSFs in 2004. This research project presented an opportunity to update the earlier research.
Key findings
Almost a third of consumers sampled have, used to have •
or have considered having an SMSF.
‘Control’ (of investments and decision-making) was again •
identified as the primary reason for choosing an SMSF, with other individual factors far less influential.
Seventy-six per cent of fund owners sampled are •
satisfied with their SMSF.
Industry funds clearly stood out as an alternative to •
SMSFs for individuals and small business owners. SMSFs are just as likely to be ‘bought’ as ‘sold’. Family •
and friends were the biggest influence (44 per cent) on individuals’ decisions to have their own SMSF.
Seventy-six per cent of consumers sampled stated the •
main purpose of their SMSF is to ‘provide benefits to a member on or after retirement’ or ‘provide benefits to a member after they attain preservation age’. This suggests that the majority of SMSF trustees are legitimately using their SMSF as a vehicle to save for their retirement. There is considerable scope for trustees of SMSFs •
to improve their knowledge of their obligations. For example, only 51 per cent of respondents said that they were a trustee of their SMSF.
There has been little change in the distribution of •
investments since 2004, even with the global financial crisis (GFC). Consumers generally felt the GFC has had a neutral effect on the appeal of equities and a slightly positive impact on cash and fixed interest.
Eighty-four per cent of CPA Australia public practitioners •
and 86 per cent of financial planners surveyed have clients with an SMSF, with growth in all segments providing SMSF advice.
The estimated mean balance of an SMSF for a clients in •
2009 are:
CPA Australia public practitioner $590,000 Random financial planners $707,000 CPA Australia financial planners $669,000
‘Control’ was also cited as the primary reason for •
recommending to establish an SMSF by advisers. Main reasons for not recommending to establish an •
SMSF include insufficient capital / contributions and insufficient skills / knowledge.
There is a trend among service providers of ‘buying •
in’ expertise or outsourcing rather than the principal providing all relevant services to the client.
There is an even higher incidence of managed funds •
being used in conjunction with SMSFs than 2004. Like consumers, advisers felt the GFC had had ‘no •
change’ on the investment decisions of consumers. CPA Australia members were seen as being leaders in •
providing SMSF advice by the bulk of advisers surveyed and there is strong support for CPA Australia to position CPA Australia members as leaders in this space.
About this research
The research was conducted by Di Marzio Research on behalf of CPA Australia.
It consisted of an online survey with 1251 consumers aged 18 and over which included:
179 consumers who currently have an SMSF •
63 consumers who previously owned an SMSF •
166 consumers who had considered establishing •
an SMSF.
Surveys were also conducted by telephone with: 300 randomly selected CPA Australia public •
practitioners (PP);
300 licensed financial planners (FP) made up of •
200 financial planners selected at random –
100 financial planners who are also a member of –
CPA Australia.
The findings from this research have been broken down into the following areas:
1. Self-managed super funds and consumers 2. Advisers and service providers to SMSFs 3. Overall outcomes and opportunities
1. Self-managed superannuation funds and consumers
1.1 Incidence of self-managed super fund holders in sample
An online omnibus survey was conducted, allowing effective access to the community at large from a sample of 1251 respondents across Australia. Graph 1 shows that 32 per cent of those surveyed either have, or used to have, or have considered having, an SMSF. This compares with 29 per cent of those sampled in 2004.
Graph 1: Incidence of self-managed super fund holders in sample
14 14 4 35 32 0 5 10 15 % 20 25 30 35 40 Have an
SMSF Used to havean SMSF SMSF, but haveDon’t have an considered
Never considered
an SMSF I don’t really knowwhat an SMSF is
Of this sample, 14 per cent are currently self-employed or else they are owners or part owners of small businesses. Twenty-four per cent of the rest were previously self-employed or owners or part owner of small businesses. The appeal of SMSFs to the self-employed is readily apparent with these respondents were more likely to have an SMSF or to have previously considered having one than non-small business owners, as demonstrated in Table 1.
Table 1: Incidence of small business owners who have a self-managed super fund
Small business owner Small business ex-owner
Yes (%) No (%) Yes (%)
Have an SMSF now 321 11 13
Used to have an SMSF 7 4 10
Have considered an SMSF 22 13 21
Total 61 28 44
1. Blue figures indicate statistically significant differences to at least the 90 per cent confidence level.
1.2 Reasons for having or not having a self-managed super fund
‘Control’ (39 per cent) was the primary reason given for having an SMSF, consistent with the findings in 2004 (33 per cent). The numbers of small business owners and individuals giving this reason were again similar in 2009, although there was a higher percentage of small business owners citing this reason (49 per cent) compared to individuals (35 per cent).
Table 2: Main reasons for deciding to use a self-managed super fund
Total with an SMSF
2009 (%) 2004 (%)
Better control of my investments / I make decisions 39 33
Recommended by others 4 11
Offers flexibility 7 10
For the tax advantages - 9
Others losing too much / better returns 6 8
Thought I could do better financially than using a paid fund manager - 8
Lower costs / less fees 7 7
Safe / safer 3 6
Was considered the way to go / thought I’d better start - 6
For retirement later / now retired and have time to learn about it 6 6
Simplicity / ease 7 2
Work-related / self-employed 8 3
1. Blue figures indicate statistically significant differences to at least the 90 per cent confidence level.
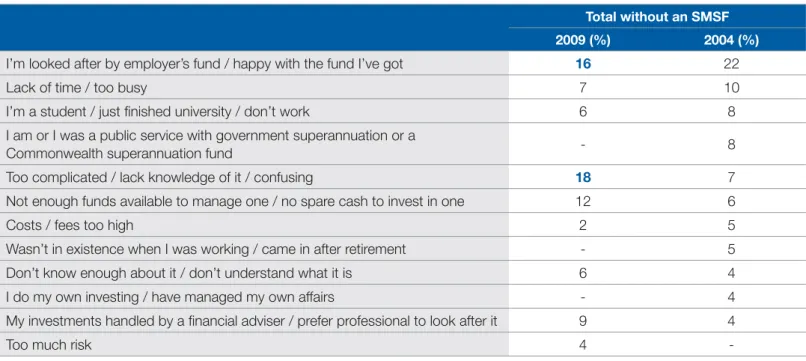
There is no dominant barrier to having a self-managed superannuation fund that can be identified (Table below), but a few themes are apparent in the responses, viz.:
alternatives preferred: •
looked after by employer’s fund / happy with the fund I’ve got (16 per cent); and –
my investments are handled by a financial adviser (9 per cent). –
fears / concerns with SMSF: •
too complicated / lack knowledge/confusing (18 per cent); –
too much risk (4 per cent); and –
costs / fees too high (2 per cent). –
personal situation not conducive: •
not enough funds / no spare cash to invest in one (12 per cent); –
lack of time / too busy (7 per cent); –
don’t know enough about it / don’t understand what it is (6 per cent); and –
don’t work (6 per cent). –
Table 3: Main reasons for not having a self-managed super fund
Total without an SMSF
2009 (%) 2004 (%)
I’m looked after by employer’s fund / happy with the fund I’ve got 16 22
Lack of time / too busy 7 10
I’m a student / just finished university / don’t work 6 8
I am or I was a public service with government superannuation or a
Commonwealth superannuation fund - 8
Too complicated / lack knowledge of it / confusing 18 7
Not enough funds available to manage one / no spare cash to invest in one 12 6
Costs / fees too high 2 5
Wasn’t in existence when I was working / came in after retirement - 5
Don’t know enough about it / don’t understand what it is 6 4
I do my own investing / have managed my own affairs - 4
My investments handled by a financial adviser / prefer professional to look after it 9 4
Too much risk 4
-1. Blue figures indicate statistically significant differences to at least the 90 per cent confidence level.
1.3 Influencers on the decision to have or not have a self-managed super fund
19 22 15 23 18 15 16 21 0 5 10 15 20 25
Accountant Financial planner SMSF specialist Friends or family
%
Graph 2: Incidence of various sources on decision to have a self-managed super fund
Major Minor
Graph 2 illustrates the influence that various people have had on the consumer’s decision to have an SMSF. Interestingly, in 2004 36 per cent of respondents said that their accountant had had a major influence on their decision. In 2009, the figure had dropped to 19 per cent. In 2004 only 15 per cent said that their friends and family had a major influence on their decision. In 2009, this figure had risen to 23 per cent.
Table 4: Influences when they are deciding whether to have an SMSF
Have SMSF
Small business owners (%) Individuals (%)
Of major influence: Accountant 35 13 Financial planner 23 22 SMSF specialist 8 18 Friends / family 21 24 Of minor influence: Accountant 19 17 Financial planner 13 16 SMSF specialist 14 17 Friends / family 20 21
Of major or minor influence:
Accountant 54 29
Financial planner 35 38
SMSF specialist 22 35
Friends / family 42 45
1. Blue figures indicate statistically significant differences to at least the 90 per cent confidence level.
Table 4 shows that when these responses are further broken down into small business owners and individuals, it is the accountant who is most likely to influence the decision of the small business owner. For individuals, again it is family and friends who are the greatest influence, closely followed by financial planners and SMSF specialists.
12 30 16 22 7 18 13 23 9 14 6 15 4 10 11 29 0 5 10 15 20 25 30 35
Major Minor Major Minor Major Minor Major Minor My accountant Financial planner SMSF specialist Friends or family
%
Graph 3: Incidence of various sources on not to have a self-managed super fund
Used to have Considered
Graph 3 shows that individuals who used to have an SMSF or had considered having one were influenced to a small extent by accountants, financial planners, SMSF specialists or friends and family.
For this group, there is an overall sense that friends and family seem to stand out as influencers ahead of accountants and financial planners. Interestingly, those who used to have an SMSF were more likely to say that they were more influenced in their decision to dispose of it by an accountant, financial planner or SMSF specialist than by friends or family.
1.4 Satisfaction with self-managed super funds
Those who have an SMSF are largely satisfied with their decision. As Graph 4 shows, the reasons why included: 29 per cent said they had no problems or were happy with it
•
26 per cent said that they enjoyed good returns •
13 per cent said, ‘I’m in control of my fund’ •
These levels of satisfaction are slightly lower than those of 2004, but the level of dissatisfaction has largely stayed the same. It should be noted that in 2004 the economy was significantly stronger than at present and this could be a reason why the level of satisfaction has fallen.
90 5 5 76 20 4 0 10 20 30 40 % 50 60 70 80 90 100
Satisfied Netural Dissatisfied 2004 2009
Graph 4: Satisfaction with self-managed super fund
1.5 Alternatives to self-managed super funds that were considered
Industry funds were clearly the most popular alternative to SMSFs among respondents to the survey. Thirty-six per cent of the individuals surveyed and 32 per cent of small business owners surveyed reported that they had considered industry funds as an alternative to their SMSF. This is true for both individuals and small business owners, although the latter were above average in considering retail funds (21 per cent to 8 per cent)
Industry funds were considered most of all by the trade qualified respondents (42 per cent).
Fifteen per cent of metropolitan respondents had considered retail funds as compared with only 7 per cent of regional or rural respondents. This was also true for small APRA funds (10 per cent and 2 per cent).
Graph 5: Alternatives considered to a self-managed super fund 36 32 21 6 8 9 10 8 0 5 10 15 % 20 25 30 35 40
Industry funds Retail funds Small APRA funds Master funds and WRAPS Individuals Small business owners
1.6 Trustees’ understanding of their obligations
Overall, just over half of the consumers surveyed (51 per cent) said that they were a trustee of their SMSF. Small business owners fared better in this result with 74 per cent stating they were trustees. This is in line with the results in 2004 (79 per cent). Sixty-nine per cent of consumers (59 per cent of the individuals and 82 per cent of the small business owners) said they felt they had a good understanding of their obligations.
Knowledge of self-managed super fund: its purpose and limitations
All consumers were asked what was the main purpose of their SMSF. Seventy-six per cent said it was for providing retirement benefits. Individuals and small business owners provided nearly identical responses:
61 per cent of individuals and 63 per cent of small business owners said it was to provide benefits to a member on or after •
retirement
13 per cent of individuals and 16 per cent of small business owners said it was to provide benefits to a member after they •
attained preservation age
Only 6 per cent of individuals and 8 per cent of small business owners said it was to provide benefits to a member’s •
beneficiaries if a member dies
20 per cent of individuals and 12 per cent of small business owners said that it was for a purpose other than those listed •
above.
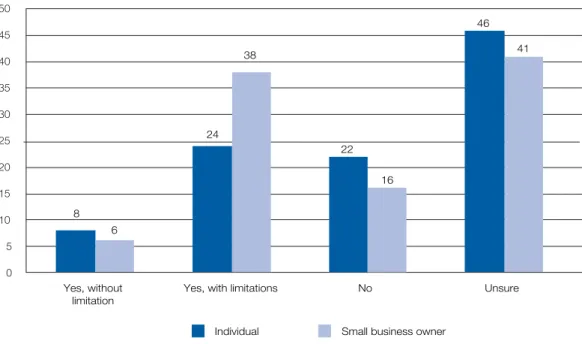
Graph 7 shows that only 24 per cent of individuals and 38 per cent of small business owners are aware that in certain circumstances an SMSF can borrow money. Nearly 70 per cent of individuals and 57 per cent of small business owners were unsure or said no, an SMSF cannot borrow money.
Graph 6: Can self-managed super funds borrow money? 8 24 38 22 16 46 41 6 0 5 10 15 20 % 25 30 35 45 40 50 Yes, without
limitation Yes, with limitations No Unsure Individual Small business owner
Consumers were asked to specify the maximum percentage of assets an SMSF can invest in a related party. Seventy-two per cent answered 5 per cent or less and 24 per cent answered ‘don’t know’, showing that most trustees understood this limitation. All respondents were asked a series of questions relating to other limitations on SMSFs. Their responses are summarised in Table 5. Looking at these results, it is clear that SMSF holders need to improve their knowledge. In both groups there are sizeable proportions who are unsure or not aware of the options and benefits of an SMSF, despite 69 per cent saying that they felt they had a ‘good understanding’ of their obligations as an SMSF trustee.
Table 5: Knowledge and understanding of limitations of a self-managed super fund
Questions
Have an SMSF
Individual (%) Small business owner (%) Total (%)
Can assets other than cash (also referred to as in-specie contributions) be transferred into an SMSF?
Yes, without limitations 14 14 14
Yes, with limitations 21 28 23
No 20 8 16
Unsure 45 51 47
Can trustees of SMSFs lend money to another member or relative of a member using the resources of the SMSF?
Yes, without limitations 7 - 5
Yes, with limitations 12 13 12
No 36 47 39
Unsure 46 41 44
Can an SMSF acquire assets from a related party?
Yes, without limitations 7 2 5
Yes, with limitations 19 34 23
No 24 21 23
Instalment warrant borrowings
The 36 per cent of consumers who believed an SMSF can borrow money (with or without limitations) were then asked if they had used an instalment warrant to borrow money for their SMSF. Only 10 had borrowed via an instalment warrant.
It was found that small business owners were more likely to answer yes to this question. It was also found that just over one-third of individuals were unsure if they had used this borrowing option.
Table 6: Has your self-managed super fund borrowed to invest via the instalment warrant provisions? Have an SMSF
Individual (%) Small business owner (%) Total (%)
Has your SMSF borrowed money to invest via instalment warrants?:
Yes 11 32 19
No 54 68 59
Don’t know 35 - 22
If yes, did you invest via: (4) (6) (10)
a traditional or commercially available instalment warrant? 100 61 76
a structured arrangement unique to your fund? - 24 15
Or do you not know? - 9 6
If yes, investment via instalment warrant is in:
equities 60 37 45
business real / property 40 24 30
other property - 6 4
other types of investment - 24 15
Don’t know - 9 6
1. Blue figures indicate statistically significant differences to at least the 90 per cent confidence level.
1.7 Investment strategy
When asked if their SMSF has an investment strategy, one-third were unsure if their fund had a strategy and a further 13 per cent said no. Small business owners were more likely to say yes (67 per cent) than individuals (48 per cent). Sixty per cent of those with an investment strategy said that it was formally documented.
The distribution of investments in the SMSFs is shown in Graph 7. Each of the four types of investments has a minority share overall, but none is insignificant. Cash and fixed interest are most popular followed by equities. These results are similar to those of 2004.
Graph 7: Mean estimated percentage of total investments of a self-managed super fund 27 30 19 21 39 32 15 17 0 5 10 15 20 % 25 30 35 45 40
Equities Business real property Cash and fixed interest Others types of investment, e.g. property
or collectables Individuals Small business owners
1.8 Impact of the global financial crisis on self-managed super funds
The research also extended to see how the GFC may have impacted on the investment decisions of the SMSF trustees. Graph 8 shows that there has been a mixed reaction to the GFC consistently across all asset classes. However, on average a third of those surveyed have made ‘no change’ to their asset allocation since the GFC.
Nearly 30 per cent said that they would now be ‘more likely to invest in’ cash, which is not surprising in the current economic climate. However, nearly 25 per cent did say that they would be ‘more likely to now invest in equities’. Considering that 81 per cent of consumers advised that their SMSF is currently in accumulation phase building up for the retirement, this result is not unexpected.
Graph 8: How has the GFC impacted on your investment decisions?
23 19 34 25 27 18 34 21 27 15 37 21 17 21 38 24 0 5 10 15 % 20 25 30 35 40
Equities Business real property
Cash and fixed interest
Other types of investments
Consumers were also asked if the GFC has impacted on the level of advice they seek from professionals to manage their self-managed superannuation fund. Graph 9 shows that while small business owners were slightly more likely to seek advice during these times, nearly 50 per cent said that there had been no change in the amount of advice they would seek.
20 28 22 18 11 16 50 59 46 16 2 12 0 10 20 30 40 50 60 70
Increased Decreased Not Changed Don’t know
%
Graph 9: Amount of advice sought since the GFC
Individuals Small business owners Total
1.9 Average costs of a self-managed super fund
Table 7 shows the average costs of maintaining an SMSF for individuals and small business owners. It can be seen that the costs have increased since 2004.
Table 7: Costs of maintaining a self-managed super fund
Cost of maintaining an SMSF
Have an SMSF
Individual (%) Small business owner (%) Total (%) 2004 total (%)
Under $1000 p.a. 38 48 41 45 $1000 to $2999 p.a. 15 24 18 29 $3000 to $4999 p.a. 10 7 9 8 Over $5000 p.a. 4 6 5 3 Don’t know 33 16 28 15 Mean $ p.a. 1900 1800 1900 1588
2. Advisers and service providers
This section focuses on the research results for service providers and advisers to SMSFs. This group consists of CPA Australia public practitioners, CPA Australia licensed financial planners and randomly selected financial planners. It should be noted that of those financial planners sampled, 86 per cent were a representative or a authorised representative of an Australian Financial Services licence (AFSL) holder and the remaining 14 per cent held their own AFSL. This was true for the CPA Australia financial planners and the sample of financial planners selected at random.
2.1 Incidence of clients with a self-managed super fund
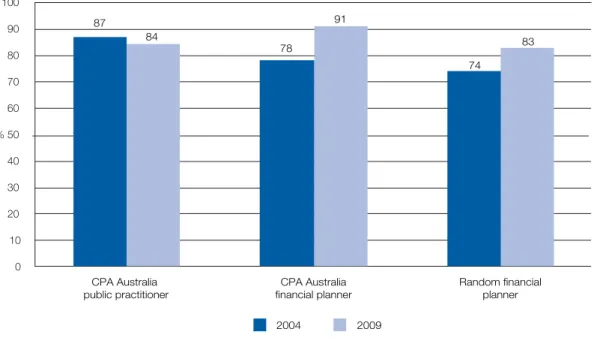
Graph 10 illustrates the incidence of clients with an SMSF for 2004 and 2009. While the percentage of CPA Australia public practitioners who have clients with SMSFs has remained fairly constant over this period, CPA Australia financial planners and random financial planners have each had an increase in the incidence of their clients who have an SMSF. These results would seem to be consistent with the increasing popularity of SMSFs and the fact that they now hold nearly 32 per cent of all superannuation assets, making them the largest segment, by asset value, of the superannuation market.
Graph 10: Incidence of clients with a self-managed super fund
87 84 78 91 74 83 0 10 20 30 40 % 50 60 70 90 80 100 CPA Australia public practitioner CPA Australia financial planner Random financial planner 2004 2009
2.2 Estimated number and type of clients with a self-managed super fund
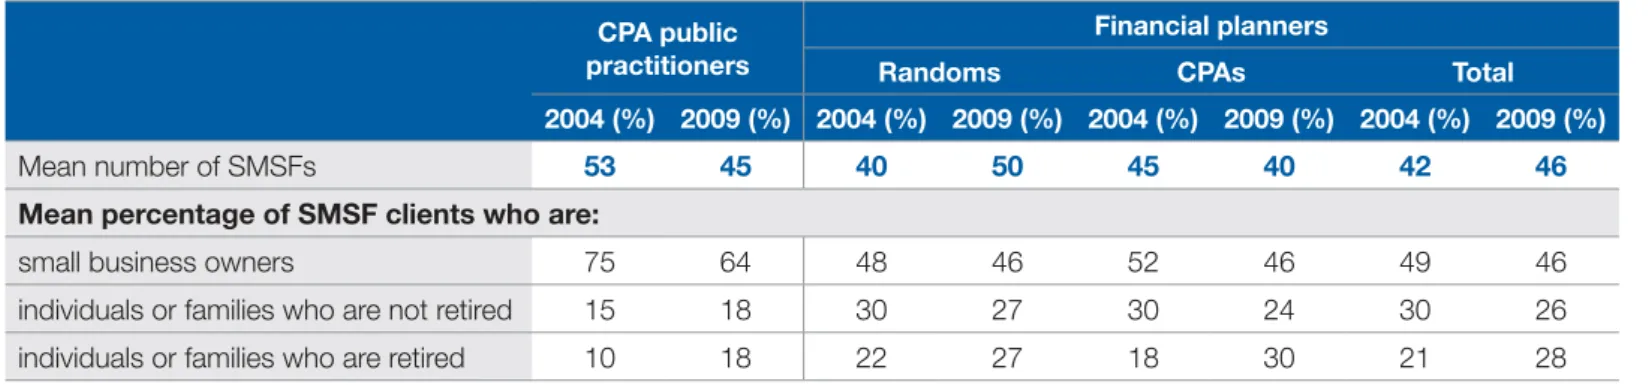
Table 8 shows that there has been no significant shift in the number of clients with an SMSF that a practitioner or adviser currently has compared to in 2004. This demonstrates that though there are steadily increasing numbers of consumers with an SMSF, there are also increasing numbers of practitioners and financial advisers entering this space.
It is also evident that almost two-thirds of the SMSF clients of a CPA Australia public practitioner are small business owners, whereas the clients of financial planners are more likely to be individuals and families.
Table 8: Estimated number and type of clients with a self-managed super fund CPA public
practitioners
Financial planners
Randoms CPAs Total
2004 (%) 2009 (%) 2004 (%) 2009 (%) 2004 (%) 2009 (%) 2004 (%) 2009 (%)
Mean number of SMSFs 53 45 40 50 45 40 42 46
Mean percentage of SMSF clients who are:
small business owners 75 64 48 46 52 46 49 46
individuals or families who are not retired 15 18 30 27 30 24 30 26
individuals or families who are retired 10 18 22 27 18 30 21 28
1. Blue figures indicate statistically significant differences to at least the 90 per cent confidence level.
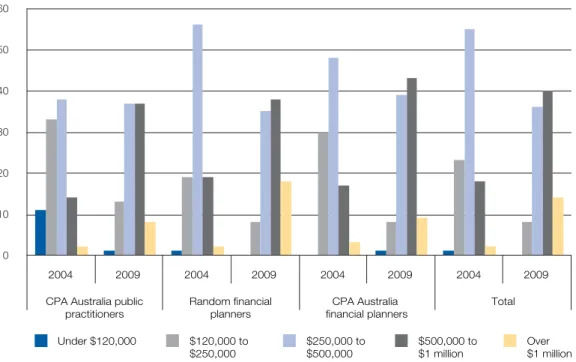
2.3 Estimated mean value of clients’ self-managed super funds
All respondents were asked to estimate the average size of funds within the SMSFs of their clients. Graph 11 provides a breakdown of these responses for each segment and overall.
Graph 11: Estimated funds in client’s self-managed super fund
1 1 13 8 8 8 37 35 39 36 37 38 43 40 8 18 9 14 0 5 10 15 20 25 30 35 45 40 50 Under $120,000 $120,000 to $250,000 $120,000 to $500,000 $500,000 to $1 million Over $1 million CPA Australia public practitioners Random financial planners CPA Australia financial planners Total $’000s
When compared to the average balances of their clients’ SMSFs in 2004 as illustrated in Graph 12, it can be seen that there has been an increase in the value of funds across all segments.
0 10 20 30 40 50 60 2004 2009 2004 2009 2004 2009 2004 2009 CPA Australia public
practitioners Random financial planners CPA Australia financial planners Total
Graph 12: Estimated average size of client’s self-managed super fund in 2004 and 2009
Under $120,000 $120,000 to $250,000 $250,000 to $500,000 $500,000 to $1 million Over $1 million $,000s
This is supported by the fact that the mean balance of an SMSF for each segment sampled has increased as shown in Table 9, as would be expected when saving for retirement.
Table 9: Estimated mean value of self–managed super funds in 2004 and 2009
CPA Australia public practitioners Random financial planners CPA Australia financial planners
2004 $355,000 $430,000 $419,000
2009 $590,000 $707,000 $669,000
2.4 Reasons for recommending to establish or not to establish a self-managed super fund
While the reasons for recommending the establishment of an SMSF given by respondents in 2009 are similar to those given in 2004, the ‘gives control over investments/savings’ response was even more frequent for all groups in 2009. This is also consistent with the main reasons provided by consumers for wanting to use an SMSF as shown in Table 2.
Table 10: Main reasons for recommending that clients do establish a self-managed super fund Main reasons for recommending that
clients establish an SMSF
CPA public practitioners
Financial planners
Randoms CPAs Total
2004 (%) 2009 (%) 2004 (%) 2009 (%) 2004 (%) 2009 (%) 2004 (%) 2009 (%)
Gives control over investments/savings 42 60 47 69 56 75 50 72
Tax advantages 29 27 7 7 12 9 8 8
Good way of planning towards
retirement/for future 20 18 5 5 8 11 6 8
Flexibility 13 4 20 14 31 13 23 14
Need reasonable finance base to
start/ability to contribute 11 2 18 4 10 3 15 4
Cost savings to client/less
administrative fees 11 3 14 14 9 8 12 12
Offers good return/wealth creation
opportunities 6 1 1 - 4 1 2 0
Estate planning / property ownership/
direct property 3 2 12 19 12 11 12 16
Depends entirely on individual
circumstances - 2 - 9 - 9 - 9
1. Blue figures indicate statistically significant differences to at least the 90 per cent confidence level.
CPA Australia public practitioners also cited ‘tax advantages’ more frequently than did financial planners.
Table 11: Main reasons for recommending that clients do not establish a self-managed super fund Main reasons for recommending that
clients do not establish an SMSF
CPA public practitioners
Financial planners
Randoms CPAs Total
2004 (%) 2009 (%) 2004 (%) 2009 (%) 2004 (%) 2009 (%) 2004 (%) 2009 (%) Insufficient capital funds/inability to
maintain contributions 51 61 50 72 58 52 52 64
Need a level of competence/skills/
knowledge to run SMSFs 29 49 27 57 26 53 26 56
Cost/can be expensive to set up/
ongoing costs/audit costs 25 21 30 32 9 29 23 31
Regulatory requirements/compliance
obligations 10 1 10 1 21 3 13 2
Need to be disciplined/focused/
take responsibility 9 1 21 2 10 3 17 2
Need to be good at keeping records/
lots of paperwork 7 - 4 3 1 3 3 3
Completely unsuitable for their needs 6 1 5 1 4 5 5 2
Need to allow considerable time
to administer 4 1 8 1 5 1 7 1
Trustee obligations 5 1 5 4 3 5 4 4
1. Blue figures indicate statistically significant differences to at least the 90 per cent confidence level.
Other reasons to note include:
‘need a level of competence/skills/knowledge to run an SMSF’ •
‘cost/can be expensive to set up/ongoing costs/audit costs’ •
2.5 Alternatives to self-managed super funds
All financial planners advisers currently providing SMSF advice were asked what alternatives they consider when making a recommendation. The results are shown in Graph 13.
Graph 13: Options considered when providing advice to establish a self-managed super fund
82 68 75 66 42 54 39 24 32 82 79 80 89 86 82 0 10 20 30 40 % 50 60 70 90 80 100
Retail funds Industry funds Master funds and wraps
Remaining in their current fund Small APRA
funds
Random financial planners CPA Australia financial planners Total
Graph 14 shows that while master funds and wraps appear to be the most popular choice for financial planners, all retirement savings vehicles have their appeal.
Graph 14: Estimated mean percentage of clients recommend these products to
5 10 15 % 20 25 30 35 40 30 22 15 10 36 23 30 25 16 3 35 27 30 23 15 7 35 25
2.6 Specific services provided
The respondents who said that they provide advice to clients with an SMSF about that fund, were then asked which services they provide in their practice. Table 12 summarises these findings and compares it to the results of the survey conducted in 2004.
Table 12: Specific self-managed super fund services provided by the respondent or another in the firm CPA public
practitioners
Financial planners
Randoms CPAs Total
2004 (%) 2009 (%) 2004 (%) 2009 (%) 2004 (%) 2009 (%) 2004 (%) 2009 (%)
Service provided by the respondent:
Fund establishment 58 31 39 31 50 40 43 35
Preparation of trust deeds 3 4 7 6 5 3 7 5
Administration 66 35 44 31 55 32 48 32
Audit 61 32 25 12 37 18 29 15
Investment management 15 6 84 76 77 66 82 71
Insurance 10 2 73 64 43 47 63 56
Broad investment advice 39 19 94 85 82 77 90 81
Specific product recommendations 15 1 92 85 75 71 86 79
Training to trustees on their obligations 61 52 58 50 68 56 62 53
Any of the above 94 80 99 95 100 89 99 92
Service provided by others in the firm:
Fund establishment 18 30 14 27 18 27 15 27
Preparation of trust deeds 2 5 5 6 2 1 4 4
Administration 30 42 22 46 18 45 21 45
Audit 26 39 17 19 17 24 17 21
Investment management 10 20 30 55 22 49 27 52
Insurance 7 14 29 56 17 39 25 49
Broad investment advice 14 27 29 63 23 51 27 58
Specific product recommendations 9 20 29 58 20 48 26 54
Training to trustees on their obligations 19 40 23 39 15 39 20 39
Any of the above 42 73 48 85 40 74 45 80
1. Blue figures indicate statistically significant differences to at least the 90 per cent confidence level.
In 2004 virtually all respondents provided at least one of the services listed, as illustrated by the results for the ‘any of the above’ row, while in 2009 all groups are less likely to provide any of the listed services.
The section of the table ‘provided by others in the firm’ shows that principals are now more likely to buy expertise into the firm rather than provide all the services themselves.
This is particularly true for CPA Australia firms, who have evidently have hired more staff able to provide services for SMSF clients in a number of ways since 2004
Table 13: Specific self-managed super fund services that are outsourced
Outsourced services:
CPA public practitioners
Financial planners
Randoms CPAs Total
2004 (%) 2009 (%) 2004 (%) 2009 (%) 2004 (%) 2009 (%) 2004 (%) 2009 (%)
Fund establishment 34 54 57 61 45 48 53 55
Preparation of trust deeds 91 89 87 88 97 91 91 89
Administration 16 17 44 48 30 34 39 42
Audit 33 40 61 73 55 64 59 69
Investment management 52 36 7 6 12 10 9 8
Insurance 55 39 15 11 33 31 21 20
Broad investment advice 37 27 3 2 10 7 5 4
Specific product recommendations 46 30 4 3 15 10 8 6
Training to trustees on their obligations 19 11 27 27 23 9 25 14
Any of the above 95 94 93 94 98 97 95 95
1. Blue figures indicate statistically significant differences to at least the 90 per cent confidence level.
The trend to buying in expertise seems to also be supported by the fact that there is almost universal outsourcing of services among the respondents providing advice to clients about their self-managed superannuation funds.
Not surprisingly the services most prominently outsourced include preparation of trust deeds (89 per cent) and audit (69 per cent). Respondents were also asked if there were any other services in relation to SMSFs that were also offered, either internally or externally, apart from the services listed in the previous section. Financial planners (45 per cent) and public practitioners (51 per cent) are each likely to offer ‘other’ services on SMSFs.
Among the other SMSF services offered, taxation (77 per cent) and general accounting services (40 per cent) were generally nominated by CPA Australia public practitioners, whereas the randomly selected financial planners mostly nominated investment strategies (31 per cent) and retirement planning advice (22 per cent).
CPA Australia practitioners who outsource particular services were also asked who they outsourced these services to. Table 10 shows that they tend to favour external financial planners for:
Specific product recommendations (56 per cent) •
Broad investment advice (61 per cent) •
Investment management (49 per cent). •
SMSF specialists were popular among CPA Australia public practitioners for the following services: Fund establishment (61 per cent)
•
Preparation of trust deeds (58 per cent) •
Administration (46 per cent) •
Audit (58 per cent) •
Training to trustees on their obligations (50 per cent). •
Table 14: To whom do CPA Australia practitioners outsource their self-managed super fund services?
Outsourced services:
Directed by public practitioners to:
(BASE) No. External financial
planner SMSF specialist Other
2004 (%) 2009 (%) 2004 (%) 2009 (%) 2004 (%) 2009 (%) 2004 (%) 2009 (%)
Fund establishment 25 14 58 61 25 29 36 76
Preparation of trust deeds 19 5 51 58 33 37 96 127
Administration 47 25 47 46 18 33 17 24
Audit 20 2 46 58 34 40 35 57
Investment management 62 49 27 33 15 20 55 51
Insurance 38 27 33 30 29 45 58 56
Broad investment advice 64 61 23 26 15 16 39 38
Specific product recommendations 69 56 25 33 8 14 48 43
Training to trustees on their obligations 30 13 45 50 20 38 20 16
1. Blue figures indicate statistically significant differences to at least the 90 per cent confidence level.
It is interesting to note that the only outsourced service where an external financial planner or SMSF specialist is not the most favoured option is insurance, where 45 per cent of CPA Australia public practitioners prefer another option.
2.7 Breakdown of self-managed super funds by investment type
In 2009 there is little difference between the different groups in terms of the investment type breakdown. This was also found in 2004. Assets such as private property or collectables remain a lot less popular than other kinds of assets for investment.
0 10 20 % 30 40 50 46 47 48 47 24 21 18 20 8 5 8 8 22 24 26 25 60
Graph 15: Estimated breakdown of self-managed super funds by investment type
Equities Business real property Cash and fixed interest Others types of investment, such as property or collectables CPA Australia
public practitioners Random financialplanners CPA Australiafinancial planners Total
Graph 16: Do you use managed funds in conjunction with self-managed super funds for your clients? 0 10 20 30 40 % 50 60 70 90 80 100 2004 2009 2004 2009 2004 2009 2004 2009 CPA Australia public practitioners Random financial planner CPA Australia financial planner Total Yes No
All advisers and SMSF service providers were asked if they had clients who had borrowed via instalment warrants within their SMSF. It was found that only around 3 per cent of SMSF clients have used instalment warrants as a borrowing option to make investments.
Table 15: How clients’ self-managed super funds are administered
How the client’s SMSF is administered:
CPA public practitioners
Financial planners
Randoms CPAs Total
2004 (%) 2009 (%) 2004 (%) 2009 (%) 2004 (%) 2009 (%) 2004 (%) 2009 (%)
Via an internal administration system 47 31 36 36 38 32 37 35
Via a commercially available admin package 14 27 20 29 27 24 22 27
Wraps 9 24 50 60 42 55 47 58
It is outsourced 7 4 6 1 - 2 4 1
They do it themselves 3 4 6 1 - - 4 0
1. Blue figures indicate statistically significant differences to at least the 90 per cent confidence level.
2.8 Impact of the global financial crisis on self-managed super funds
As with the consumers surveyed in this research, the CPA Australia public practitioners and financial planners were asked how they felt the GFC had affected the extent to which their clients invested in the different asset classes. Overall there were very similar responses across the board and these are captured in Graph 17.
Graph 17: Impact of the GFC on clients’ investment decisions
0 10 20 30 % 40 50 60 70 80
Equities Business real property
Cash and fixed interest
Other types of investments More likely now to invest in Less likely now to invest in No change Don’t know 21 1 26 51 18 9 67 7 48 9 42 1 9 10 8 73
Advisers and consumers have very similar views on how the GFC has affected consumers’ investment decisions. Approximately 35 per cent of consumers said that they felt the GFC had not affected their investment decisions, with the same view held by advisers, although to a much greater extent.
Respondents were also more likely to say that the global financial crisis has made their clients seek more advice rather than less. (Graph 18). This was true for both CPA Australia public practitioners and financial planners, albeit to a slightly greater extent among the financial planners. Forty-one per cent also said that the GFC had ‘not changed’ the amount of advice their clients are seeking. This corresponds with the 46 per cent of consumers who said the same thing when asked this question (Graph 9).
0 10 20 % 30 40 50 52 43 51 51 60 5 5 9 7 49 43 40 41 3 1 Graph 18: How the GFC has affected the amount of advice sought by clients
Increased Decreased Not changed Don’t know CPA Australia public practitioners Random financial planners CPA Australia financial planners Total
3. Outcomes and opportunities
3.1 Self-managed super funds now dominate the retirement savings space
The number of SMSFs still continues to increase steadily, with just on 29,000 established in the year to 30 June, taking the total number of SMSFs to just over 410,000. With approximately $332 billion in assets, SMSFs now represent the largest segment, by asset value, of the superannuation market.
3.2 Numbers of advisers moving into self-managed super funds continue to grow
In 2004, 35 per cent of CPA Australia public practitioners were providing SMSF advice or services. By 2009, this had increased to 47 per cent. Similarly in 2004, 59 per cent of CPA Australia financial planners provided SMSF advice or services but in 2009 that number had increased to 82 per cent.
A further 8 per cent of CPA Australia financial planners also indicated that although they do not yet provide these services, they expect or would like to provide them. This means that 90 per cent of CPA Australia financial planners either currently provide SMSF services and advice or would like to provide them in the future.
The responses of randomly selected financial planners indicate a similar trend, with 55 per cent providing advice or services in 2004 and 68 per cent in 2009, with a further 11 per cent currently indicating they expect to provide those services or would like to do so.
Graph 19: Do you provide self-managed super fund advice or services?
0 10 20 47 11 11 10 10 17 21 82 73 8 42 68 30 40 % 50 60 70 80 90 CPA Australia
public practitioners Random financial planners financial plannersCPA Australia Total Yes No, but expect or would like to No, and don’t expect to
This figure again demonstrate that even though the numbers of SMSFs continue to grow, so does the number of advisers moving into this space.
3.3 How accountants and CPAs are viewed as sources of advice
Consistent with the findings in 2004, those consumers with an opinion, particularly those who have an SMSF, are much more likely to view accountants favourably than unfavourably.
Graph 20: Consumer opinion of accountants as a source of advice on self-managed super funds
0 10 20 30 % 40 50 60 70 80
Positive Negative No opinion 51 8 40 40 12 48 33 11 55 23 9 68 2004 2009 2004 2009 Have a self-managed super fund Do not have a self-managed super fund
Small business owners are more likely than individuals to have an opinion and, while only a minority had a negative opinion, just over 50 per cent of those surveyed had a positive opinion of accountants as a source for SMSF advice.
Table 16: The opinions of small business owners and individuals on accountants as a source of advice about self-managed super funds
Opinion of accountants
Have an SMSF
Small business owners % Individuals %
Positive 51 35
Negative 16 10
No opinion 33 55
1. Blue figures indicate statistically significant differences to at least the 90 per cent confidence level.
The main reasons given for a positive opinion of accountants were: Knowledgeable / know what they’re doing /experts (30 per cent) •
Offer sound advice / happy with their advice (23 per cent). •
Advisers and service providers were also asked if they consider CPA Australia members to be the leaders in providing advice on SMSFs. Not surprisingly nearly 80 per cent of CPA Australia public practitioners and 62 per cent of CPA Australia financial planners said yes. However, nearly 60 per cent of randomly selected financial planners also said yes.
CPA Australia
public practitioners Random financial planners financial plannersCPA Australia Total
77 59 62 60 16 35 29 33 8 6 9 7 0 10 20 30 40 50 60 70 80 90 %
Yes No Don’t know
Graph 21: Do you believe CPAs are seen as leaders in providing advice about self-managed super funds?
This demonstrates that CPA Australia members remain not only a trusted source of professional advice for consumers, but that they are acknowledged by those in the industry as being leaders in providing SMSF advice.
Furthermore, when asked if CPA Australia should position CPAs as leaders for SMSF advice nearly half of randomly selected financial planners said yes, as demonstrated by Graph 22.
Yes No Don’t know
Graph 22: Should CPA Australia position CPAs as leaders for advice about self-managed super funds?
CPA Australia
public practitioners Random financial planners financial plannersCPA Australia Total
88 47 73 57 6 38 21 31 8 15 7 12 0 10 20 30 40 50 60 70 80 90 100 %
The main reasons given for this included:
CPAs are well qualified and able to provide such advice. This includes the fact that they have a holistic knowledge of their •
client’s needs
it’s what their clients want, need and expect. •
This recognition presents an opportunity for CPA Australia members to continue to demonstrate their expertise and leadership in being trusted and professional advisers for consumers in respect of SMSFs.
3.4 Opportunities for advisers
Clearly this is a growing market and the strongest attraction to establishing an SMSF is control. Consumers want to take control of their own financial security in retirement. However, this brings a burden of responsibility. It is here that the greatest opportunities lie for service providers and financial advisers.
The ATO has expressed concern that trustees in general currently lack the knowledge and expertise needed to run their own SMSF. The findings of this research would support that concern, given the following statistics:
only 51 per cent of consumers stated they were a trustee of their SMSF •
sixty-nine per cent still said they felt they had a good understanding of their obligations •
around 40 per cent of all trustees sampled were ‘unsure’ when asked a series of questions to assess their knowledge and •
understanding of their obligations.
While 52 per cent of CPA Australia public practitioner and 92 per cent of financial planners currently provide training to the trustees on their obligations, our research shows that it is essential that advisers continue to provide this service to their clients. It also shows that advisers must emphasise the importance to their clients, who are trustees, of understanding their obligations. Helping trustees to understand their obligations provides an opportunity to build an even stronger and longer lasting