This is an
Accepted Manuscript
, which has been through the
Royal Society of Chemistry peer review process and has been
accepted for publication.
Accepted Manuscripts
are published online shortly after
acceptance, before technical editing, formatting and proof reading.
Using this free service, authors can make their results available
to the community, in citable form, before we publish the edited
article. We will replace this
Accepted Manuscript
with the edited
and formatted
Advance Article
as soon as it is available.
You can find more information about
Accepted Manuscripts
in the
Information for Authors
.
Please note that technical editing may introduce minor changes
to the text and/or graphics, which may alter content. The journal’s
standard
Terms & Conditions
and the
Ethical guidelines
still
apply. In no event shall the Royal Society of Chemistry be held
responsible for any errors or omissions in this
Accepted Manuscript
or any consequences arising from the use of any information it
contains.
Accepted Manuscript
Journal of
Materials Chemistry C
Journal Name
RSC
Publishing
ARTICLE
Cite this: DOI: 10.1039/x0xx00000x
Received 00th January 2012, Accepted 00th January 2012 DOI: 10.1039/x0xx00000x
www.rsc.org/
Chemistry of Active Oxygen in RuO
x
and Its
Influence on the Atomic Layer Deposition of TiO
2
Films
Woojin Jeon,
aWoongkyu Lee,
aYeon Woo Yoo,
aCheol Hyun An,
aJeong Hwan
Han,
bSeong Keun Kim,
cand Cheol Seong Hwang
a,*Rutile structured TiO2 films have received great attention as a dielectric of capacitors of the
next-generation dynamic random access memory (DRAM) due to its high dielectric constant (80 – 150). Ru or RuO2, which is one of the most promising electrode materials in DRAM
capacitors, is dispensable to form the rutile structure. In this work, a series of the Ru-related layers with compositions ranging from Ru to RuO2 via RuOx (x: ~1.12) was used as a bottom
electrode for the ALD growth of TiO2 films. It was found that the growth per cycle of TiO2 at
the initial growth stage was drastically increased on RuOx (RuO2/Ru mixture) compared to Ru
and RuO2. This is attributed to the drastic increase in the chemical activity of oxygen in the
mixture film of RuO2/Ru. The catalytic decomposition of RuO2 with the help of Ru in the film
played the crucial role for the increase in the active oxygen. While RuO2 and Ru mostly
retained their structures during the ALD of TiO2 or chemical etching using O3 gas, the RuOx
film, which was composed of 56% RuO2 and 44% Ru, drastically changed its phase
composition during the ALD of TiO2 at 250 °C and became almost Ru. Other chemical effects
depending on the chemical composition and phase structure were also examined in detail.
I. INTRODUCTION
Atomic layer deposition (ALD) is a highly intriguing thin-film growth technique with self-regulating and self-terminating properties due to the saturated chemical reactions between the adsorption sites and the chemically adsorbing precursor molecules.1-5 Such characteristics of ALD provided the films
with high uniformity over a large surface area, having an extremely topographically complicated shape and atomic-scale accuracy in thickness control. These optimal thin-film growth properties very well meet the stringent requirements of the highly scaled semiconductor fabrication processes, and as such, many of the conventional film growth processes that depend on the chemical vapour deposition (CVD) technique are now being replaced with the ALD processes,6, 7 although ALD was originally suggested for a thicker film growth with high thickness accuracy over a large glass surface for display application.8
In such ALD processes, the substrate plays a crucial role by taking part in the ALD-specific chemical reactions. The surface of the substrate must provide the chemical adsorption sites, which would anchor the incoming metal or non-metal precursors via the ligand exchange reactions. On the same line of consideration, the surface of the growing film should also provide the reaction sites for the continuous film growth while the density and chemical activity of these sites on the growing film may differ from those on the substrate. In either case, the
atoms or elements that were already incorporated into the film during the previous ALD step are generally not supposed to play an active role in the next ALD step. There are other cases, however, where the oxygen ions (or atoms) inside the film play the crucial role in the film growth. It has been reported experimentally and theoretically that many of the platinum family metals, such as Ru, Pd, Rh and Ag, come to have subsurface oxygen when the surface of these metals are saturated with adsorbed oxygen atoms by the pulse of a sufficient amount of oxygen gas.9 Such subsurface oxygen atoms do not form a strong chemical bond with the neighbouring metal atoms and expand the metal crystal structure, making them highly vulnerable to the chemical reaction with the ligands of the subsequently supplied MO precursors. This is the basic mechanism for the noble metal film growth even when no reducing agent was adopted; the oxygen atoms contained within the metal film surface (subsurface oxygen) strongly anchor the incoming MO precursors during the subsequent MO precursor pulse step. They eventually react with the ligands of the adsorbed MO molecules, and the reaction by-products desorb from the surface.10 Such ALD reaction route could be provided by the
elegant balance between the weak chemical bonding energy of Ru-O and the stronger reactivity between the ligand and the O atoms, which were extracted from the subsurface region of the
growing film.
Journal
of
Materials
Chemistry
C
Accepted
Manuscript
ARTICLE Journal Name
Another example of the active role of oxygen in the substrate on the oxide film growth via ALD is the supply of oxygen atoms from the fully oxidized conducting oxides, such as RuO2
and IrO2, to the MO precursors adsorbing on the surface during
the pulse step of the MO precursors.11 This generally results in an excessively high growth rate of the oxide films at the early stage of ALD, and substantial oxide film growth even with only MO precursor pulses. This is especially serious when the metal ions in the growing oxide films have a much higher oxidation potential than Ru or Ir, and when the growth temperature is higher.11-13 A typical example can be found from the SrO and TiO2 film growth on those bottom electrode layers at a substrate
temperature (Ts) of 370 °C,11, 12 which becomes much less
severe when the Ts is decreased.13 Another complication
regarding the substrate-oxygen-induced ALD can be found when a highly oxidizing oxygen source such as O3 is adopted
for the oxide film growth, which can induce the in-situ oxidation of the underlying Ru bottom layer.14, 15 For the case of the ALD of TiO2 on the metal Ru electrode, using
titaniumtetraisopropoxide (Ti(O(C3H7))4, TTIP) and O3 as the
Ti precursor and oxygen source, respectively, the O3 in situ
oxidized the Ru substrate, and the resulting ~1-nm-thick RuO2
induced the phase transition of TiO2 from anatase to rutile
through the local epitaxial relationship.14 Rutile TiO2 thin films
have a dielectric constant of ~130,16 which is the highest among the reported polycrystalline binary dielectric films with <10 nm thickness. This is an extremely promising aspect of this material for the capacitor dielectrics in the future dynamic random access memory.17 This is also the main research topic in this work, but with differently pro-cessed RuOx (0 ≤ x ≤ 2)
bottom layers, which were achieved from the reduction process of the RuO4 precursor mediated by H2 gas.18, 19 Therefore,
understanding the chemical environment and resulting activity of the oxygen atoms in the underlying RuOx layer is crucially
important in correctly understanding the ALD process of the TiO2 film on top, and in improving the resulting properties.
While the most accessible method of growing Ru (or RuOx)
films must be (reactive) sputtering,20 most of the highly scaled electronic devices require the conformal growth of these films, which obviously cannot be achieved through the sputtering technique. Therefore, the CVD and ALD of Ru and RuOx films
were extensively researched on in the past decades.21-24 As mentioned earlier, most of these CVD and ALD processes are based on the oxidative decomposition of the Ru MO precursors for CVD or on the repeated oxidation-reduction of the growing layers for ALD.
Recently, an alternative chemical route for the synthesis of the thin films of Ru and RuO2 was demonstrated based on the
thermal decomposition of RuO4, which is an inorganic Ru
precursor whose various physical parameters are quite similar to those of Al(CH3)3, except for the low thermal decomposition
temperature (~150 °C).18, 19 Such a low thermal decomposition temperature prohibited the ALD-type growth behaviour at Ts >
~150 °C. The deposition of Ru or RuO2 films, however, can be
well controlled in a self-saturating manner by the enhancement of the chemical adsorption of RuO4 on the H2-pulsed surface in
the pulsed CVD (p-CVD) process.18 The primary by-product of the thermal decomposition of RuO4 is RuO2, which can be
further reduced to metallic Ru with the help of H2 gas. When a
Ru seed is formed in the RuO2 layer, it catalyses the further
reduction of RuO2 to Ru, in addition to the enhancement of
RuO2 deposition by the Ru nuclei (or seed) via the RuO4 + Ru
→ 2RuO2 reaction route. There can be an intermediate phase,
however, RuOx (0 < x < 2), when the H2 reduction process is
appropriately controlled, but its thermal stability must be quite limited. It must be an interesting task, therefore, to examine the influence of this intermediate phase on the ALD of the TiO2
film as well as its own variation. It can also be anticipated that this intermediate phase may show rather complicated in-situ reactions with the oxygen source in TiO2 ALD, which was O3
in this work, making the accurate understanding of the reaction kinetics even more challenging.
In this work, therefore, the three different phases of Ru, RuOx (x: ~1.12), and RuO2 were grown by carefully controlling
the H2(5%)/N2(95%) reduction gas pulse time during the
p-CVD using RuO4 as the Ru precursor at a 230 °C Ts. The
influence of these phases on the sub-sequent ALD process of TiO2 was carefully studied to reveal the role of the active
“solid” oxygen contained by the underlying RuOx layer.
II. EXPERIMENTAL PROCEDURE
RuO2 films were deposited via p-CVD using a RuO4 precursor
dissolved in a blend of organic solvents containing fluorinated solvents (ToRuS, total ruthenium solution, produced by Air Liquide Co., with a 0.8 M con-centration) and 95% N2/5% H2
mixed gas (N2/H2) as the Ru precursor and reactant gas,
respectively. The deposition temperature was 230 °C, and the p-CVD sequence consisted of four steps: Ru precursor injection (0.5 s) − Ar purge (7 s) − N2/H2 gas injection (1-10 s) − Ar
purge (5 s). The N2/H2 reactant exposure time was controlled to
produce the desirable oxygen composition of Ru films. The Ru solution was cooled down to 3 °C to achieve an appropriate vapour pressure, and no carrier gas was used to introduce the precursor molecules into the p-CVD chamber. A more detailed description of the deposition procedure of Ru and RuO2 films
using RuO4 was reported elsewhere.18, 19 The flow rate of the
N2/H2 gas was fixed to 100 sccm. 5 nm Ta2O5 deposited on Si
wafer via CVD was used as the substrate for Ru, RuOx, and
RuO2 film growth. The ALD TiO2 films were deposited using
TTIP and O3 (250 g/m3) as the Ti precursor and oxygen source,
respectively, and the sequence consisted of the TTIP feeding (3 s) – Ar purge (5 s) – O3 feeding (3 s) – Ar purge (5 s) steps at
the growth temperature of 250 °C. Ru, RuOx and RuO2 films
were deposited immediately prior to the TiO2 ALD. There must
be some additional oxygen adsorbed on the film surface, but this must be much less significant compared with the inherently included oxygen concentration in the film. Therefore, it must be safe to ignore the surface contamination effect. The modified TiO2 ALD sequences were also conducted, such as the
TTIP-only sequence, which consisted of TTIP feeding (3 s) – Ar purge (5 s) – Ar purge (3 s, instead of O3) – Ar purge (5 s), or
the O3 pretreatment sequence, which consisted of several cycles
of O3 feeding (3 s) – Ar purge (13 s) before normal TiO2 ALD.
The modified sequences were designed to ensure the same process conditions, such as the process time, thermal budget, and chamber pressure, as that of the normal TiO2 ALD.
The film thickness of both the Ru and TiO2 films were
determined through calculation from the layer density, which was measured via X-ray fluorescence spectroscopy (XRF, Thermoscientific, ARL Quant’X), and the film density via X-ray reflectivity (XRR, PANalytical, X’pert Pro.). XRR was used to estimate the film thickness too for several cases. XRF cannot detect oxygen so that the estimated layer density of Ru or Ti was used to check the amount of the deposited RuO2 or
TiO2 film, respectively. The chemical properties of the RuOx
films were checked via X-ray photoelectron spectroscopy
Journal
of
Materials
Chemistry
C
Accepted
Manuscript
(XPS, VG, Sigma Probe). The depth profiles of the films were analysed via time-of-flight medium energy ion scattering spectroscopy (ToF-MEIS, K-MAC, MEIS-K120) using a He-ion beam with an acceleratHe-ion energy of 100 keV. Glancing angle incident X-ray diffraction (GAXRD, PANalytical, X’pert Pro., incidence angle of 0.5°) was used to examine the crystallographic structure of the deposited films. The surface morphology and roughness were observed via atomic force microscopy (AFM, JEOL, JSPM 5300).
III. RESULTS AND DISCUSSION
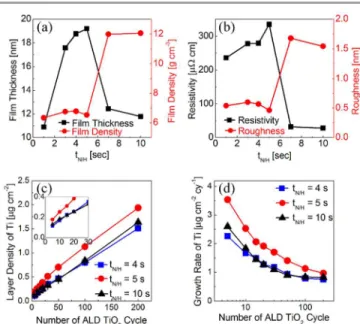
Figure 1 shows the variations in the (a) film thickness and bulk density (both evaluated from XRR) and (b) resistivity (sheet resistance measured via four-point probe and film thickness) and surface roughness (via XRR) of the deposited RuOx (0 ≤ x
≤ 2) film properties as a function of the N2/H2 reactant feeding
time (tN/H), which was varied from 1 to 10 sec. Here, the
p-CVD cycle was repeated 90 times for all the cases. When the tN/H was as short as 1 sec, the film thickness was very low,
suggesting that the film deposition was inefficient under this condition. When the tN/H increased to 5 sec, the film thickness
largely increased, which can be understood from the enhanced efficiency for decomposing RuO4 to RuO2 with the help of the
H2 gas adsorbed on the growing film surface.25 When the tN/H
increased to over 7 sec, the film thickness decreased drastically. This does not mean, however, that the p-CVD reaction is retarded under this condition; this is due to the largely increased film density, as can be understood from the red-coloured data points in the same figure. Such a variation in the film density and thickness can be well correlated with the variations in the film resistivity shown in Fig. 1(b), where the resistivity was quite high and low when the density was low (the thickness was high) and high (the thickness was low), respectively. These variations are consistent with those in the previous report,18 which indicates that the films with a low tN/H (<5 sec) were
RuO2 whereas the films with a high tN/H (>5 sec) were Ru,
although the transition tN/H value (~6 sec) was slightly different
from that in the previous report (~11 sec). Such difference can be ascribed to the different RuO4 concentration in the ToRuS
solution (0.8 M in the present work vs. 1.6 M in the previous work). The different phases of the grown films for the two distinctive tN/H regions (RuO2 vs. Ru) can also be confirmed in
this work (the data in Fig. 2 and the related discussions). The largely increased roughness of the Ru films for tN/H >5 sec can
be ascribed to the highly enhanced incorporation speed of the Ru metal atoms from the autocatalytic effect of the Ru clusters for the reduction reaction of RuO2 to Ru. These observations
are quite similar to those in the previous report.18 In order to
check the phases of TiO2 film on the three types of substrate,
the dielectric constants of the dielectric films, which were grown by a common cycle number of 200, were estimated. They were 104.1, 103.4, and 102.2 for the t4, t5, and t10 samples respectively. For this electrical test, the Pt top electrode (~0.3 mm in diameter) was deposited by a DC sputtering method through metal shadow mask. XRD was not successful to distinguish the phases because the TiO2 film
thicknesses were too thin (< 8 – 9 nm) to show evident diffraction peaks.
A peculiar finding could be made, however, from the high resistivity of the film at tN/H = 5 sec, whose resistivity was as
high as 334 Ω•cm whereas those of the films with the RuO2 and
Ru phases were 230-280 and 25-30 Ω•cm, respectively. This
strongly suggests that something uncommon occurred at the condition of tN/H = 5 sec. Moreover, the ALD TiO2 film on
these films were also exhibited extraordinary growth behaviour. Figure 1(c) shows the variations in the Ti layer density as a function of the number of TiO2 ALD cycles (ncy) for the three
different substrates with tN/H = 4, 5, and 10 sec (the samples
named “t4,” “t5,” and “t10”), respectively, and Fig. 1(d) shows the growth rate of the Ti layer density as a function of ncy,
which could be acquired by differentiating the data in Fig. 1(c). There was hardly any incubation cycle (ncy, where TiO2 did not
grow during the initial ALD stage), suggesting the good nucleation property of TiO2 films on these substrates. Figure
1(d) clearly revealed that the substrates generally enhanced the TiO2 film deposition, where the enhancement was retained up
to 40-50 cycles for samples t4 and t10, whereas the effect was retained up to 100 cycles for the case of sample t5. The
Figure 1. (a) Variations of film thickness and its density, and (b) resistivity and roughness values of deposited RuOx (0 ≤ x ≤ 2) as a function of N2/H2 reactant
feeding time. The comparison of (c) layer density and (d) differentiating growth rate of TiO2 films as a function of deposition cycles deposited on samples of t4,
t5, and t10.
enhancement of TiO2 growth in the low-ncy region on the RuO2
and Ru electrodes has been reported elsewhere, which has been understood from the CVD-like reaction of Ti(O-iPr)2(tmhd)211
or TTIP26 molecules on the RuO
2 surface when the precursor
molecules were pulsed. In the genuine ALD reaction route, there should be no oxide formation at this step; only the chemical adsorption of the precursor molecules, whose degree is largely determined by the steric hindrance effect and surface density of the chemisorption sites. When the substrate provided the adsorbing molecules with active oxygen atoms, however, the oxide layer was formed even at the precursor pulse step, which resulted in an enhanced growth rate. This type of CVD-like reaction must be retarded as the substrate surface came to be covered with the growing film because the chemical inter-action between the RuO2 substrate and the TTIP molecules was
interfered with by the growing film.
Nevertheless, the interaction could be maintained up to a certain TiO2 film thickness because the oxygen dissociated
from O3 during the O3 pulse step could be diffused into the
underlying RuO2 layer through the grown TiO2 layer, which
Journal
of
Materials
Chemistry
C
Accepted
Manuscript
ARTICLE Journal Name
could be diffused back to the film surface and could react with the TTIP molecules during the subsequent TTIP pulse step.13 An identical mechanism could be used to explain the growth enhancement on Ru given the fact that Ru can be oxidized to RuOx (or even RuO2) during the O3 pulse step.
The much higher enhancement of TiO2 film growth on
sample t5, which was preserved up to the ncy of 100, manifested
that there is another factor that further enhances the TiO2
growth rate. To confirm such peculiarity, the physical and chemical properties of t4, t5, and t10 were examined in detail. The chemical structures of the films were evaluated using XPS analysis. Figures 2(a)-(c) show the Ru 3d XPS spectra (data points) of t4, t5, and t10, respectively. Also shown in the same figures are the deconvoluted spectra (lines) assuming the Ru 3d peaks were composed of Ru 3d5/2 peaks centred at the 280.0,
280.8, and 281.8 eV binding energies (BE), which correspond to metallic Ru, RuO2, and RuO3, respectively. For the t4
sample,
Figure 2. Peak fits of (a)-(c) Ru3d spectra and (d)-(f) O1s spectra of t4, t5, and t10 on as-deposited films. In Ru3d spectra, deconvoluted carbon peak is indicated as black colour, and left-side peaks are originated from 3d3/2. Peak deconvolution
was conducted with 3d5/2 spectra (right-side peaks).
the Ru 3d peak was mainly composed of the peak with a 280.8 eV BE and a minor contribution from the peak with a 281.8 eV BE, suggesting that the film was mainly RuO2. RuO3 might
have been present on the film surface due to the dissociative adsorption of O2 or H2O.
27
The peak located about 282.5 eV denoted the extended RuO2 composition, which was called as
RuO2 satellite. 10
In contrast, the main contribution to the Ru 3d XPS peak was made from the peak with a 280.0 eV BE for the t10 case, suggesting that the film was mainly Ru. The minor peaks located at 280.8 and 281.8 eV could also have been from the surface-oxidized layer. Sample t5 shows the intermediate composition of the Ru 3d peak, as expected, where the peaks with 280.0 and 280.8 eV BEs had relatively similar contributions to the total intensity. This reveals that the t5 sample was composed of a mixture of RuO2 and Ru. Such
identification of the films was further confirmed by the O 1s XPS spectra shown in Figures 2(d)-(f) for the same samples. The O 1s spectra were also deconvoluted assuming the presence of peaks located at the 529.5, 530.7, and ~532 eV BEs, which correspond to the oxygen in the bulk RuO2, the
surface adsorbed or subsurface oxygen (Oads,sub), and surface
contamination, such as water or hydrocarbons, respectively. The presence of Oads,sub has been reported experimentally10,28-30
and theoretically9, 31 which coincide with the oxygen atoms without forming strong chemical bonds with Ru, as in RuO2.
Considering the reaction kinetics of RuO2 and Ru film
formation through the reductive routes in this work (RuO4→
RuO2 + O2, RuO2→ Ru + O2, and RuO4 + Ru → 2RuO2), it is
not extraordinary to consider the involvement of the RuOx
phase, where x is <2, in the middle of the CVD reaction. The O 1s spectrum of sample t4 showed a strong and sharp peak at 529.5 eV BE, suggesting that the film is mainly well-crystallized RuO2. The t10 sample showed a much weaker O 1s
peak intensity, which coincides with the fact that t10 was mainly of the Ru phase. The deconvoluted O 1s spectrum clearly revealed that there was an evident peak at 530.7 eV BE with strong intensity, suggesting that the sufficient amount of Oads,sub was clearly present in this sample. The deconvoluted
peaks of O 1s spectrum of sample t5 (Fig. 2(e)) evidently showed simultaneous involvements of the Ru and RuO2 phases.
The coexistence of RuO2 and Ru with Oads,sub atoms has an
important implication on the ALD of the TiO2 film on top, as
will be shown later; the RuO2 phase decomposed to Ru and
oxygen, which provided the incoming TTIP molecules with active oxygen atoms even before the O3 pulse was made.
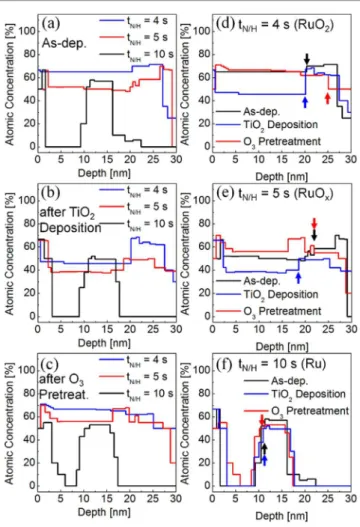
Figure 3(a) shows the ToF-MEIS depth profiles for oxygen of the three films at the as-deposited states. The high oxygen concentration at depth 10 – 15 nm of sample t10 corresponds to the Ta2O5 substrate layer, which was observed at depth 20 – 25
nm for the other two cases. These results corroborate the fact that the thickness of the Ru film in sample t10 is much lower than those of the other two (Fig. 1(a)). As expected, sample t4 had the highest oxygen concentration, and sample t10 almost negligible oxygen concentration, except for its surface, due to the contamination and surface adsorbed oxygen. Sample t5 had an intermediate oxygen concentration, which was closer to that of t4 than t10. The O/Ru ratio of sample t5, estimated from the oxygen concentration in the middle of the layer, was ~1.12 which suggests that the RuO2 : Ru phase ratio was obtained as
0.56 : 0.44, assuming the stoichiometric RuO2 and negligible
oxygen concentration in the Ru phase. To understand what occurred in the chemical states of these films during the ALD steps, the following experiments were performed on these three samples, and the oxygen depth profiles were again examined. First, the five cycles of TiO2 ALD (the TTIP and O3 pulses)
were performed, and the oxygen profiles are shown in figure
Journal
of
Materials
Chemistry
C
Accepted
Manuscript
3(b). The high oxygen concentration of the film surface can be ascribed to the presence of a very thin TiO2 layer (with a 0.15
nm nominal thickness, estimated from the saturated ALD rate of TiO2 ~0.03 nm/cycle). While the bulk of the Ru layer in t10
remained almost oxygen-free (black line), the oxygen concentration of both samples t4 and t5 decreased significantly after only five cycles of TiO2 ALD. The decrease was the most
significant for the case of t5 (Fig. 3(e)), suggesting that the oxygen in sample t5 was the most vulnerable to the removal probably by the reaction with TTIP. Figure 3(c) shows the oxygen signal depth profiles of the three samples after the O3
pretreatments (no TTIP pulse). Sample t10 showed a high oxygen signal on the surface, and the bulk region showed only a marginally increased concentration. This suggests that sample t10 had a relatively high resistance to infiltration of oxygen, which can be ascribed to the high crystalline quality of the Ru film in this sample. Samples t4 and t5 showed quite notable changes after the O3 pretreatments; the oxygen concentration of
sample t5 (Fig. 3(e)) was increased both bulk region and
Figure 3. Depth profile of oxygen atom, where (a) as-deposited, (b) after five cycles of TiO2 ALD and (c) after the O3 pretreatment, and oxygen profile change
in (d) t4, (e) t5 and (f) t10 by subsequent process, analysed by time-of-fight medium energy ion scattering spectroscopy. Coloured arrows in (d)-(f) indicate the interface between RuO2 (or Ru) on left-side and Ta2O5 layer on right-side.
interface, while the sample t4 (Fig. 3(d)) exhibited no significant change. The slight increase in oxygen signal of t5 can be ascribed to the further oxidation of the Ru phase to RuO2. The large variation in the oxygen concentration after the
ALD of TiO2 (shown in Fig. 3(b)) appeared to have a close
relationship with the phase evolution of t4, t5, and t10 during the ALD, and the variations in the initial ALD speed. Figure 3(f) showed that the oxygen behaviour in sample t10 was not deviated from the usual expectation; bulk of Ru layer remained almost oxygen-free and only surface contained oxygen atoms. The chemical composition of Ru, RuOx and RuO2 layer after
the deposition of TiO2 films by 10 cycles was also checked by
XPS. The results were identical to the MEIS results of Fig. 3 (data not shown).
Figure 4 shows the GAXRD spectra of samples t4, t5, and t10 before and after the 10 cycles of TiO2 ALD. All the
as-deposited films were crystallized without any post-deposition annealing. The diffraction peaks from the as-deposited sample t4 indicated that the thin film had crystalline RuO2 with a rutile
structure [(110) at 2θ ~ 27.9° and (111) at 40.6°]. Metallic Ru peaks were detected at 2θ ~ 38.8° for (100), 42.5° for (002), and 44.4° for (101) from sample t10. No significant change in the diffraction pattern was observed even after the deposition of 10 ALD cycles of TiO2 in both samples t4 and t10. The
nominal thickness of the TiO2 layer was only 0.3 nm, and as
such, the TiO2 layer could not show any diffraction peak from
this GAXRD setup but can just slightly mask the underlying layers from the incident X-ray. In contrast to samples t4 and t10,
Figure 4. Glancing angle incident X-ray diffraction spectra of t4, t5, and t10 substrates, and after 10 cycles of TiO2 deposition on each substrates.
Table I. GAXRD peak positions (2θ) of the three samples at the as-deposited state and after the 10 cycles of TiO2 ALD.
Samples RuO2 (110) Ru (100) RuO2 (111) Ru (002) Ru (101) 10 s 38.75 42.48 44.32 10 s + TiO2 10cy 38.71 42.48 44.40 5 s 27.94 40.56 42.16 44.13 5 s + TiO2 10cy 27.94 38.35 42.29 44.09 4 s 27.85 40.59 4 s + TiO2 10cy 27.83 40.57
Journal
of
Materials
Chemistry
C
Accepted
Manuscript
ARTICLE Journal Name
sample t5 showed diffraction peaks at 2θ ~ 27.9 and 40.6°, which corresponded to RuO2, as well as peaks at 2θ ~ 42.2 and
44.1°, which corresponded to Ru, at the as-deposited state, although the Ru peaks were much weaker than that of sample t10. This phase composition corroborates the above XPS results. Despite the low peak intensities, the positions of each peak can be determined by fitting the spectra with the Gaussian function. The estimated peak positions are summarized in Table I. It can be understood that in addition to the coexistence of RuO2 and Ru in sample t5, the peak positions of the Ru phase
are certainly shifted into the lower 2θ direction by 0.2-0.3° compared with t10, whereas that of the RuO2 peak showed a
smaller shift into the higher 2θ direction by ~0.1° compared with sample t4. This suggests that the Ru phase in sample t5 had an increased lattice parameter, probably due to the remaining oxygen in the metallic Ru lattice, while the RuO2 in
sample t5 had a slightly decreased lattice parameter, but it was less obvious compared with that of Ru. In this regard, it is supposed to be that the Ru phase in sample t5 had the high concentration of Oads,sub. Another notable finding could be
obtained from the GAXRD spectrum of sample t5 after the 10 ALD cycles of TiO2; the RuO2 peak disappeared almost
completely while the Ru peaks quite notably increased in intensity, with their shifted peak positions maintained. This suggests that the catalytic decomposition of RuO2 to Ru with
the help of the presence of Ru occurred during the ALD of TiO2
on top in this case, as discussed in ToF-MEIS analysis.
The results shown in figures 2-4 well corroborate the previously reported mechanisms for the RuO2 and Ru film
deposition using the RuO4 and N2/H2 gas as the Ru precursor
and reduction agent.18 RuO4 could be thermally decomposed at
this temperature (230 °C) toform RuO2, but the addition of H2
gas enhances the chemical adsorption of RuO4 on the H2
-adsorbed RuO2 film surface, increasing the RuO2 growth rate.
During the long tN/H, the deposited RuO2 decomposed to Ru
while the oxygen atoms were removed by the reaction with H2.
There was a catalytic activity of Ru that further enhanced the RuO2 reduction when the Ru nuclei were formed. This resulted
in the abrupt phase transition of the depositing film from RuO2
to Ru at a certain critical tN/H (~6 sec in this case, and ~11 sec in
Ref. 18) When the deposited film became Ru (due to the sufficiently long tN/H), the deposition of the film during the
subsequent RuO4 pulse step was further enhanced by the
reaction RuO4 + Ru → 2RuO2, and the resulting RuO2 was
reduced to Ru during the subsequent N2/H2 pulse step. The
added knowledge in this work was the revelation of the intermediate step of the transition from RuO2 to Ru (sample t5).
The 5 sec tN/H appeared to be just enough time to induce the
reduction of RuO2 to Ru but not long enough to induce the full
transformation to Ru. Therefore, the microstructure must be a physical mixture of RuO2 and Ru (with non-negligible amount
of Oads,sub), which induced the abnormally high resistivity in
this case (Fig. 1 (b)) due to the boundary scattering of electrons between the two phases. The drastic decrease in the RuO2 phase
XRD peak and the increase in the Ru phase XRD peak shown in figure 4 after the 10 ALD cycles of TiO2 for the case of
sample t5 manifested what could be the more detailed mechanism for the reduction of RuO2 with the help of Ru.
When pure RuO2 was thermally treated under the N2/H2
atmosphere for a short time (tN/H <4 sec), which was not
sufficiently long to induce Ru nuclei formation, N2/H2 did not
seem to play any crucial role in the reduction. It just increased the RuO4 chemisorption perhaps through the reaction 4H
(surface) + RuO4→ RuO2 + 2H2O (desorption). Once the Ru
nuclei started to form with the increase in tN/H (>5 sec),
however, they could take the oxygen from the nearby RuO2
grains, and the acquired oxygen atoms in the Ru grains (Oads,sub)
could leave the film rapidly because Oads,sub was unstable. The
direct extraction of oxygen atoms from RuO2 by thermal energy
(or even with the help of H2 gas) at 200-250 °C appears quite
unlikely due to the phase stability of RuO2. The GAXRD data
shown in figure 4 for sample t4 reveal this point. When TTIP was pulsed on the film surface, it could take oxygen from the underlying layer if the binding energy between the oxygen and Ru was weaker than the Ti-O bond or even C-O (and other possible reactions between the ligands and oxygen). The Ti-O bond is much stronger than the Ru-O bond at the ALD temperature, and as such, in principle, RuO2 reduction could
occur during the TiO2 ALD, which was indeed observed when
the ALD temperature was 370 °C.11 The temperature of TiO2
ALD is the critical factor that influences the growth behaviors on the different types of substrate layer. At 370 oC, the catalytic decomposition of RuO2 during the TiO2 ALD was highly
activated by the thermal energy,11 so that the TiO2 film growth
rate on RuO2, which is the substrate layer with the highest
oxygen content among the three types of Ru-O films, showed the highest growth rate. However, at a much lower ALD TiO2
temperature of 250 oC, the thermal decomposition effect of the stable RuO2 was much less severe, so that the inherently
chemical activity of subsurface oxygen atoms in the RuOx
showed the highest chemical activity. At such a relatively low ALD temperature of 250 °C in this work, however, this reaction seemed to be kinetically limited, and as such, a substantial fraction of RuO2 remained after the TiO2 ALD for the case of
sample t4. The identical growth behaviour on sample t4 and t10 can be explained as follows. Sample t10 had a negligible amount of oxygen in the bulk of the film, so it had no reason to show such an effect during the ALD of TiO2 on top of it.
However, thin RuO2 could be grown on the Ru surface by its
exposure to O3-containing environment. 14
Only a few layers of RuO2, which derived the formation of rutile-structure TiO2 on
the Ru electrode when O3 was adopted as the oxygen source,
can contribute the over-growth of TiO2. Therefore, the t10
exhibited almost identical growth behaviour to sample t4. The availability of a catalytic reduction route for the case of sample t5 via the transfer of oxygen from RuO2 to Ru, however, greatly
facilitated the reduction of RuO2. When the TTIP was pulsed,
the reaction by-product of the reduction reaction (RuO2→ Ru +
O2), O atoms or O2 molecules, could be easily taken up by the
TTIP, which would further enhance the reduction reaction. As a result, the RuO2 phase seemed to be completely disintegrated
even after only 10 ALD cycles on top (Fig. 4). However, the enhanced growth rate was maintained almost 100 cycles of TiO2 deposition. As aforementioned, the adsorbed TTIP
molecules were oxidized by the oxygen atoms provided by the catalytic decomposition of RuO2 due to the coexistence of Ru
in the substrate layer in case of sample t5, which is suggested by the data shown in figures 3 and 4. It is also possible that the reduced Ru could be oxidized back to RuO2 during the O3 pulse
time, but the incorporated oxygen atoms would be diffused outward again to the film surface during the subsequent step. Actually, even after conducting 100 cycles of TiO2 ALD,
oxygen concentration of RuOx was ~33 at.% (Fig. 5), which
was comparable to that after five cycles of TiO2 ALD (Fig.
3(e)).
Journal
of
Materials
Chemistry
C
Accepted
Manuscript
Figure 5. Depth profile of RuOx (tN/H = 5 sec) film after conducting 100 cycles of
TiO2 ALD.
In contrast, sample t4 showed only a marginal increase in growth rate, which was almost comparable to that of sample t10, and the Ru and RuO2 phase remained intact after the TiO2
ALD. These factors revealed that RuO2 was not decomposed to
Ru under these ALD conditions, which can be ascribed to the structural stability of RuO2. It could be easily anticipated that
such a drastically different evolution of oxygen from the substrate layer during the ALD of TiO2 would result in different
ALD behaviours for the given TiO2 ALD conditions, which
was indeed the case, as shown in figures 1(c)-(d).
The interaction between O3 and the three samples was further
examined in the following manner: the three samples were treated under the O3 pulse sequence, which was identical to the
TiO2 ALD process (without the TTIP pulse steps). Figure 6(a)
shows the variation in the Ru layer density as a function of the O3 pulse number for the three samples. While the Ru layer
density decreased only marginally (<11%) for the case of sample t4, even after 7 cycles of O3 treatment, the Ru layer
density of sample t10 decreased by almost 97%. It has been reported that the Ru etching by O3 proceeded via the reaction
RuO* + O3 → RuO4, 32
where RuO* coincided with the Ru atoms with the nearby O atoms existing as the forms adsorbed on the surface or subsurface region, which has been represented by Oads,sub in this work. When the film had a stable form of
RuO2, the reactivity of this layer towards the reaction with O3
must have been quite limited, and no significant etching was observed.32, 33 The GAXRD data shown in figure 6(b) before and after the five O3 pulse cycles revealed that there was also
no major change in the phase composition. In contrast, as confirmed by the XPS spectra in figure 2, the Ru film surface (sample t10) had Oads,sub, which could be preserved even after
the O3 pulse step, so that the etching must be quite active. The
GAXRD data shown in figure 6(d) also revealed that there was no major change in the phase composition in this case. It is interesting to note that these etching and GAXRD data indicate that the RuO2 layer was not majorly formed during the O3 pulse
step. It can be imagined that the formation of RuO2, which can
be induced by the reaction between the Ru and O radicals
Figure 6. (a) Comparison of variations of Ru layer density of sample t4, t5, and
t10 as a function of conducted cycle number of O3 pretreatment. Glancing angle
incident X-ray diffraction patterns of (b) t4, (c) t5, and (d) t10 before and after five cycles of O3 pretreatment.
dissociated from O3, is in competition with the formation of
RuO4 by the aforementioned reaction. In addition, the
formation of a RuO2 layer requires the substantial
rearrangement of the Ru atoms from the metal Ru structure (hexagonal close packing) to the rutile RuO2 structure
(tetragonal), which must be kinetically limited by the relatively low temperature (250 °C). When the Ru film surface was directly exposed to O3 gas, the volatilization reaction by RuO4
formation must have been dominant.30 When the TTIP precursors were also pulsed, however, to grow ALD TiO2 films
on the Ru electrode, the desorption of RuO4 must have been
suppressed by the presence of a thin TiO2 layer on top of the Ru
surface, whereas the dissociation of O3 to O2 and O radical on
the TiO2 surface could be enhanced. 14
The produced O radicals could be readily diffused to the underlying Ru layer and could have formed an interfacial RuO2 layer, which is the driving
force for transforming the structure of the TiO2 clusters from
either amorphous or anatase (which must be the first formed phase considering the low ALD temperature and thermodynamic condition) to a rutile structure. The formation of rutile-structure TiO2 on the Ru electrode when O3 was
adopted as the oxygen source has been repeatedly reported.12, 14, 15, 26, 34, 35
The etching behaviour of sample t5 was in between those of samples t4 and t10. The general trend, however, follows that of sample t10, suggesting that the Ru phase in sample t5 was mainly etched. Figure 6(c) shows the GAXRD pattern of sample t5 before and after O3 etching. It will be noted that the
peaks related with the Ru phase almost disappeared while the peaks related with the RuO2 phase remained invariant after O3
Journal
of
Materials
Chemistry
C
Accepted
Manuscript
ARTICLE Journal Name
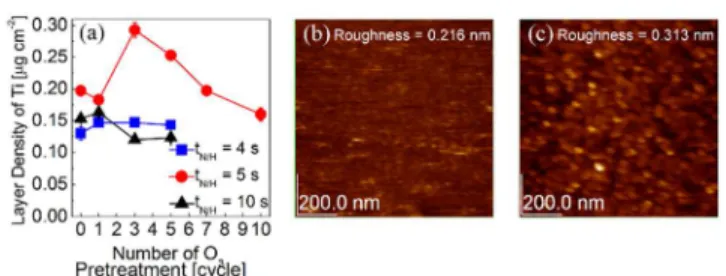
Figure 7. Comparison of deposited TiO2 layer density on t4, t5, and t10
substrates as a function of cycle number of O3 pretreatment. Atomic force
microscopy images of (b) before and (c) after three cycles of O3 pretreatment on
the sample of t5.
etching. This clearly indicates that the main etching part in sample t5 was Ru while the RuO2 phase remained unetched.
The effects of O3 pretreatment on the subsequent TiO2 ALD
were examined by depositing five ALD TiO2 cycles on the O3
-pretreated samples with different treatment cycles. Figure 7(a) shows the variations in the Ti layer density as a function of the O3 pretreatment number for the three samples. Sample t4 did
not show any notable variation in the Ti layer density up to the pretreatment cycle number of 5, except for a small increase after the first cycle, which can be attributed to the slightly increased oxygen concentration on the film surface. Sample t10 first showed an increase and then a decrease after three cycles. The first increase can be understood in the same manner as for sample t4, and the obvious decrease in Ti layer density after three cycles may be understood from the large removal of the Ru material itself after these treatments. The less the Ru that is left with the increasing O3 pretreatment cycle number, the less
oxygen could be stuffed in the remaining Ru layer, and thus, the less enhancement in TiO2 ALD. Sample t5 showed a rather
complicated behaviour; up to three O3 pretreatment cycles, the
Ti layer density largely increased, but it finally decreased to the value of sample t4 after 10 O3 pre-treatment cycles. The first
large increase may be understood from the increased surface area as the Ru phase was etched away by the O3 pretreatment
cycles. Figures 7(b) and (c) show the AFM topographic images of the as-deposited sample t5 and after three O3 pretreatment
cycles, respectively. It can be understood that the structural change on the RuOx film surface was made by the O3
pretreatment cycles. On this surface, there was a remaining Ru phase, which was a very active source of oxygen to the incoming TTIP molecules. The fact that the Ru phase has elongated lattice and the Oads,sub in its lattice may also enhance
transformation of Ru to RuO2, 29, 30
and this RuO2 could be
contributed to oxidation of TTIP molecules by reduction reaction (RuO2 → Ru + O2). This is because the TiO2
overgrowth was retained up to 100 cycles for the case of sample t5. As the Ru phases etched away, the surface became more like RuO2, and the TiO2 growth rate converged to that on
RuO2 (sample t4).
IV. CONCLUSIONS
The chemical states of RuO2 and Ru films as the bottom
electrode for the high-dielectric-rutile TiO2 thin film, which
were deposited via pulsed chemical vapour deposition (p-CVD) based on the reduction reaction of RuO4 induced by the N2/H2
gas mixture, were examined in detail. When the tN/H was shorter
than 4 sec and longer than 6 sec, the deposited films were almost single-phase RuO2 and Ru, respectively. The film grown
at 5 sec tN/H, however, was identified to have had a mixture of
the RuO2 and Ru phases, where this Ru was the metallic Ru
phase with an elongated lattice parameter due to the incorporation of subsurface oxygen atoms. The coexistence of the two phases in a single film drastically increased the chemical activity of oxygen in the film, largely increasing the ALD speed of TiO2 on top up to 100 ALD cycles. This was
understood as the catalytic decomposition of RuO2 into Ru and
oxygen atoms with the help of the Ru phase. The RuO2 film
had a high immunity to the chemical etching activity of O3 due
to its structural stability while the Ru film showed the lowest immunity to O3 etching. This may be due to the much faster
reaction kinetics for the reaction RuO* + O3→ RuO4 compared
with that of the oxidation speed of Ru by the oxygen radical decomposed from O3. Therefore, it was identified that the
in-situ formation of a thin RuO2 layer underneath the growing
TiO2, which drove the transformation of the TiO2 phase from
anatase to rutile and is highly desirable for a high dielectric constant, was due to the suppression of direct contact between Ru and O3 by the intervening TiO2. The oxygen radical formed
on the TiO2 surface could diffuse onto the Ru surface beneath
the TiO2, and could form RuO.
Acknowledgements
The authors appreciate K-MAC MEIS development team for ToF-MEIS analysis and valuable discussion. This study was supported by the Future Semiconductor Device Technology Development Program (10047231) funded by the Ministry of Trade, Industry & Energy of Korea (MOTIE) and the Korea Semiconductor Research Consortium, and Nano-Convergence Foundation funded by the Ministry of Science, ICT and Future Planning (MSIP, Korea) & MOTIE, Korea [Project Name: Development of mass production technology for DRAM capacitor].
Notes and references
a Department of Materials Science and Engineering and Inter-university
Semiconductor Research Center, Seoul National University, Seoul 151-742, Republic of Korea
*E-mail : [email protected]
b Advanced Materials Division, Korea Research Institute of Chemical
Technology, Daejeon 305-600, Republic of Korea
c Electronic Materials Research Center, Korea Institute of Science and
Technology, Seoul 136-791, Republic of Korea
1. S. M. George, Chem. Rev. (Washington, DC, U. S.), 2009, 110, 111-131.
2. S. M. George, A. W. Ott and J. W. Klaus, J. Phys. Chem., 1996,
100, 13121-13131.
3. M. Leskelä and M. Ritala, Thin Solid Films, 2002, 409, 138-146. 4. R. L. Puurunen, J. Appl. Phys., 2005, 97, 121301.
5. T. Suntola, Thin Solid Films, 1992, 216, 84-89.
6. C. S. Hwang, in Atomic Layer Deposition of Nanostructured Materials, Wiley-VCH Verlag GmbH & Co. KGaA, 2011, pp. 159-192.
7. C. S. Hwang, Atomic Layer Deposition for Semiconductors, Springer US, New York, 2014.
8. M. Ahonen, M. Pessa and T. Suntola, Thin Solid Films, 1980, 65, 301-307.
9. M. Todorova, W. X. Li, M. V. Ganduglia-Pirovano, C. Stampfl, K. Reuter and M. Scheffler, Phys. Rev. Lett., 2002, 89, 096103.
Journal
of
Materials
Chemistry
C
Accepted
Manuscript
10. M. Tallarida, K. Kukli, M. Michling, M. Ritala, M. Leskelä and D. Schmeisser, Chem. Mater., 2011, 23, 3159-3168.
11. S. W. Lee, J. H. Han, S. K. Kim, S. Han, W. Lee and C. S. Hwang, Chem. Mater., 2011, 23, 976-983.
12. W. Lee, J. H. Han, W. Jeon, Y. W. Yoo, S. W. Lee, S. K. Kim, C.-H. Ko, C. Lansalot-Matras and C. S. Hwang, Chem. Mater., 2013, 25, 953-961.
13. S.-J. Won, S. Suh, S. W. Lee, G.-J. Choi, C. S. Hwang and H. J. Kim, Electrochem. Solid-State Lett., 2010, 13, G13-G16. 14. S. K. Kim, W. D. Kim, K. M. Kim, C. S. Hwang and J. Jeong,
Appl. Phys. Lett., 2004, 85, 4112-4114.
15. S. K. Kim, S. Han, G. H. Kim, J. H. Jang, J. H. Han and C. S. Hwang, J. Electrochem. Soc., 2011, 158, D477-D481.
16. K. Fröhlich, J. Aarik, M. Ťapajna, A. Rosová, A. Aidla, E. Dobročka and K. Hušková, Journal of Vacuum Science & Technology B, 2009, 27, 266-270.
17. S. K. Kim, S. W. Lee, J. H. Han, B. Lee, S. Han and C. S. Hwang,
Adv. Funct. Mater., 2010, 20, 2989-3003.
18. J. H. Han, S. W. Lee, S. K. Kim, S. Han, C. S. Hwang, C. Dussarrat and J. Gatineau, Chem. Mater., 2010, 22, 5700-5706. 19. J. H. Han, S. W. Lee, G.-J. Choi, S. Y. Lee, C. S. Hwang, C.
Dussarrat and J. Gatineau, Chem. Mater., 2008, 21, 207-209. 20. H. K. Kim, I. H. Yu, J. H. Lee, T. J. Park and C. S. Hwang, ACS
Appl. Mater. Interfaces, 2013, 5, 1327-1332.
21. T. Aaltonen, M. Ritala, K. Arstila, J. Keinonen and M. Leskelä,
Chem. Vap. Deposition, 2004, 10, 215-219.
22. S. Y. Kang, H. J. Lim, C. S. Hwang and H. J. Kim, J. Electrochem. Soc., 2002, 149, C317-C323.
23. S. K. Kim, S. Y. Lee, S. W. Lee, G. W. Hwang, C. S. Hwang, J. W. Lee and J. Jeong, J. Electrochem. Soc., 2007, 154, D95-D101. 24. T. Shibutami, K. Kawano, N. Oshima, S. Yokoyama and H.
Funakubo, Electrochem. Solid-State Lett., 2003, 6, C117-C119. 25. J. H. Han, S. W. Lee, S. K. Kim, S. Han, W. Lee and C. S.
Hwang, Chem. Mater., 2012, 24, 1407-1414.
26. M. Popovici, A. Delabie, C. Adelmann, J. Meersschaut, A. Franquet, M. Tallarida, J. van den Berg, O. Richard, J. Swerts, K. Tomida, M.-S. Kim, H. Tielens, H. Bender, T. Conard, M. Jurczak, S. Van Elshocht and D. Schmeisser, ECS J. Solid State Sci. Technol., 2013, 2, N23-N27.
27. B. Hudec, K. Hušeková, A. Rosová, J. Šoltýs, R. Rammula, A. Kasikov, T. Uustare, M. Mičušík, M. Omastová, J. Aarik and K. Fröhlich, J. Phys. D: Appl. Phys., 2013, 46, 385304.
28. A. Böttcher and H. Niehus, J. Chem. Phys., 1999, 110, 3186-3195.
29. R. Methaapanon, S. M. Geyer, S. Brennan and S. F. Bent, Chem. Mater., 2013, 25, 3458-3463.
30. R. Methaapanon, S. M. Geyer, H.-B.-R. Lee and S. F. Bent, J. Mater. Chem., 2012, 22, 25154-25160.
31. B. Chakraborty, S. Holloway and J. K. Nørskov, Surf. Sci., 1985,
152–153, Part 2, 660-683.
32. M. Nakahara, S. Tsunekawa, K. Watanabe, T. Arai, T. Yunogami and K. Kuroki, Journal of Vacuum Science & Technology B, 2001, 19, 2133-2136.
33. J. Swerts, M. M. Salimullah, M. Popovici, M.-S. Kim, M. A. Pawlak, A. Delabie, M. Schaekers, K. Tomida, B. Kaczer, K. Opsomer, C. Vrancken, I. Debusschere, L. Altimime, J. A. Kittl and S. Van Elshocht, ECS Trans., 2011, 41, 41-51.
34. J. H. Han, S. Han, W. Lee, S. W. Lee, S. K. Kim, J. Gatineau, C. Dussarrat and C. S. Hwang, Appl. Phys. Lett., 2011, 99, 022901. 35. S. K. Kim, G. J. Choi, S. Y. Lee, M. Seo, S. W. Lee, J. H. Han, H.
S. Ahn, S. Han and C. S. Hwang, Adv. Mater. (Weinheim, Ger.), 2008, 20, 1429-+.