ISSN: 2501 - 1235 ISSN-L: 2501 - 1235 Available on-line at: www.oapub.org/edu
doi: 10.5281/zenodo.3885875 Volume 6 │ Issue 5 │ 2020
THE RELATIONSHIP BETWEEN HEALTHY LIFESTYLE
BEHAVIORS AND QUALITY OF LIFE: AN ANALYSIS
ON UNIVERSITY STUDENTS WHO ARE ENGAGED
IN SPORTS AND WHO ARE NOT
Gökhan Çakir, Arslan Kalkavani Recep Tayyip Erdoğan Üniversitesi, Beden Eğitimi ve Spor Yüksekokulu, Rize, Turkey
Abstract:
Introduction and Purpose: Developing healthy lifestyle behaviors during university years is important in terms of supporting students’ health and well-being. Assessing the
students’ quality of life levels in this period may provide a source of reference for their subsequent years. The purpose of this study is to analyze the relationship between healthy lifestyle behaviors and quality of life of students studying at the university and to determine the effect of a number of variables, including but not limited to engaging in sports, on healthy lifestyle behaviors and quality of life. Method: The data analyzed in the study were collected through the “Personal Information Form”, “Healthy Lifestyle
Behaviors Scale-II and “Whoqol-Bref (TR) Quality of Life Scale”. The data pertaining to
851 students who filled the scale questionnaires completely were evaluated. The Healthy Lifestyle Behavior Scale, developed by Walker et al. (1987), and revised in 1996 was adapted to Turkish language in 2008, by Bahar et al., who also carried out the validity and reliability analysis of the scale. The scale consists of 52 items and 6 sub-factors. The rating of the scale is of 4-point likert type. The World Health Organization Quality of Life Scale Short Form (WHOQOL-BREF-TR) is a form developed by the World Health Organization. Validity and reliability tests of the scale were performed in 1999 by Eser et al. The scale allows analyzing the quality of life with reference to 4 distinct domains. The scores for individual domains can be in the 4-20 range. Firstly, the normality test was applied, and descriptive statistics were assessed for the data obtained from the scale. The data was found to exhibit normal distribution. In addition, according to the results of the Levene test, the variances were found to be homogeneous. Independent sample T-test, One Way Variance Analysis (Anova), Manova analysis and Pearson correlation analysis were used for the analysis of the data. Scheffe test, which is the 2nd Level Post Hoc Test,
was employed to determine the groups among which significant variation occurred. Data
were tested at α = 0.05 significance level.Findings and Conclusion: The study's findings
showed that the students’ healthy lifestyles and quality of life levels were moderately
correlated. Healthy lifestyle behaviors and quality-of-life levels of licensed sports students were significantly more emphasized than those of the students who did not engage in sports. The mean scores the students studying in Physical Education and Sports High School had for the physical activity and diet sub-factors were found to be significantly higher compared to those studying in other departments. Moreover, it was
seen that having breakfast regularly affects the students’ quality of life. As a conclusion, it can be said that the healthy lifestyle behaviors of university students are moderately correlated to their quality of life and regular sports have an impact on the variables analyzed in the present study.
Keywords: healthy lifestyle behaviors, sports, quality of life
1. Introduction
The university years stand out as an important period in any student’s life. The personal
experiences one has during those years can lead to substantial changes in lifestyle and social relationships. They are no less important in terms of shaping the careers of the students, as well as the subsequent stages of their lives. Developing healthy lifestyle behaviors during university years is crucial in terms of supporting the health and welfare of the students (McIsaac et al., 2015). The school also functions as the location where many physical exercises take place, for it is the place the young individuals spend a large portion of their days there.
Healthy lifestyle refers to the individual maintaining control over all behaviors which can have an effect on her health, and regulating her daily activities by opting for
behaviors which are in tune with the individual’s actual health picture (Ocakçı, 2007). An
individual who develops a robust attitude out of such behavior can maintain and improve her good health. Health behaviors include all acts and actions the individuals believe in and apply in her endeavor to stay healthy and keep medical problems away
(Zaybak and Fadıloğlu, 2004).
has substantial hidden costs associated with increased medical care expenses and lost productivity (https://www.who.int/news-room/fact-sheets/detail/physical-activity).
In a study with Physical Training and Sports School students, Bozkuş et al. (2013)
found that healthy lifestyle behavior plays a major part in determining the level of physical activity. Thus, one can forcefully argue that the introduction of healthy lifestyle behaviors is as crucial as physical activity itself. Furthermore, physical activity also helps improve the psychological state of human beings. That is why it is imperative to investigate health-related behaviors in order to explain the existing state of affairs
affecting the society. Therefore, developing and embracing healthy lifestyles during one’s
teens and twenties should be among the priorities of any individual (Mäkelä et al. 2017). Yet, the present study based on the argument that a healthier life can be enjoyed as the individuals embrace healthy lifestyle behaviors, focuses on a further dependent variable as well: quality of life. The quality of life refers to the perspective through which the individual perceives her goals, expectations, concerns, and overall standing in life, with reference to cultural values (Alexandre, Cordeiro and Ramos, 2009; Spilker, 1996; Testa and Simonson, 1996). Yet another definition of the quality of life states that it is an all-encompassing indicator of the personal reactions to medical conditions affecting personal satisfaction levels to be achieved in a given setting, as well as the daily physical, physiological, and social effects thereof. It covers culture, value judgments, the status of the individual, and her goals (Güler, 2006). There are a wide range of variables affecting
the individual’s quality of life. These include personal characteristics, social variables,
economic variables, psychological variables, health-related variables, and environmental
variables (Keskinoğlu, 2010). The present study focuses rather on the question whether
sports has an effect on the quality of life or not. Vergili (2012) supports the argument that regular exercise leads to significant improvement of not only physical fitness parameters, but also on the quality of life front.
Numerous studies showed the contributions of sports to physical and mental health of individuals. (Chuan et al. 2013; Gaston-Gayles and Hu 2009; Muñoz-Bullón et al. 2017; Pedersen et al. 2017). Eime et al. (2013a) noted that, among children and teenagers in a wide age group, the athletes associated with sports clubs were registering particularly better quality of life levels. Therefore, one can expect different levels of quality of life and healthy lifestyles among the students of Physical Training and Sports Schools and the students of other departments, just like the difference between the individuals who are engaged in sports and those who are not. Based on this perspective, the research question the present study focuses on is, to what extent the quality of life of individuals engaged in healthy lifestyle behaviors is improved, and whether licensed sports have an effect in this context.
on sports and health. The present study, in turn, argues that such an awareness could lead to a comparative increase in the quality of life of the students, affecting their healthy lifestyles. That is why it is important to analyze healthy lifestyle habits of young individuals (university students), to assess their quality of life, and to exhibit the relationship between such concepts and differences involved. Studies on healthy lifestyle are usually carried out with certain groups. The studies with a perspective focusing on healthy lifestyle behaviors in combination with quality of life are rather infrequent. This fact can make the results particularly significant. In this context, the two fundamental
questions the study focuses on are ‘is there a relationship between the healthy lifestyle
behaviors and the quality of life, of the students enrolled in universities?’ and ‘do socio
-demographic characteristics shape the students’ healthy lifestyles and quality of life?’
The present study aims to reveal the relationship between the healthy lifestyle behaviors and the quality of life of university students, and to assess the impact of a number of variables including but not limited to exercise, on healthy lifestyle behaviors and the quality of life.
2. Material and Methods
2.1 Research Model
The study is based on screening with the whole population or a group or sample out of the larger population, with a view to developing a general judgment about the population involving a large number of participants with respect to a subject or event (Karasar, 2016). The data was collected through surveys –a frequently employed tool within the screening method (Nachmias and Nachmias, 1996).
2.2 Data Collection
The data analyzed in the study was collected with the help of the “Personal Information Form”, “Healthy Lifestyle Behaviors Scale-II”, and “Whoqol-Bref (TR) Quality of Life
Scale”. The approval required for the study was issued by the President of Recep Tayyip Erdoğan University (letter dated 20.11.2019 no. E.2724), followed by application at the
relevant faculties, schools, and vocational schools.
2.3 Data Collection Tools
2.3.1 Personal Information Form
This form was developed by the researcher, and contains questions about a number of independent variables such as gender, age, year, faculty / school / vocational school the student is enrolled in, licensed athlete status, participation in social activities, and breakfast habits.
A. Healthy Lifestyle Behaviors Scale II
assesses behaviors to improve health, on the basis of the individual’s healthy lifestyle.
The scale is composed of a total of 52 items, divided into 6 sub-factors. These are moral and spiritual development, commitment to health, physical activity, diet, interpersonal relations, and stress management. The overall score one receives from the scale is considered the healthy lifestyle behavior score. All items used in the scale are formulated as positive statements.
The rating is based on 4-point likert scale. The scores assigned to items are 1 for never, 2 for sometimes, 3 for frequently, and 4 for regularly. The lowest and highest scores possible with the scale are 52 and 208, respectively. The scale’s Cronbach’s Alpha
reliability factor is 0.94. The Cronbach’s Alpha reliability factors for the sub-factors of the scale vary in the 0.79 to 0.87 range (Bahar, 2008). For the present study, the overall scale’s Cronbach’s Alpha reliability factor is found to be 0.91, whereas the Cronbach’s Alpha
reliability factors for sub-factors were found to be 0.82.
B. Quality of Life Scale
World Health Organization Quality of Life Instruments Brief Form (WHOQOL-BREF-TR) is developed by the World Health Organization. The purpose of the form is to assess the well-being of the individual, and to enable comparisons between cultures (Fidaner et al., 1999a; Fidaner et al., 1999b). It is the shorter version of the original WHOQOL-100 scale, which is comprised of 100 questions. It contains one question each from 24 separate sections of WHOQOL-100, as well as two additional questions about general health and quality of life. A further question was added in order to adapt the scale to Turkish context. The 27th question in the scale is the national one. The validity and reliability analyses of the scale were performed in 1999, by Eser et al. The scale allows an assessment of the quality of life, with reference to 4 distinct domains. The domains are analyzed separately, based on the assumption that they reflect independent elements of quality of life. These 4 domains are Physical Health, Psychological Health, Social Relationships, and Environmental Health. The scores for individual domains are in the 4-20 range. The higher scores reflect increased quality of life (Oliver, 1997).
a. Physical domain: The ability to carry out daily tasks, dependency on medicine and treatment, liveliness and fatigue, mobility, pain and suffering, sleep and rest, and the ability to work,
b. Psychological domain: Body image and appearance, negative emotions, self-respect, positive emotions, spirituality, religion, personal beliefs, thought, learning, memory, and the ability to focus,
Social domain: Relations with other individuals, social support, sexual life,
The Cronbach’s Alpha values assessing the internal consistency of the scale are 0.83 for the physical domain, 0.66 for the psychological domain, 0.53 for the social domain, and 0.73 for the environment domain as well as for the national setting. The Pearson coefficients calculated for each question to assess the reliability of the test range between 0.57 to 0.81. For the present study, the Cronbach’s Alpha reliability factors for sub-factors were found to be 0.75.
2.4 Hypotheses
H1: There is a correlation between the healthy lifestyle behaviors and quality of life of university students.
H2: The healthy lifestyle behaviors of students who are licensed athletes are more prominent compared to those who are not.
H3: The average scores the Physical Training and Sports School students got for the physical activity and diet sub-factors are higher than the students enrolled in other faculties and vocational schools.
H4: The licensed athlete status leads to variations in the quality of life of students.
H5: The habit of having a breakfast on a regular basis leads to variations in the quality of life of students.
2.5 The Population and the Sample
The study population is composed of 13,335 students enrolled in Recep Tayyip Erdoğan
University during the fall semester of academic year 2019-2020, as presented in Table 1.
Table 1: Study Population and the Sample
Unit Population Sample
Vocational School of Justice 414
Ardeşen Vocational School 302
Ardeşen Faculty of Tourism 96
Pazar Vocational School 167
Vocational School of Medical Services 610 48
Vocational School of Social Sciences 910 134
Vocational School of Technical Sciences 909 58
Physical Training and Sports School 303 229
Fındıklı Applied Sciences School 436
Güneysu Physiotheraphy and Rehabilitation School 255
Medical School 366
Turgut Kıran School of Nautical Sciences 105
Faculty of Dentistry 381
Faculty of Education 1546 163
Faculty of Arts and Sciences 1078 76
Faculty of Fine Arts, Design and Architecture 115
Faculty of Law 81
Faculty of Economics and Administrative Sciences 1672 143
Faculty of Divinity 1783
Aquaculture Faculty 22
Faculty of Medicine 670
Turgut Kıran Faculty of Nautical Sciences 274
Faculty of Agriculture and Natural Sciences 78
Grand Total 13335 851
2.6 Study Sample
The study is based on simple random sampling, a leading method in the larger family of probability sampling methods. Simple random sampling is based on the premise that each unit in the main group will have an equal chance of being included in the sample. In simple random sampling, the sample size can be set through two distinct approaches, based on two distinct assumptions. In the present study, the guiding principle was to
keep the difference between the sample average and the wider population’s average
remains within a certain margin at any level of probability. If the variance level of the wider population is not known, the sample size can be set on the basis of the following
formula (İslamoğlu and Alnıaçık, 2019).
𝑛 = Nz
2. pq
𝑁𝑑2 + 𝑧. 𝑝𝑞
Where:
N= Population size,
p= The rate of those with a certain characteristic in a random sample q= 1-p
d= Sensitivity level
z= Estimated reliability range
In estimating the average figure for a population of 13,335 units, with reference to a random sample to be taken out of that population, at a sensitivity rate of 5%, confidence range of 95%, and z = 3, assuming a incidence rate of 0.4 (p) and non-incidence rate of 0.6 (q), it was determined that at least 845 participants were needed for the study sample.
𝑛 = 13.335. (3
2). (0.4) . ( 0.6)
13.335. (0.05)2+ 3. (0.4). (0.6)= 845
During the study, a total of 887 students provided data. The data pertaining to 36 students who were found to respond to the surveys in an incomplete, incorrect or random way were not included in the analysis. As a result, the final sample covered by the study is composed of 851 students, as shown in Table 1. The sample size is deemed to be large enough to represent the study population.
2.7 Data Analysis
distribution (Kolmogorov Smirnov-Shapiro Wilks) can lead to significant results with larger samples, even if the distribution varies from a normal one with very small margin. That is why the test results should be evaluated in the light of skewness and kurtosis
(İslamoğlu and Alnıaçık, 2019). Özdamar (2015) states that Shapiro-Wilk test or Anderson Darling test should be applied for normality checks in any power comparison with larger samples (n>25). In the present study, Shapiro-Wilk test for used for this purpose. Moreover, to ensure a normal distribution of data, the Skewness and Kurtosis values were taken into account, on the basis of the requirement for them to be in the -2 to +2 range as argued by George and Mallery (2010).
The results of the normality test as well as the descriptive statistics reveal that the data exhibit a normal distribution. Furthermore, according to the results of the levene test, the variance levels were found to be homogenous. The data analysis was based on the average scores established through the answers 851 participants provided in response to scale questionnaires, with the application of the independent sample T-test, one-way analysis of variance (Anova), Manova, and Pearson correlation analyses. To find out which groups have caused the significant variations to arise, Scheffe test, which is a 2nd level post-hoc test, was applied. The data were tested at a significance level of α= 0.05.
3. Results and Discussion
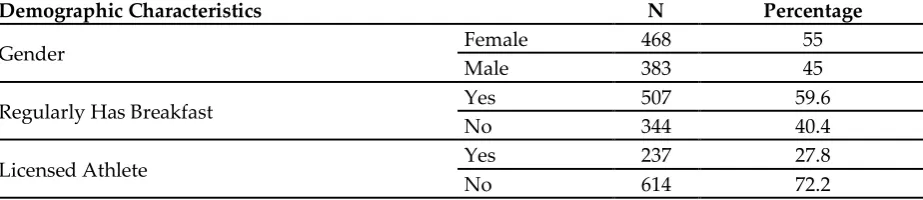
A total of 851 students took part in the study. The distribution of these students on the basis of gender, licensed athlete status, and breakfast habits is presented in Table 2.
Table 2: The frequency and percentage distribution of the demographic characteristics among the study group
Demographic Characteristics N Percentage
Gender Female 468 55
Male 383 45
Regularly Has Breakfast Yes 507 59.6
No 344 40.4
Licensed Athlete Yes 237 27.8
No 614 72.2
According to the figures, 55.00% (N=468) of the participants are female and 45.00%
(N=383) are male, 59.60%ı (N=507) regularly have breakfast, while 40.40% (N=344) do not
have a habit of having breakfast, and 72.20% (N=614) are not licensed athletes while 27.80% (N=237) are (Table 2).
Table 3: The results of the analysis of the correlation between healthy lifestyle behaviors and quality of life
Scales
Healthy Lifestyle
Physical Domain
Psychological Domain
Social Domain
Environmental Domain
Healthy Lifestyle
1 .440** .410** .324** .388**
P 0.000 0.000 0.000 0.000
N 851 851 851 851 851
* Correlation is significant at the 0.05 level (2-tailed).
The normality and linearity assumptions were checked with the preliminary analyses applied. According to the results of the analysis, there is a medium-level positive correlation between healthy lifestyle and the physical domain, psychological domain, social domain, and the environmental domain. (r=0.44, p<0.05; r=0.41, p<0.05; r=0.32, p<0.05; r=0.38, p<0.05). According to these findings, there is a medium-level correlation
between the students’ healthy lifestyles and their quality of life.
Independent samples t-test was applied for pairs at the significance level =0.05, to assess whether there is a significant variation in the students’ healthy lifestyle
behaviors on the basis of their licensed athlete status. The findings reached are presented in Table 4.
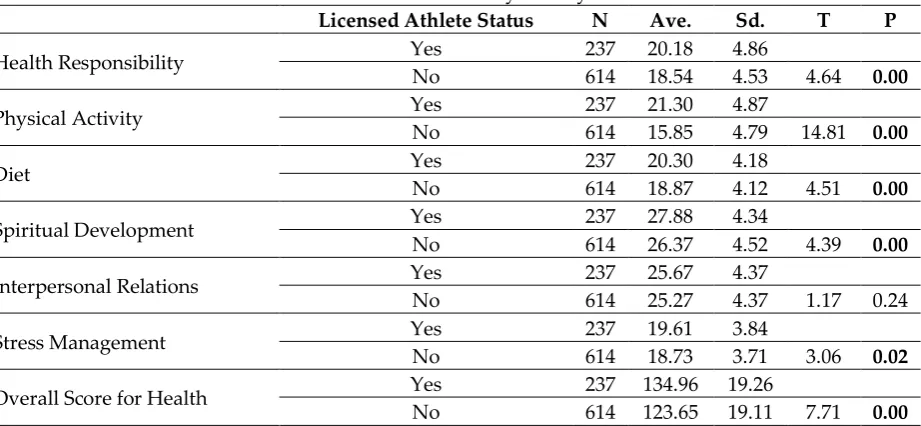
Table 4: T-Test Results based on the Licensed Athlete Status Variable, for the Sub-Dimensions of the Healthy Lifestyle Behaviors Scale
Licensed Athlete Status N Ave. Sd. T P
Health Responsibility Yes 237 20.18 4.86
No 614 18.54 4.53 4.64 0.00
Physical Activity Yes 237 21.30 4.87
No 614 15.85 4.79 14.81 0.00
Diet Yes 237 20.30 4.18
No 614 18.87 4.12 4.51 0.00
Spiritual Development Yes 237 27.88 4.34
No 614 26.37 4.52 4.39 0.00
Interpersonal Relations Yes 237 25.67 4.37
No 614 25.27 4.37 1.17 0.24
Stress Management Yes 237 19.61 3.84
No 614 18.73 3.71 3.06 0.02
Overall Score for Health Yes 237 134.96 19.26
No 614 123.65 19.11 7.71 0.00
The test results show that a statistically significant correlation exists between the licensed athlete status and a positive difference between the arithmetic mean figures for the
groups, for “Health Responsibility”, “Physical Activity”, “Diet”, “Spiritual Development”, “Stress Management” and “Overall Healthy Lifestyle Score”, whereas no statistically significant difference was observed for the “Interpersonal Relations” sub -factor (t.849=4.64; p<0.05, t.849=14.81; p<0.05, t.849=4.51; p<0.05, t.849=4.39; p<0.05, t.849=1.17;
One-way Anova test was applied at a significance level of =0.05, to see whether a significant variation exists between the students’ scores for the physical activity and diet
sub-factors, with reference to the type of school they are enrolled in. The results of the analysis are provided in Table 5.
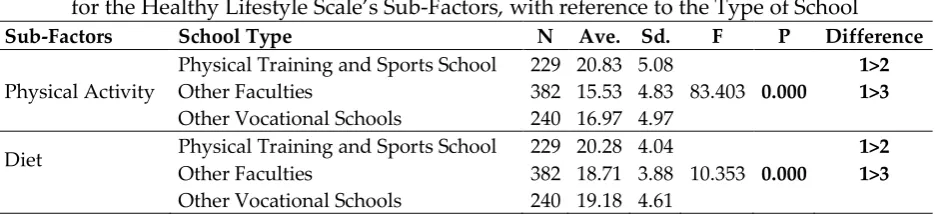
Table 5: The Results of the One-Way Anova Test
for the Healthy Lifestyle Scale’s Sub-Factors, with reference to the Type of School
Sub-Factors School Type N Ave. Sd. F P Difference
Physical Activity
Physical Training and Sports School 229 20.83 5.08 1>2
Other Faculties 382 15.53 4.83 83.403 0.000 1>3
Other Vocational Schools 240 16.97 4.97
Diet Physical Training and Sports School 229 20.28 4.04 1>2 Other Faculties 382 18.71 3.88 10.353 0.000 1>3
Other Vocational Schools 240 19.18 4.61
The test results suggest a significant difference between the scores for the physical activity and diet sub-factors, with reference to the type of school. The Scheffe test applied to see among which groups a significant difference exists revealed that the students of the Physical Training and Sports School (χ =20.83) had higher average scores for the
physical activity sub-factor, compared to the students of other faculties (χ =15.53) and other vocational schools (χ =16.97) (F2.848; 83.403; p<0.05). Again, the students of the
Physical Training and Sports School (χ =20.28) were found to have higher average scores
for the diet sub-factor, than those of other faculties (χ =18.71) and other vocational school (χ =19.18) (F2.848; 10.353; p<0.05).
The results of the Manova test applied to see if the licensed athlete status has an effect on various sub-factors of the quality of life scale, are presented in Table 6.
Table 6: The Results of the Manova Test Comparing the Quality of Life of Various Groups of Students, with reference to the Licensed Athlete Status
Wilks' Lambda F Hypothesis Sd Error Sd P
0.980 4.297 4 846 0.002
The analyses were preceded with an assessment of the assumptions required to ensure the applicability of the Manova test. In this context, the linearity, single- and multi-variable normality, variance-covariance matrix homogeneity, and multicollinearity analyses were carried out (Büyüköztürk, 2013; Pallant, 2005). The dependent variables histograms for single-variable normality were reviewed, along with an assessment of the skewness and kurtosis values. The preliminary analyses did not reveal any violations.
The MANOVA test applied on sub-factors of the quality of life scale shows that
the participants’ scores for the sub-factors of the quality of life scale varied with reference to the licensed athlete status (WilksL(λ)=.980; F(4.846)=4.297; p<0.05). This result shows
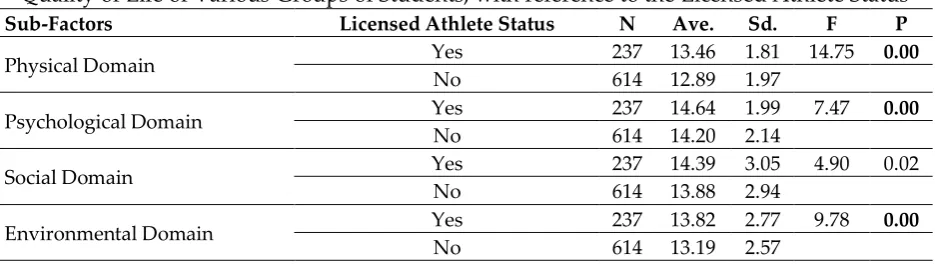
As a significant difference was found in the Manova test, Anova test was also applied to see how the group averages varied with reference to the licensed athlete status, producing the results presented in Table 7. The analysis of the results obtained for individual dependent variables, separately for the Bonferroni adjusted alpha of 0.0125,
the results of the Anova test revealed significant variation in the participants’ scores for
the physical domain, psychological domain, and environmental domain sub-dimensions (F(1.849) =14.75, p=0.00, F(1.849) =7.47, p=0.00, F(1.849) =9.78, p=0.00).
Table 7: The Results of the Anova Test Comparing the
Quality of Life of Various Groups of Students, with reference to the Licensed Athlete Status
Sub-Factors Licensed Athlete Status N Ave. Sd. F P
Physical Domain Yes 237 13.46 1.81 14.75 0.00
No 614 12.89 1.97
Psychological Domain Yes 237 14.64 1.99 7.47 0.00
No 614 14.20 2.14
Social Domain Yes 237 14.39 3.05 4.90 0.02
No 614 13.88 2.94
Environmental Domain Yes 237 13.82 2.77 9.78 0.00
No 614 13.19 2.57
The results of the Manova test applied to see if having regular breakfasts has an effect on various sub-factors of the quality of life scale, are presented in Table 8.
Table 8: The Results of the Manova Test Comparing the
Quality of Life of Various Groups of Students, with reference to Having Regular Breakfasts
Wilks' Lambda F Hypothesis Sd Error Sd P
0.986 2.984 4 846 0.018
The MANOVA test applied on sub-factors of the quality of life scale shows that the
participants’ scores for the sub-factors of the quality of life scale varied with reference to
having regular breakfasts (WilksL(λ)=.986; F(4.846)=2.984; p<0.05). This result shows that
the scores to be obtained from the linear component comprised of the scores for sub-factors vary with reference to habit of having regular breakfasts.
As a significant difference was found in the Manova test, Anova test was also applied to see how the group averages varied with reference to the habit of having regular breakfasts, producing the results presented in Table 9.
The analysis of the results obtained for individual dependent variables, separately for the Bonferroni adjusted alpha of 0.0125, the results of the Anova test revealed
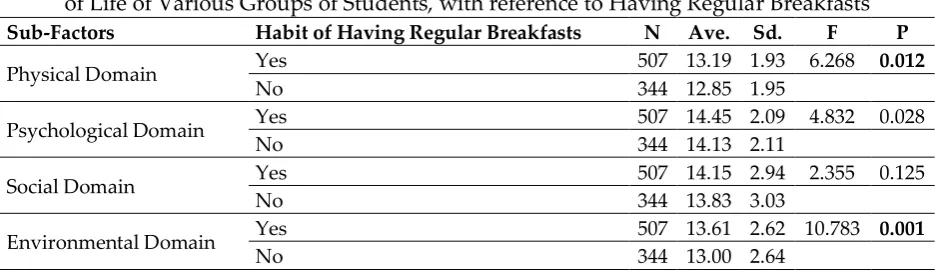
Table 9: The Results of the Anova Test Comparing the Quality
of Life of Various Groups of Students, with reference to Having Regular Breakfasts
Sub-Factors Habit of Having Regular Breakfasts N Ave. Sd. F P
Physical Domain Yes 507 13.19 1.93 6.268 0.012
No 344 12.85 1.95
Psychological Domain Yes 507 14.45 2.09 4.832 0.028
No 344 14.13 2.11
Social Domain Yes 507 14.15 2.94 2.355 0.125
No 344 13.83 3.03
Environmental Domain Yes 507 13.61 2.62 10.783 0.001
No 344 13.00 2.64
4. Discussion
Today, physical activity stands out as the leading means to enhance health and the quality of life through sustainable action, with strong support in evidence-based studies (Liguori et al., 2019). Based on this perspective, the present study aims to reveal the relationship between the healthy lifestyle behaviors and the quality of life of university students, and to assess the impact of a number of variables including but not limited to exercise, on healthy lifestyle behaviors and the quality of life. There is a medium-level positive correlation between healthy lifestyle and the physical domain, psychological domain, social domain, and the environmental domain sub-factors of quality of life. This finding is supported by the hypothesis H1. There is a medium-level correlation between the students’ healthy lifestyles and their quality of life. In other words, developing and adopting healthy lifestyle behaviors leads to an increase in carrying out daily tasks and the ability to work, not to mention self-respect and other positive feelings. Moreover, there will arguably be medium-level improvements on the physical safety feelings, making more effective use of spare time, interpersonal relations, and sexual satisfaction fronts.
The test results suggest that there are statistically significant positive correlations between licensed athlete status, and the arithmetic averages of the groups’ scores for
health responsibility, physical activity, diet, spiritual development, stress management, and healthy lifestyle in general. However, no statistically significant variation was observed with the interpersonal relations sub-factor. These findings support hypothesis H2. It is possible to argue that the university students who exercise and engage in sports
improving health. Ertop et al. (2012) as well as Lee and Loke (2005) found that the students who engage in regular exercise had much higher average healthy lifestyle behavior scale scores compared to those who do not. Their findings, thus, are consistent with those of the present study.
The results suggest a significant difference between the scores for the physical activity and diet sub-factors, with reference to the type of school. The Scheffe test applied to see among which groups a significant difference exists revealed that the students of the Physical Training and Sports School had higher average scores for the physical activity and diet sub-factors, compared to the students of other faculties and other vocational schools. These findings support hypothesis H3. Regular exercise and sports, as
well as informed dietary habits can be considered two leading preconditions of healthy life. The Physical Training and Sports School students, in their turn, exhibit a more attentive perspective towards these, probably due to the following reasons: The theoretical and applied courses on sports, as offered at Physical Training and Sports Schools are rather intensive compared to those offered in other undergraduate and associate degree programs. Moreover, the students of these schools have a more informed perspective towards exercise and sports, as they take dedicated courses on sports, health, and diet. Karabulut and Altun (2018) found that the women engaged in sports have higher scores for physical activity and diet sub-factors compared to those who are not. Their findings, thus, are consistent with those of the present study.
The test results suggest that the quality of life of university students vary with reference to them being licensed athletes or not. This result shows that the scores to be obtained from the linear component comprised of the scores for sub-factors varies with reference to actual engagement in sports. This finding is supported by the hypothesis H4.
Analyzed one by one, the results pertaining to individual sub-factors revealed statistically significant variations in the average scores for physical, physiological, and environmental domains, to the benefit of the students engaged in sports. On the social domain, however, the difference was not statistically significant, even though the students engaged in sports had higher average scores. Given their higher physical fitness levels, the students engaged in sports are characterized by improved ability to carry out daily tasks and work. Furthermore, the increased self-respect and other positive feelings enjoyed by the students engaged in sports, as well as their markedly better standings on physical safety feelings and making more effective use of spare time, compared to those of the students who are not engaged in sports, supports what the literature observed
The findings suggest that the quality of life of university students vary with reference to their regular breakfast habits. This result shows that the scores to be obtained from the linear component comprised of the scores for sub-factors varies with reference to habit of having regular breakfasts. This finding is supported by the hypothesis H5.
Analyzed one by one, the results pertaining to individual sub-factors revealed statistically significant variations in the average scores for physical and environmental domains, to the benefit of the students who have breakfast on a regular basis. According to current results, having breakfast on a regular basis supports a more active and dynamic life. One can argue that starting one’s day with breakfast is the indicator of
higher life quality levels, especially among university students.
4. Recommendations
The most prominent limitation of the present study is that it was carried out with the students of a state university. Future studies can work with samples including students of private universities and other state universities, so as to look at the matter from a wider perspective. Future studies can also make specific references to the type of sports the participants engage in, so as to perform a more detailed analysis. Finally, other variables the present study did not investigate can also be covered in future studies.
5. Conclusion
In conclusion, one can forcefully argue that university students can enjoyed increased levels of quality of life, by developing healthy lifestyle behaviors. Sports, physical activities, and exercise arguably contribute to instilling in and sustaining healthy lifestyle behaviors. One can also argue that the fact that Physical Training and Sports School students exhibit healthier lifestyle behaviors compared to other university students is a result of the theoretical and applied sports engagements and activities they have. The higher levels of quality of life among the students who are engaged in sports compared to those who are not, in a sense, prove that sports is an indicator of healthy life. Finally, the findings we reached suggest that starting the day with a breakfast on a regular basis is a precursor of a more active and dynamic life, especially in the case of university students.
References
Alexandre, T. S., Cordeiro, R. C. and Ramos, L. R. (2009). Factors Associated to Quality of Life in Active Elderly. Rev Saude Publica, 43(4), 613-621.
Bahar, Z., Beşer, A., Gördes, N., Ersin, F., & Kıssal, A. (2008). Sağlıklı yaşam biçimi davranışları ölçeği II’nin geçerlik ve güvenirlik çalışması. Cumhuriyet
Bize, R., Johnson, J. A., & Plotnikoff, R. C. (2007). Physical activity level and health-related quality of life in the general adult population: a systematic review. Preventive medicine, 45(6), 401-415.; 45: 401-415.
Bozkuş, T., Türkmen, M., Kul, M., Özkan, A., Öz, Ü., & Cengiz, C. (2013). Beden Eğitimi ve Spor Yüksekokulu’nda Öğrenim Gören Öğrencilerin Fiziksel Aktivite Düzeyleri ile Sağlıklı Yaşam Biçimi Davranışlarının Belirlenmesi ve
İlişkilendirilmesi. International Journal of Sport Culture and Science, 1(3), 49-65.
Büyüköztürk, Ş. (2013). Sosyal bilimler için veri analizi el kitabı. Ankara: Pegem
Akademi.
Chuan, C. C., Yusof, A., & Shah, S. P. (2013). Sports involvement and academic achievement: A study of Malaysian University athletes. International Education Studies, 6, 12–21.
Eime, R. M., Young, J. A., Harvey, J. T., Charity, M. J., & Payne, W. R. (2013a). A systematic review of the psychological and social benefits of participation in sport for children and adolescents: Informing development of a conceptual model of health through sport. International Journal of Behavioral Nutrition and Physical Activity, 10(1), 98–119. https://doi.org/10.1186/1479-5868-10-98.
Eime, R. M., Young, J. A., Harvey, J. T., Charity, M. J., & Payne, W. R. (2013b). A systematic review of the psychological and social benefits of participation in sport for adults: informing development of a conceptual model of health through sport. International journal of behavioral nutrition and physical activity, 10(1), 135.
Ertop, N. G., Yılmaz, A., & Erdem, Y. (2012). Üniversite Öğrencilerinin Sağlıklı Yaşam Biçimleri. Kırıkkale Üniversitesi Tıp Fakültesi Dergisi, 14(2), 1-7.
Eser, E., Fidaner, H., Fidaner, C., Eser, S. Y., Elbi, H., & Göker, E. (1999). WHOQOL-100 ve WHOQOL-BREF'in psikometrik özellikleri. Psikiyatri Psikoloji Psikofarmakoloji (3P) Dergisi, 7(Suppl 2), 23-40.
Farhud, D. D. (2015). Impact of lifestyle on health. Iranian Journal of Public Health, 44, 1442–1444.
Fidaner, H., Elbi, H., Fidaner, C., Eser, S. Y., Eser, E. and Göker, E. (1999a). Psychometric properties of WHOQOL-100 and WHOQOL-BREF. 3P Dergisi, 7(Ek 2), 23-40. Fidaner, H., Elbi, H., Fidaner, C., Eser, S. Y., Eser, E. and Göker, E. (1999b). Measure of
quality of life WHOQOL-100 and WHOQOL-Bref. 3P Dergisi, 7(Ek 2), 5-13.
Gaston-Gayles, J. L., & Hu, S. (2009). The influence of student engagement and sport participation on college outcomes among division I student athletes. Journal of Higher Education, 80, 315–333.
George, D. and Mallery, M. (2010). SPSS for Windows step by step: A simple guide and reference 17.0 update (10th ed.) Boston: Pearson.
Güler, D. (2006). Mastalji, Yaşam Kalitesi ve Depresyon, Dissertation for Specialization, Sağlık Bakanlığı Şişli Etfal Research Hospital, Family Practice, Istanbul, 64-65.
Hudd, S. S., Dumlao, J., Erdmann-Sager, D., Murray, D., Phan, E., Soukas, N., and Yokozuka, N., (2000). Stress at college: Effects on health habits, health status and self-esteem. College Student Journal, 34, 217–228.
İslamoğlu, A. H.-Ü. Alnıaçık, Sosyal Bilimlerde Araştırma Yöntemleri, Beta Yayınevi,
Istanbul 2019.
Karabulut, E. O., & Altun, M. (2018). Düzenli olarak spor yapan ve yapmayan kadınların sağlıklı yaşam biçimi davranışlarının farklı değişkenler bakımından incelenmesi:
Kırşehir ili örneği. KEFAD, 19(1), 936-948.
Karasar, N. (2016). Bilimsel araştırma yöntemi. Ankara: Nobel Yayıncılık.
Kelly, S. A., Melnyk, B. M., Jacobson, D. L., & O'Haver, J. A. (2011). Correlates among healthy lifestyle cognitive beliefs, healthy lifestyle choices, social support, and healthy behaviors in adolescents: Implications for behavioral change strategies and future research. Journal of Pediatric Health Care, 25, 216–223.
Keskinoğlu, P. (2010, 25-27 Mart). Yaşam kalitesini etkileyen nedenler. Paper presented at the 3rd Conference on the Quality of Life in National Health, Izmir.
Lee, R. L., & Loke, A. J. Y. (2005). Health‐promoting behaviors and psychosocial well‐
being of university students in Hong Kong. Public health nursing, 22(3), 209-220. Liguori, G., Gallé, F., Di Onofrio, V., Valeriani, F., & Spica, V. R. (2019). Higher education
on physical activity and sport: The Movement Sciences graduate as a resource to promote healthy lifestyles in the National Health System. Ann Ig, 31(6), 642-8. Mäkelä, S.; Aaltonen, S.; Korhonen, T.; Rose, R. J.; Kaprio, J. (2017). Diversity of
leisure-time sport activities in adolescence as a predictor of leisure-leisure-time physical activity in adulthood. Scand. J. Med. Sci. Sports , 27, 1902–1912.
McIsaac, J. L., Kirk, S., & Kuhle, S. (2015). The association between health behaviours and academic performance in Canadian elementary school students: A cross-sectional study. International Journal of Environmental Research and Public Health, 12, 14857–14871.
Muñoz-Bullón, F., Sanchez-Bueno, M. J., & Vos-Saz, A. (2017). The influence of sports participation on academic performance among students in higher education. Sport Management Review, 20, 365– 378.
Nachmias C. F. and Nachmias D. (1996). Research methods in the social sciences (5th Edition). New York: St. Martin's Press.
Ocakçı, Ayşe Ferda (2007). Sağlığın Korunma ve Geliştirilmesinde Hemşirelik
Hizmetlerinin Rolü, [URL: http://server.karaelmas.edu.tr/saglik/skg.htm], Access Date: 08.01.2007.
Oliver, M. (1997). WHOQOL-Bref. University of Washington Seattle, United States of America, U.S. Version, 5-31.
Özdamar, K., Paket Programlar ile İstatistiksel Veri Analizi, Nisan Yayınevi, Ankara
2015.
Pedersen, M. T., Vorup, J., Nistrup, A., Wikman, J. M., Alstrøm, J. M., Melcher, P. S., Pfister, G. U., & Bangsbo, J. (2017). Effect of team sports and resistance training on physical function, quality of life, and motivation in older adults. Scandinavian journal of medicine & science in sports, 27(8), 852-864.
Spilker, B. (1996.). Quality of Life and Pharmacoeconomics in Clinical Trials (2nd ed). Philadelphia: Lippincott-Raven Publishers.
Testa, M. A. and Simonson, D. C. (1996) Assessment of Quality of Life Outcomes. New England Journal of Medicine, 334, 835-340.
Vella, S. A., Cliff, D. P., Magee, C. A., Okely, A. D. (2015). Associations between sports participation and psychological difficulties during childhood: A two-year follow up. J. Sci. Med. Sport 18, 304-309
Vergili, Ö. (2012). Sağlıklı sedanter kadınlarda kalistenik ve pilates egzersizlerinin sağlıkla ilişkili yaşam kalitesi üzerindeki etkileri. Kırıkkale Üniversitesi Tıp
Fakültesi Dergisi, 14(3), 14-20.
Walker S. N., Hill-Polerecky D. M. (1996). Psychometric evaluation of the Health Promoting Lifestyle Profile II. Unpublished manuscript, University of Nebraska Medical Center.
Walker S. N., Sechrist K. R. & Pender N. J. (1987) The Health Promoting Lifestyle Profile development and psychometric characteristics. Nursing Research, 36(2): 76-80.
Zaybak, A. and Fadıloğlu, Ç. (2004). Üniversite Öğrencilerinin Sağlığı Geliştirme Davranışı Ve Bu Davranışı Etkileyen Etmenlerin Belirlenmesi, Ege Üniversitesi
Creative Commons licensing terms